. 2023 Aug 25;9(34):eadd7399.
doi: 10.1126/sciadv.add7399. Epub 2023 Aug 23.

Amphiregulin couples IL1RL1+ regulatory T cells and cancer-associated fibroblasts to impede antitumor immunity

Affiliations

Amphiregulin couples IL1RL1+ regulatory T cells and cancer-associated fibroblasts to impede antitumor immunity

Runzi Sun et al. Sci Adv. .

Abstract

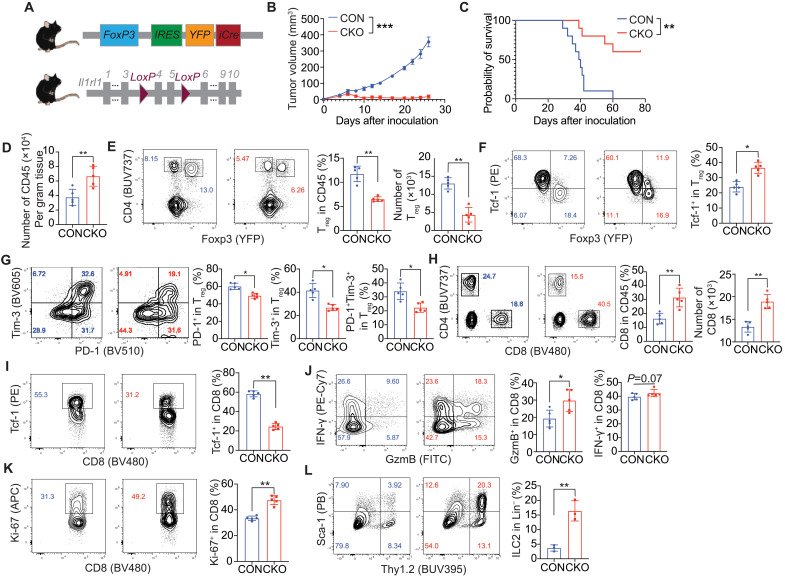
Regulatory T (Treg) cells and cancer-associated fibroblasts (CAFs) jointly promote tumor immune tolerance and tumorigenesis. The molecular apparatus that drives Treg cell and CAF coordination in the tumor microenvironment (TME) remains elusive. Interleukin 33 (IL-33) has been shown to enhance fibrosis and IL1RL1+ Treg cell accumulation during tumorigenesis and tissue repair. We demonstrated that IL1RL1 signaling in Treg cells greatly dampened the antitumor activity of both IL-33 and PD-1 blockade. Whole tumor single-cell RNA sequencing (scRNA-seq) analysis and blockade experiments revealed that the amphiregulin (AREG)-epidermal growth factor receptor (EGFR) axis mediated cross-talk between IL1RL1+ Treg cells and CAFs. We further demonstrated that the AREG/EGFR axis enables Treg cells to promote a profibrotic and immunosuppressive functional state of CAFs. Moreover, AREG mAbs and IL-33 concertedly inhibited tumor growth. Our study reveals a previously unidentified AREG/EGFR-mediated Treg/CAF coupling that controls the bifurcation of fibroblast functional states and is a critical barrier for cancer immunotherapy.


Figures

Fig. 1.
Fig. 1.. scRNA-seq analysis of CD8+ T cells in the TME of B16 and B16–IL-33.
(A) UMAP dimensionality reduction projects CD8+ T cells from B16 and B16–IL-33 tumors to two dimensions showing six subclusters differentiated by color and trajectory analysis of different CD8 clusters. Each point represents a single cell, with cells of similar gene expression profiles positioned closer together in the projection. (B) Density plot for CD8+ T cells in the B16 (left) and B16–IL-33 (right) conditions. (C) Violin plot shows the expression of the top marker gene for all six clusters based on adjusted P value and log2 fold change (log2FC). (D) Bar plot showing the percentage of cells in each CD8+ T cell cluster based on tumor origin (B16 versus B16–IL-33). (E) Bar plot showing the total unique TCR clones in all CD8 clusters from B16 or B16–IL-33. (F) Bar plot showing the percentage of clonally expanded cells in each CD8+ T cell cluster. (G) Bar plot showing the average clonal size in each CD8+ T cell cluster. (H) Distribution of two representative CD8 clones on the UMAP plot. (I) Scatter plot comparing the percent of clonal cells (x) and percent of shared clonal cells in each cluster (y). The heatmap in the right panel depicts the percent of clonal cells shared between clusters.
Fig. 2.
Fig. 2.. IL1RL1+ Treg cells were greatly increased in the IL-33–expressing tumors.
(A) UMAP dimensionality reduction projects Treg cells from B16 and B16–IL-33 tumors to two dimensions showing six subclusters differentiated by color. Each point represents a single cell, with cells of similar gene expression profiles positioned closer together in the projection. (B) Density plot for Treg cells in the B16 (left) and B16–IL-33 (right) conditions. (C) Dot plot shows the expression of the top marker gene for all six clusters based on adjusted P value and log2FC. (D) Bar plot showing the percentage of cells in each Treg cell cluster based on tumor origin (B16 versus B16–IL-33). (E) Bar plot showing the average clonal size in Treg cells in B16 or B16–IL-33 tumors. (F) Bar plot showing the percentage of clonally expanded cells in each Treg cell cluster. (G) MC38 tumor cells (1 × 10⁶) were inoculated intradermally into the right flank of the C57BL/6J mice. IL-33 protein or PBS was adminstered starting from day 5 and again every 4 days for a total of three times. Representative flow cytometry plot showing ST2 staining gated on Treg cells 17 days post-tumor inoculation. Bar plot showing the percentage and number of ST2+ Treg cells. Data are representative of three independent experiments in (G). Bar graphs represent data summarized as means ± SEM. **P < 0.01 and ****P < 0.0001. PE, phycoerythrin.
Fig. 3.
Fig. 3.. Specific deletion of on Il1rl1 in Tregs altered lymphocyte population in the TME.
(A) strategy of generation of Foxp3creIl1rl1flox/flox mice. (B and C). B16–IL-33 tumor cells (1 × 10⁵) were inoculated intradermally into the right flank of the female CON (Foxp3cre/cre) and CKO (Foxp3cre/creIl1rl1flox/flox) mice. Tumor size was monitored every 2 days. Tumor curve (B) and overall survival (C) of B16–IL-33 tumor-bearing mice. (D) Bar plot showing the number of CD45 cells per gram tumor tissue in B16–IL-33 tumor-bearing CON and CKO mice. (E) Representative flow cytometry plot and a quantitative plot showing the percentage and number of Treg cells. (F) Representative flow cytometry plot and a quantitative plot showing the percentage of Tcf-1+ Treg cells. (G) Representative flow cytometry plot and quantitative plot of the percentage of PD-1+, Tim-3+, or PD-1+Tim-3+ Treg cells. (H) Representative flow cytometry plot and quantitative plot showing the percentage and number of CD8+ T cells. (I) Representative flow cytometry plot and quantitative plot showing the percentage of Tcf-1+ CD8+ T cells. (J) Representative flow cytometry plot and quantitative plot showing the percentage of GzmB+ CD8+ T cells and IFN-γ+ CD8+ T cells. (K) Representative flow cytometry plot and quantitative plot showing the percentage of Ki-67+ CD8+ T cells. (L) Representative flow cytometry plot and quantitative plot showing the percentage of ILC2 cells. Day 13 tumors were analyzed in (D), and day 8 tumors were analyzed in (E) to (I). Data shown are representative of three to five independent experiments. Graphs shown represent data summarized as means ± SEM and were analyzed by unpaired two-tailed Student’s t test. Two-way analysis of variance (ANOVA) was used to determine statistical significance for time points when all mice were viable for tumor measurement. *P < 0.05, **P < 0.01, and ***P < 0.001. APC, allophycocyanin; PB, Pacific Blue; YFP, yellow fluorescent protein; IRES, internal ribosomal entry site; FITC, fluorescein isothiocyanate.
Fig. 4.
Fig. 4.. The changes of myeloid compartments in the TME upon deletion of Il1rl1 in Treg cells.
(A) Representative flow cytometry plot and quantitative plot showing the percentage CD11b+ cells in total CD45+ cells. (B) Representative flow cytometry plot and quantitative plot showing the percentage and number of monocytic MDSCs and granulocytic MDSCs. (C) Representative flow cytometry plot and quantitative plot of the percentage of CD86+, MHC-II+, or CD86+MHC-II + monocytes. (D) Representative flow cytometry plot and quantitative plot showing the percentage of DCs in total CD45+ cells. (E) Representative flow cytometry plot and quantitative plot showing the percentage and number of infiltrating macrophages. (F) Representative flow cytometry plot and quantitative plot showing the percentage and number of type 1 and type 2 macrophages. Data shown are representative of three to five independent experiments (day 8 takedown). Graphs shown represent data summarized as means ± SEM and were analyzed by unpaired two-tailed Student’s t test. *P < 0.05 and **P < 0.01.
Fig. 5.
Fig. 5.. Global transcriptional landscape of Treg cells from tumor-bearing CON or CKO mice.
(A) UMAP dimensionality reduction projects Treg cells from day 9 B16–IL-33 tumor-bearing CON or CKO mice to two dimensions showing six subclusters differentiated by color. Each point represents a single cell, with cells of similar gene expression profiles positioned closer together in the projection. (B) Density plot for Treg cells in CON (left) or CKO (right) mice. (C) Bar plot showing the percentage of cells in each Treg cell cluster based on the tumor origin (CON mice versus CKO mice). (D) Bar plot showing the percentage of clonally expanded cells in each Treg cell cluster. (E) UMAP projection comparing the distribution of Bcl3 regulon in B16–IL-33 tumor-bearing CON or CKO mice. (F) Motif enriched in the promoter region of Bcl3 target genes generated by HOMER. (G) Violin plot showing the Bcl3 regulon activity of Treg cells in all clusters and in IL1RL1+ Treg cluster. (H) UMAP projection comparing the distribution of Nfkb2 regulon in B16–IL-33 tumor-bearing CON or CKO mice. (I) Motif enriched in the promoter region of Nfkb2 target genes generated by HOMER. (J) Violin plot showing the Nfkb2 regulon activity of Treg cells in all clusters and in IL1RL1+ Treg cluster. **P < 0.01 and ****P < 0.0001. RHD, Rel homology domain; NFκB, nuclear factor κB.
Fig. 6.
Fig. 6.. Areg/EGFR enabled IL1RL1+ Tregs and CAFs cross-talk to drive tumor immune suppression.
(A) Dot plot showing the Areg gene expression across all Treg clusters in B16 and B16–IL-33 tumors (left) and in B16–IL-33 tumor-bearing CON and CKO mice (right). (B) Genome track of Areg locus in lung tissue IL1RL1+ Treg cells and other Treg cells. (C) Dot plot showing the Areg gene expression level across all clusters in B16–IL-33 tumor microenvironment based on whole tumor scRNA-seq analysis. (D) Dot plot showing the Egfr gene expression level across all clusters in the B16–IL-33 tumor microenvironment based on whole tumor scRNA-seq analysis. (E) B16–IL-33 tumor cells (1 × 10⁵) were inoculated intradermally into the right flank of the CON and CKO mice. Anti-Areg antibody (50 μg per mouse) was treated starting from day 5 and every 4 days for a total of three times. Tumor growth curves and overall survival of B16–IL-33 tumor-bearing mice are shown. (F) Dot plot showing the up-regulated genes in CAFs from B16–IL-33 tumor-bearing mice treated after an anti-Areg antibody treatment based on whole tumor scRNA-seq analysis. (G) Dot plot showing the down-regulated genes in CAFs from B16–IL-33 tumor-bearing mice treated after an anti-Areg antibody treatment (day 9) based on whole tumor scRNA-seq analysis. (H) Bar plot showing the percentage of clonally expanded cells in CD8+ T cells based on whole tumor scRNA-seq analysis. (I) Bar plot showing the percentage of clonally expanded cells in Treg cells based on whole tumor scRNA-seq analysis. Data shown are representative of three independent experiments. Graphs shown represent data summarized as means ± SEM and were analyzed by two-way ANOVA. **P < 0.01. NKT, natural killer T; DC, dendritic cell; TAM1, type 1 tumor-associated macrophage; convCD4, conventional CD4; IgG, immunoglobulin G.

References

    1. C. Moussion, N. Ortega, J. P. Girard, The IL-1-like cytokine IL-33 is constitutively expressed in the nucleus of endothelial cells and epithelial cells in vivo: A novel 'alarmin'? PLOS ONE 3, e3331 (2008). - PMC - PubMed
    1. F. Y. Liew, J. P. Girard, H. R. Turnquist, Interleukin-33 in health and disease. Nat. Rev. Immunol. 16, 676–689 (2016). - PubMed
    1. C. Cayrol, J. P. Girard, Interleukin-33 (IL-33): A nuclear cytokine from the IL-1 family. Immunol. Rev. 281, 154–168 (2018). - PubMed
    1. M. Yang, Y. Feng, C. Yue, B. Xu, L. Chen, J. Jiang, B. Lu, Y. Zhu, Lower expression level of IL-33 is associated with poor prognosis of pulmonary adenocarcinoma. PLOS ONE 13, e0193428 (2018). - PMC - PubMed
    1. B. Lu, M. Yang, Q. Wang, Interleukin-33 in tumorigenesis, tumor immune evasion, and cancer immunotherapy. J. Mol. Med. (Berl) 94, 535–543 (2016). - PubMed