. 2023 Aug 29;42(8):112994.
doi: 10.1016/j.celrep.2023.112994. Epub 2023 Aug 22.

Cell-type-specific regulation of APOE and CLU levels in human neurons by the Alzheimer's disease risk gene SORL1

Affiliations

Cell-type-specific regulation of APOE and CLU levels in human neurons by the Alzheimer's disease risk gene SORL1

Hyo Lee et al. Cell Rep. .

Abstract

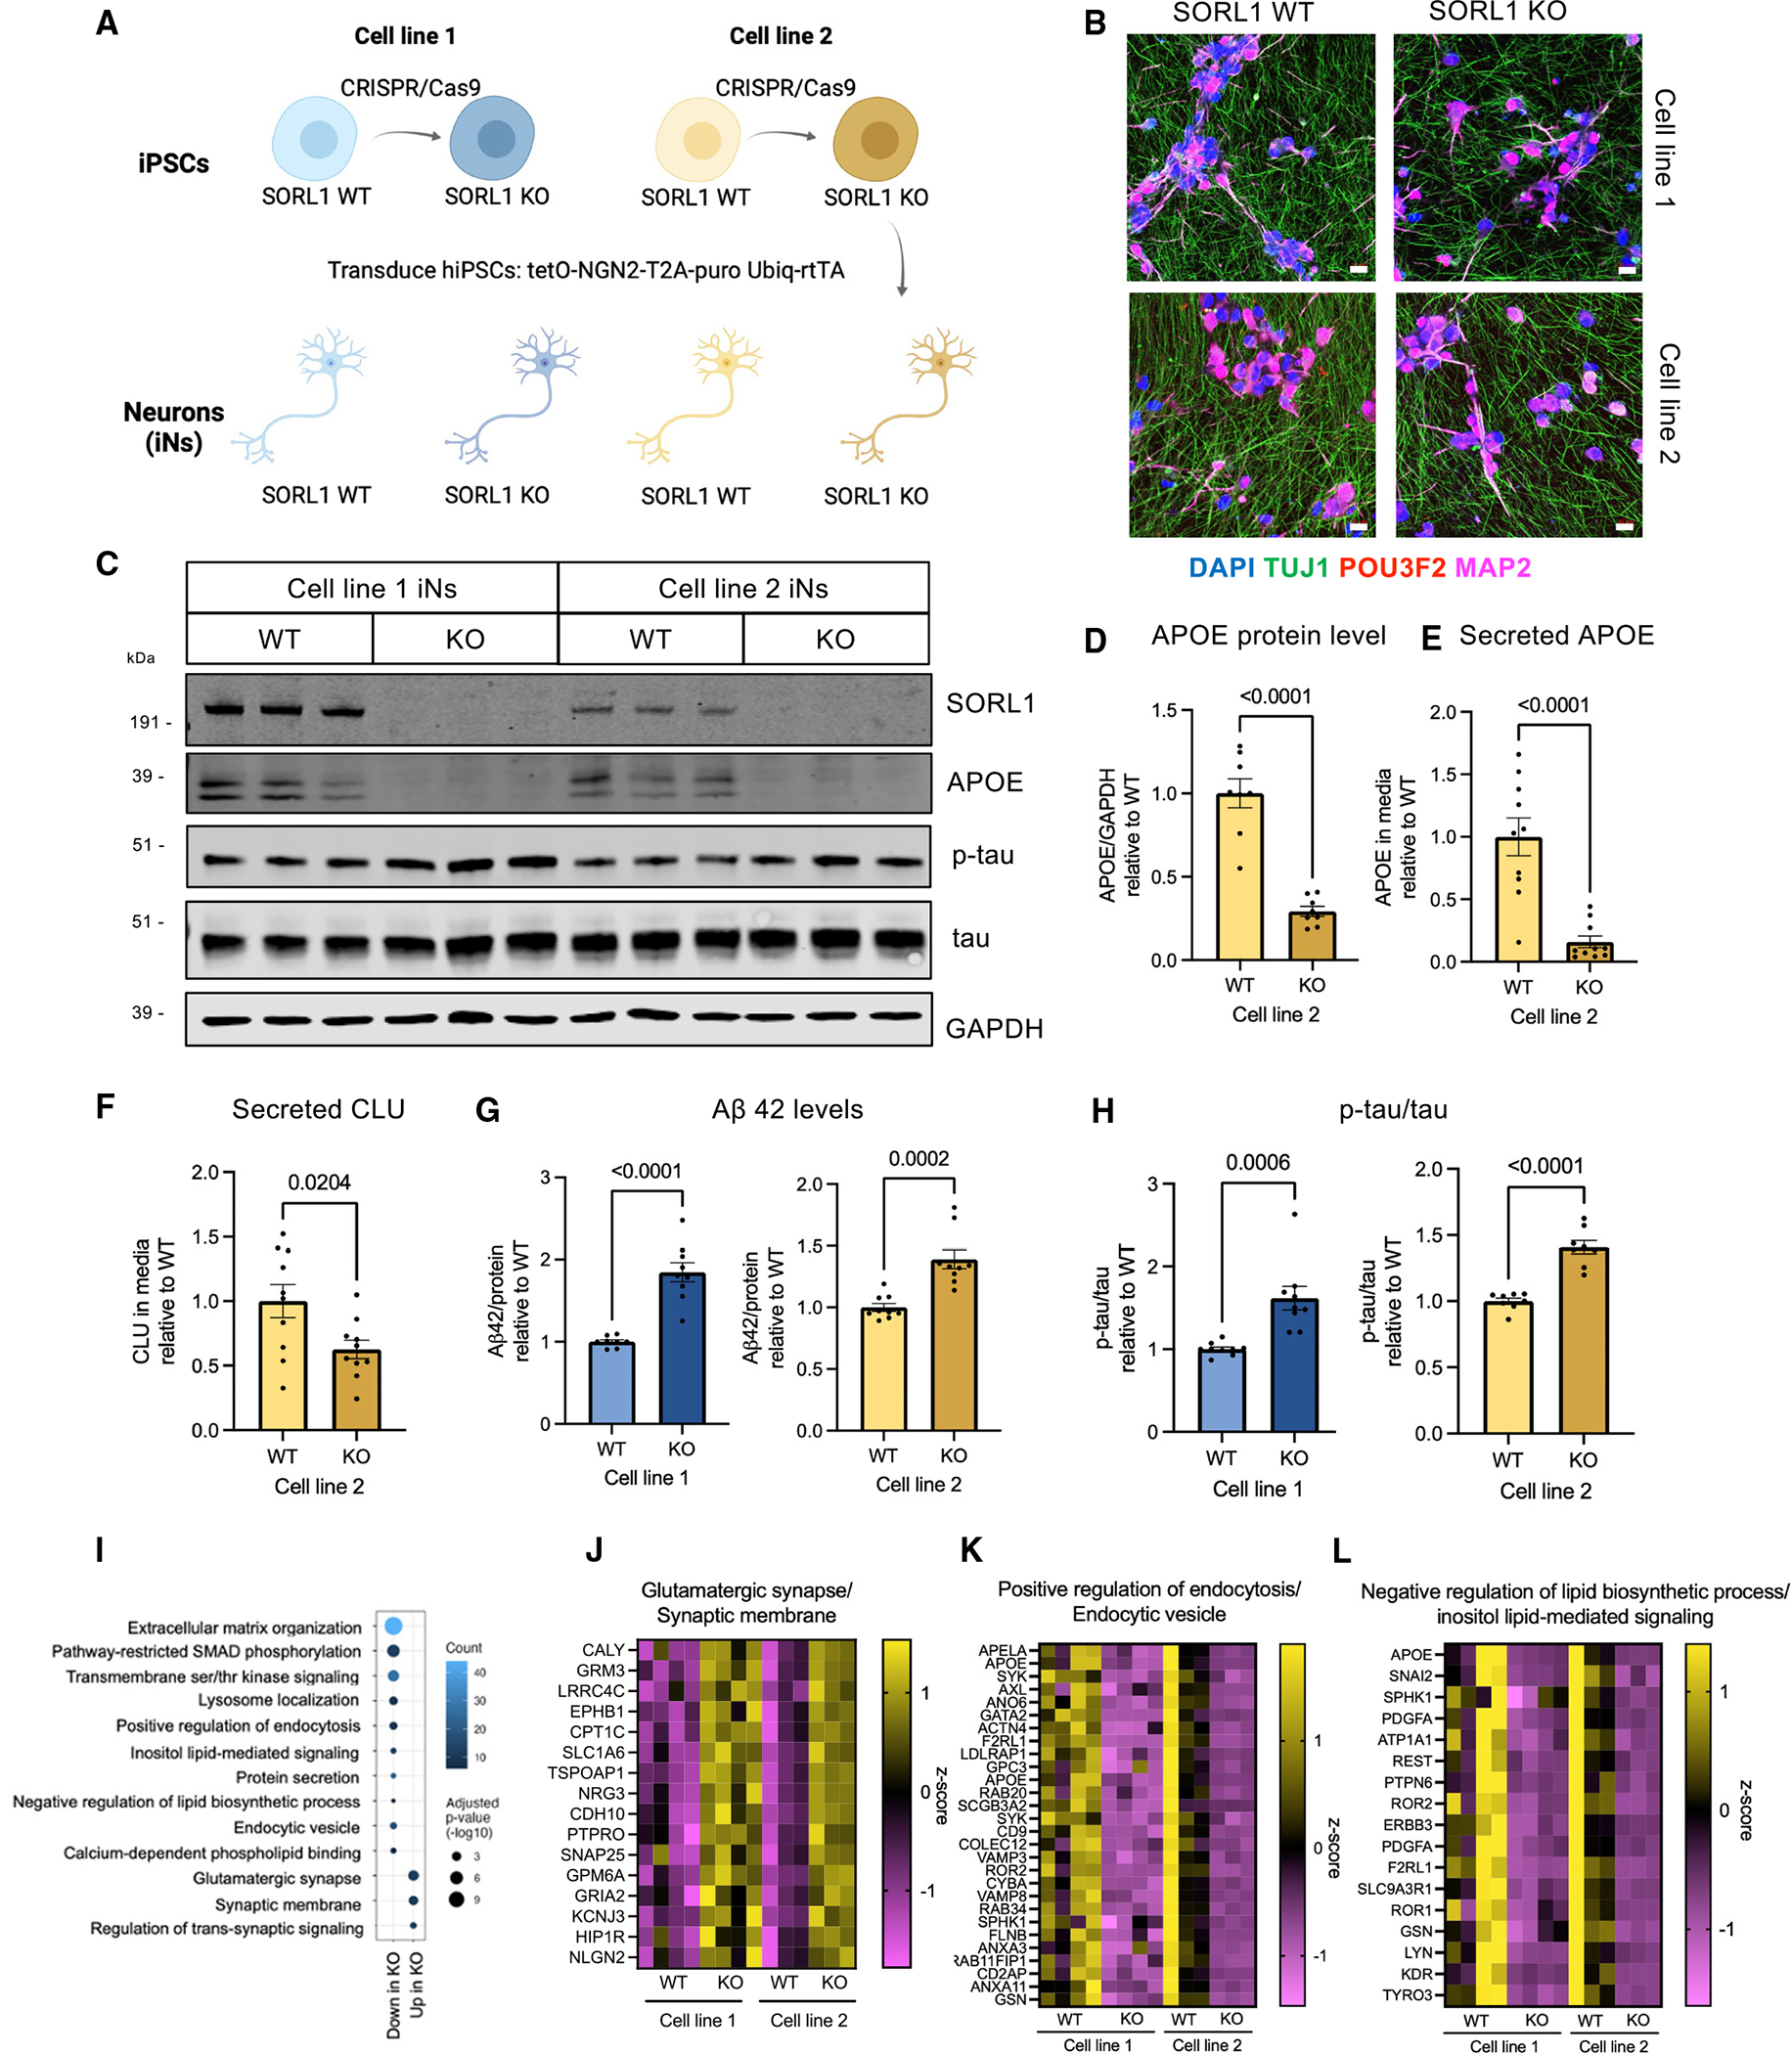
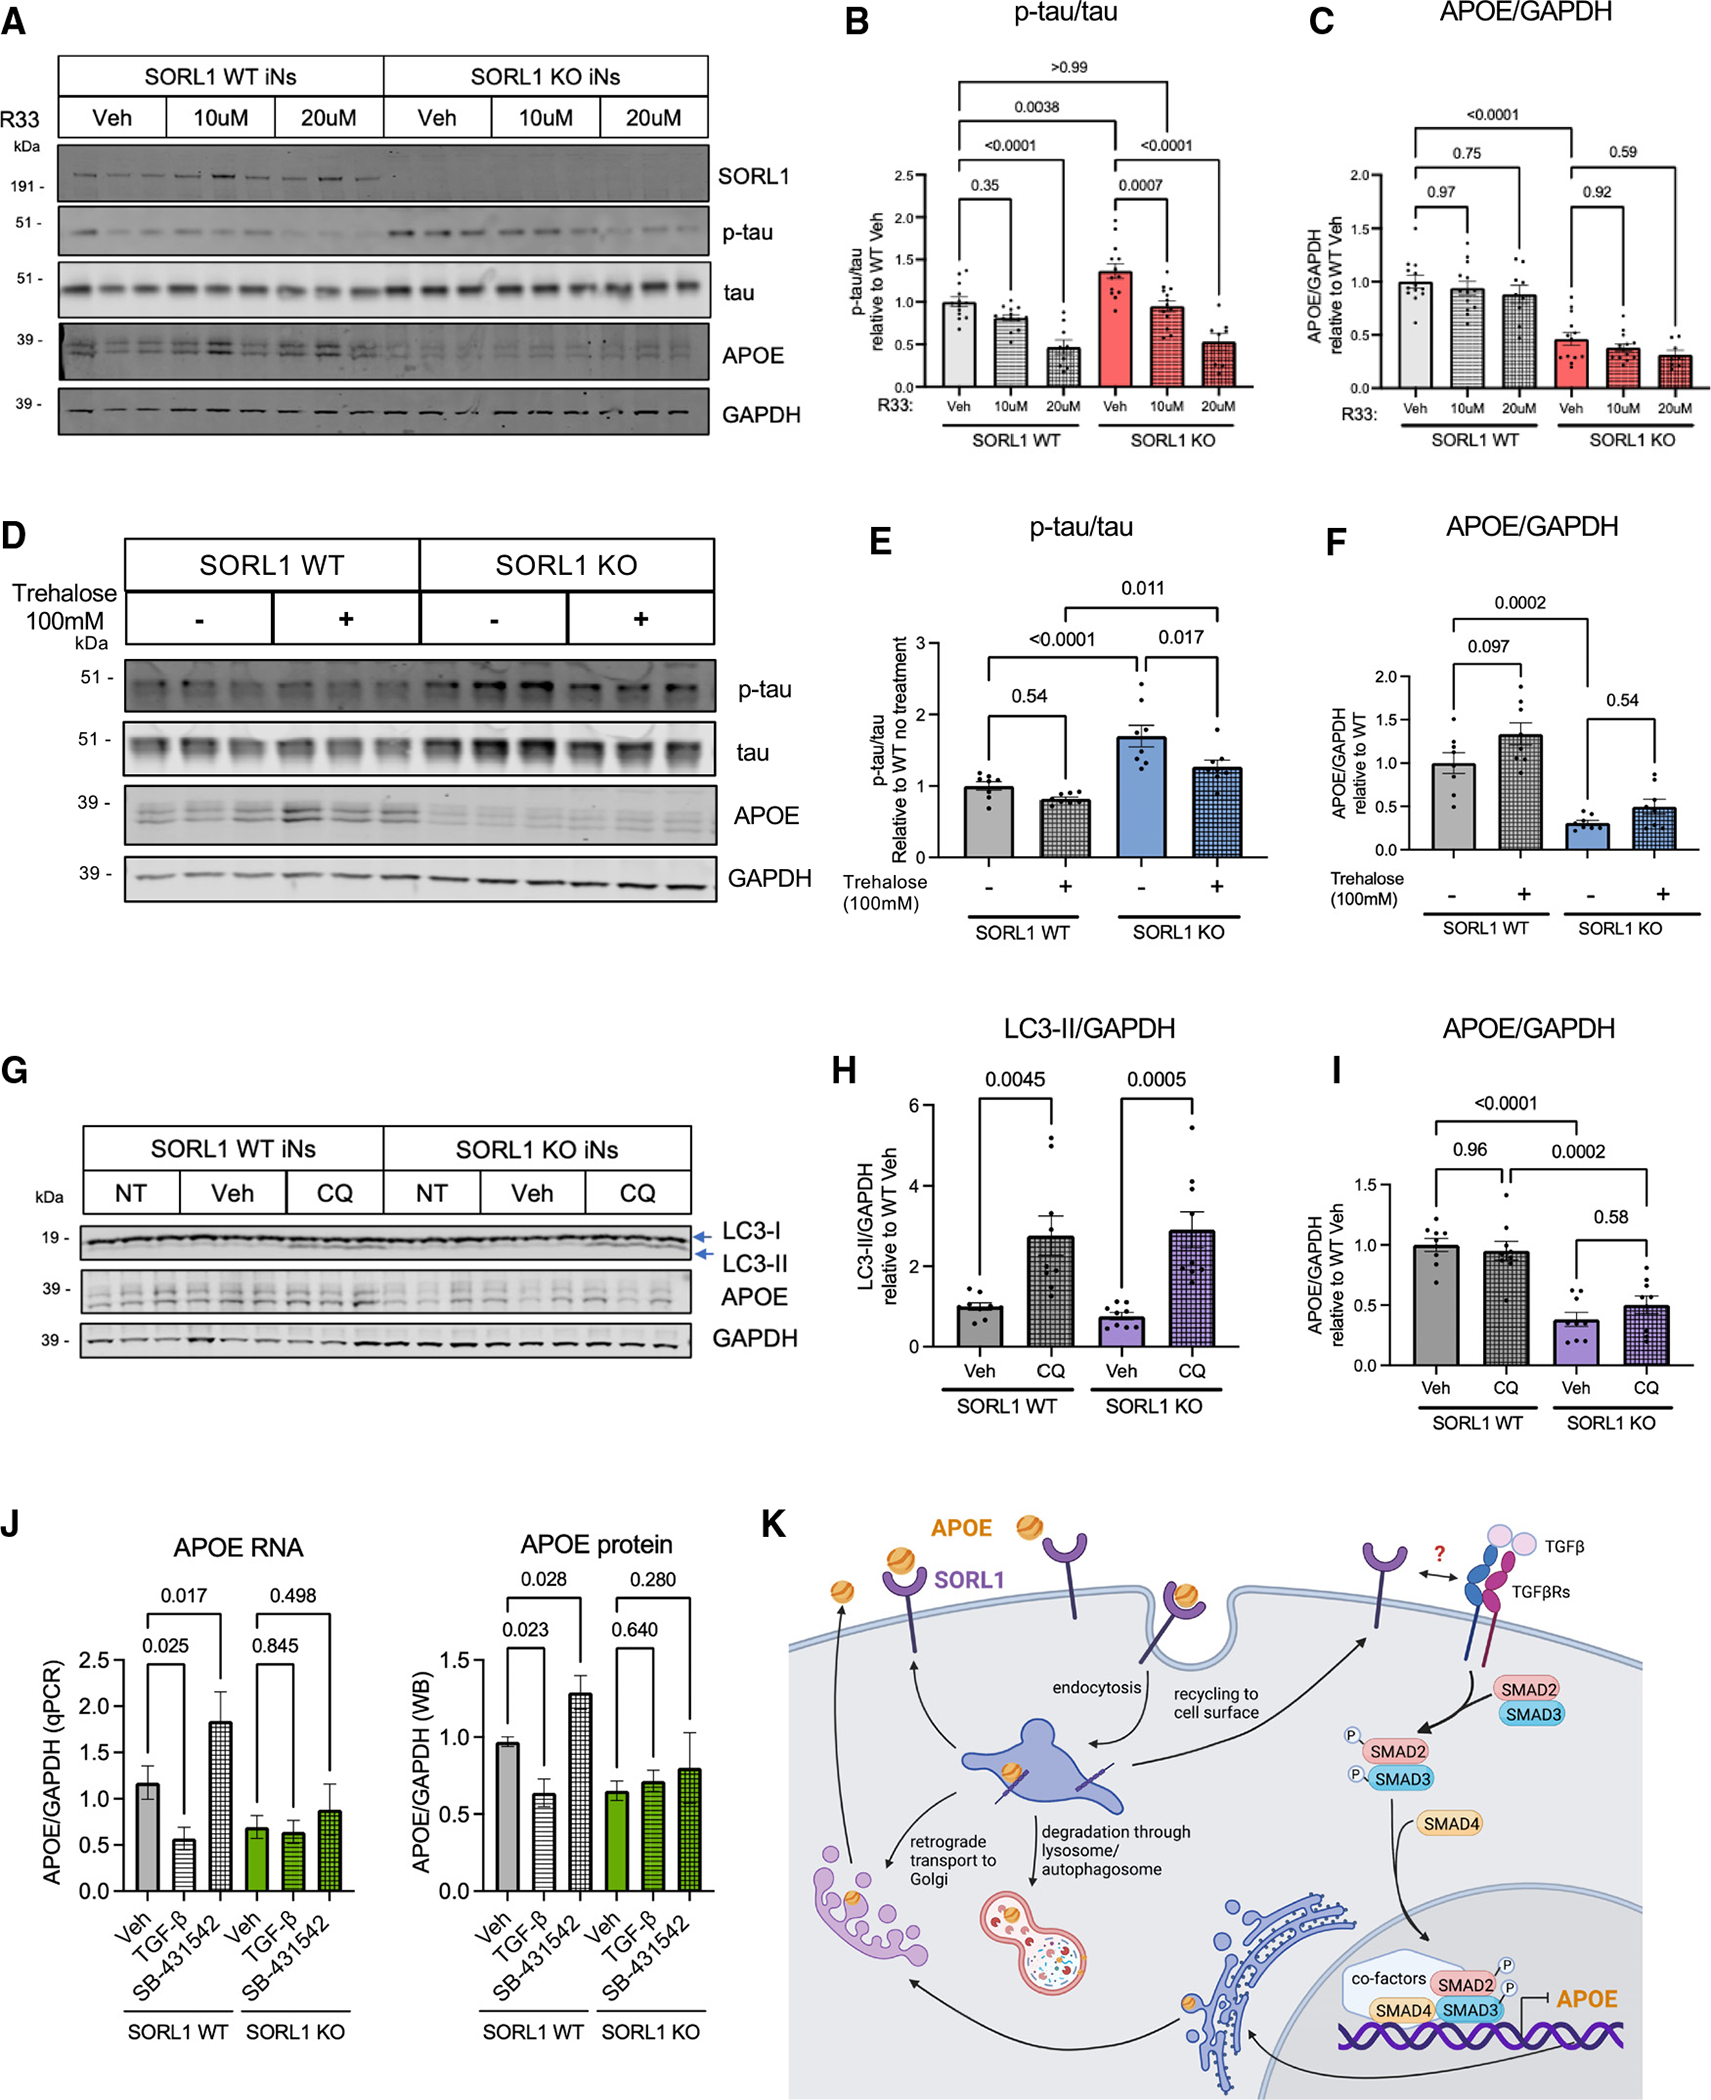
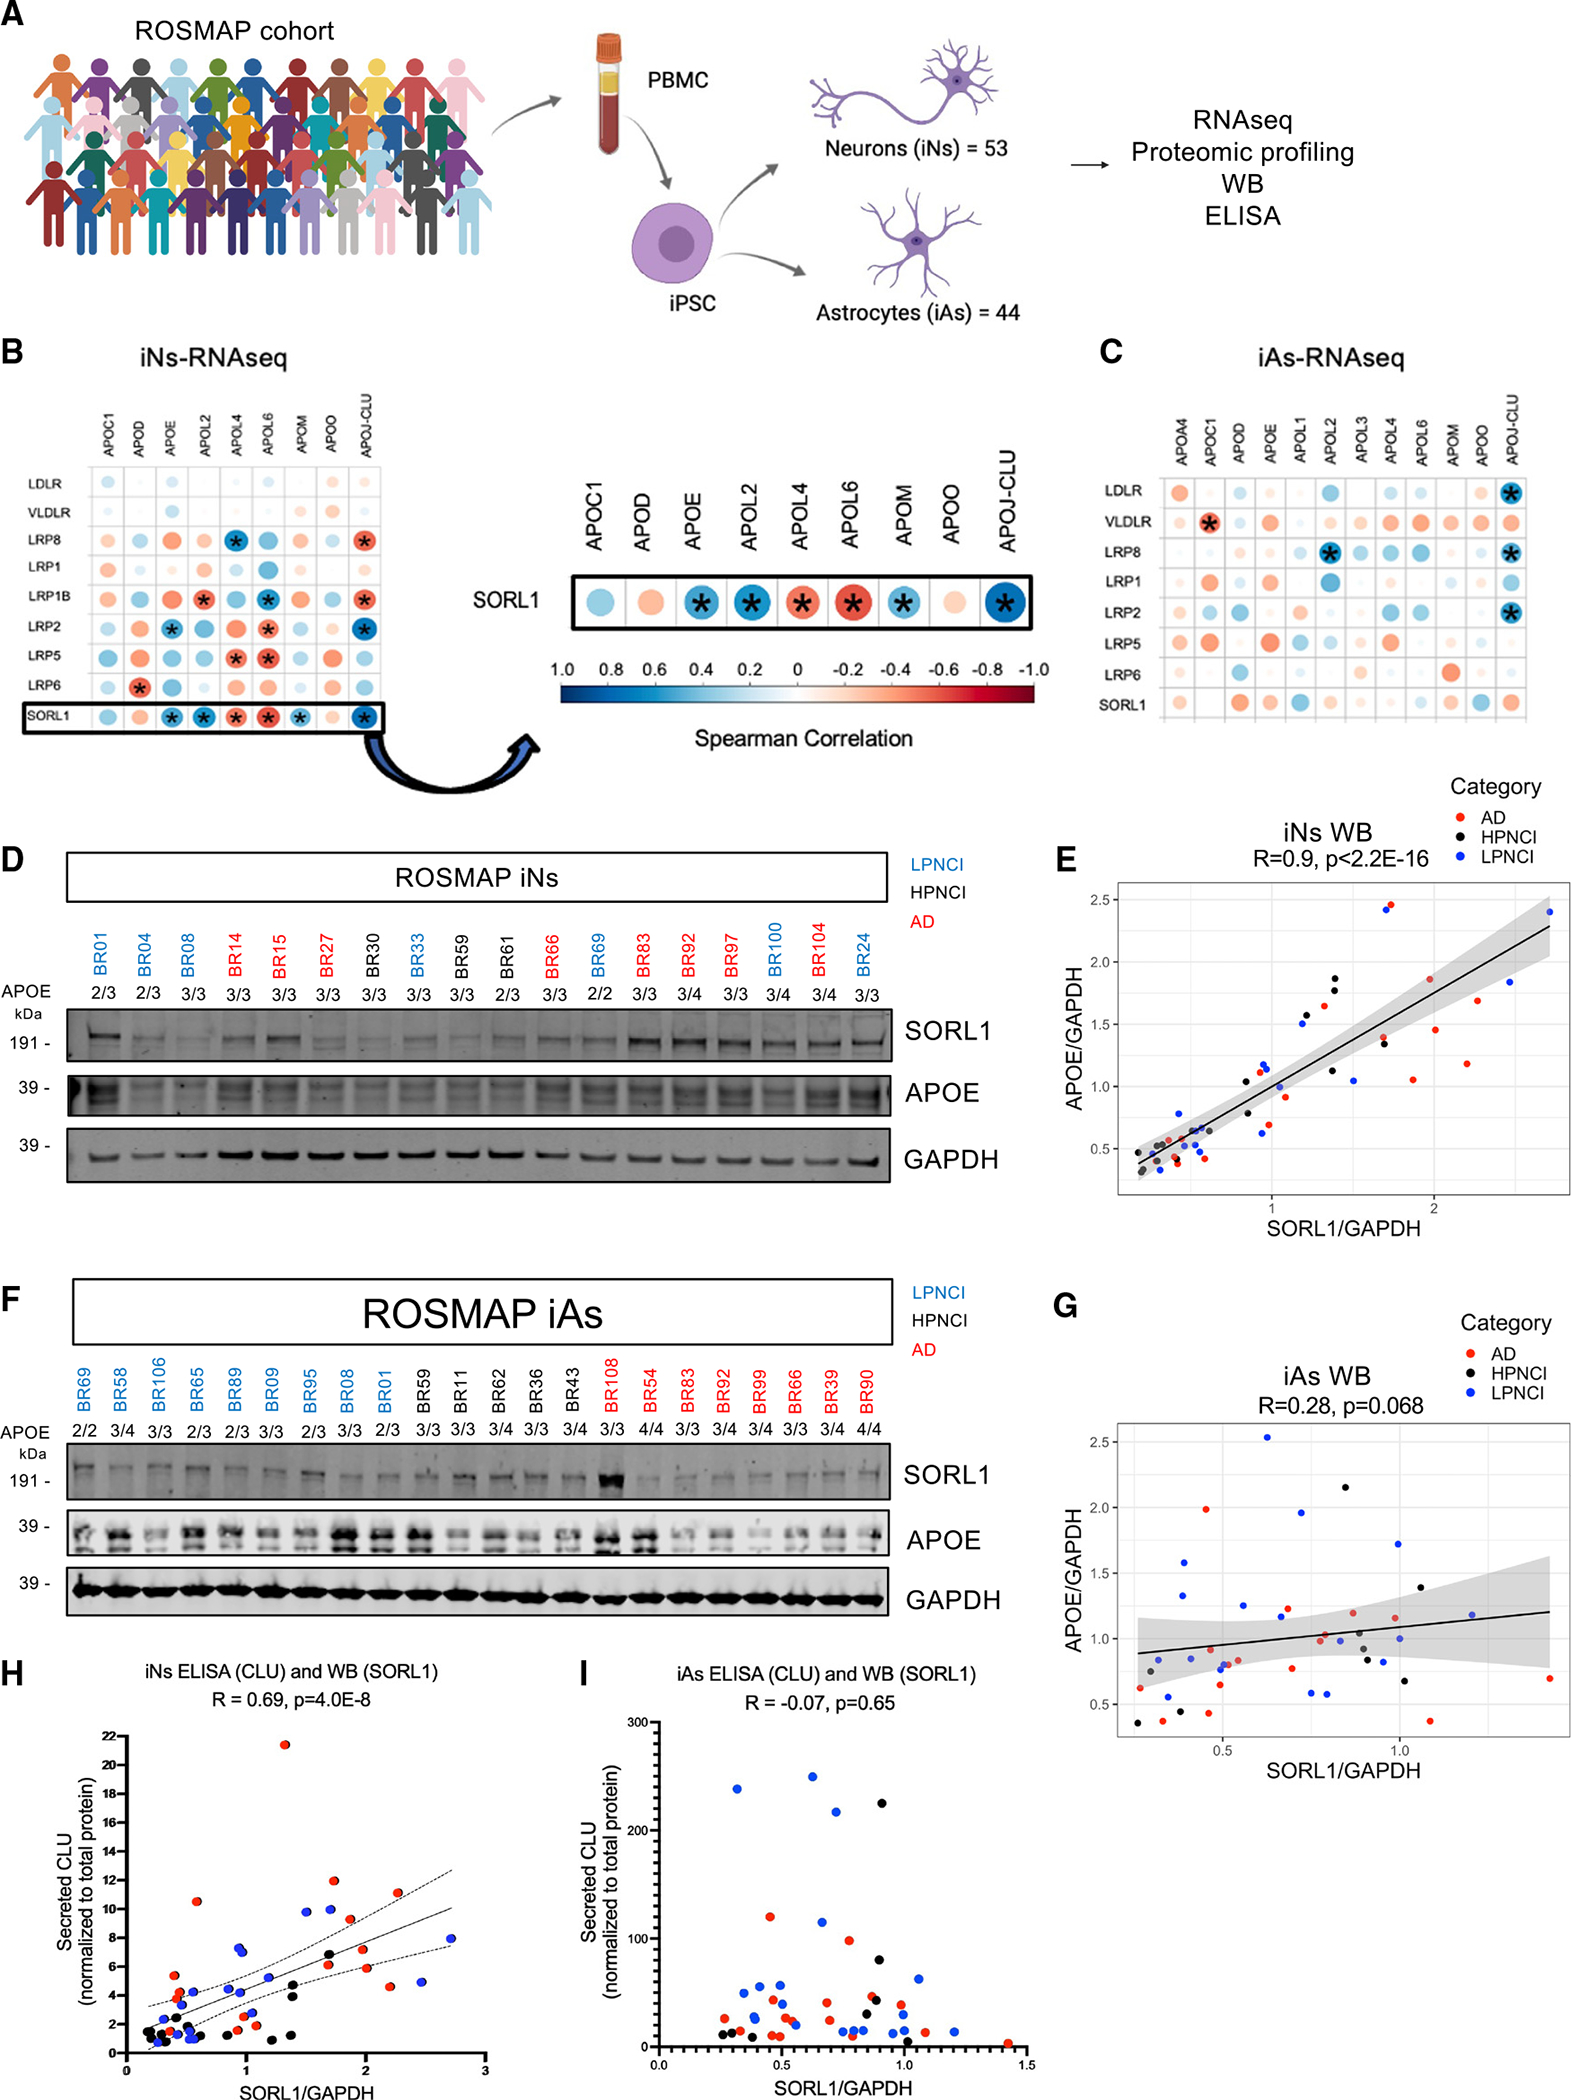
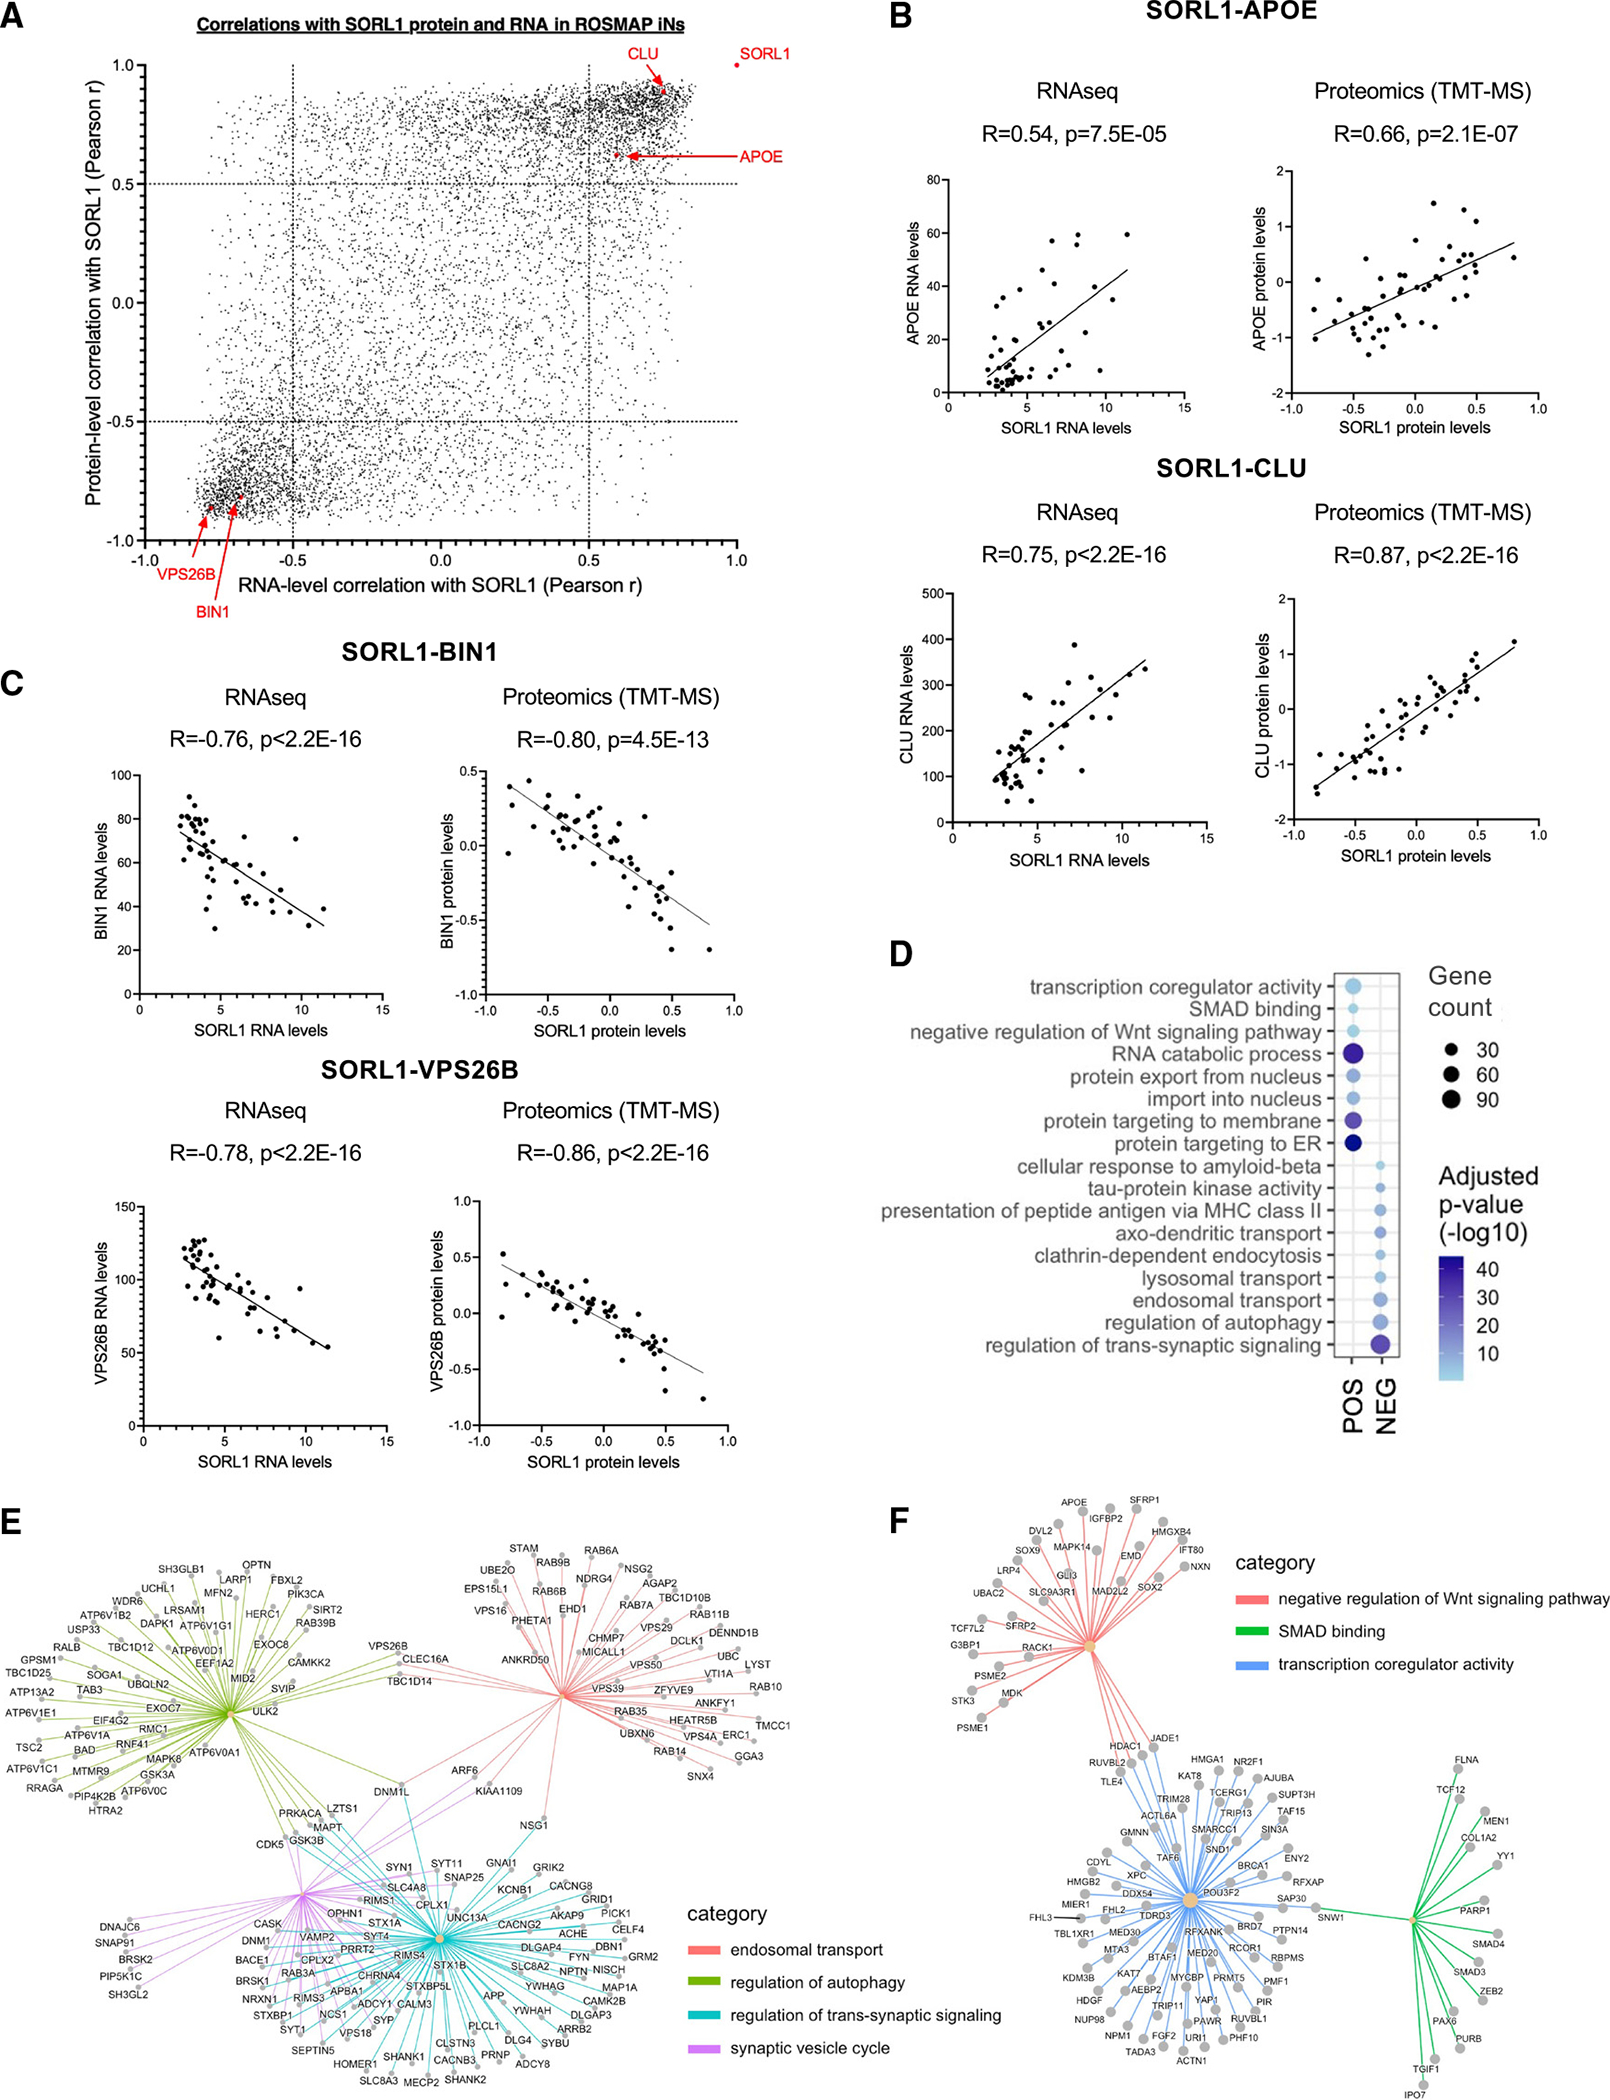
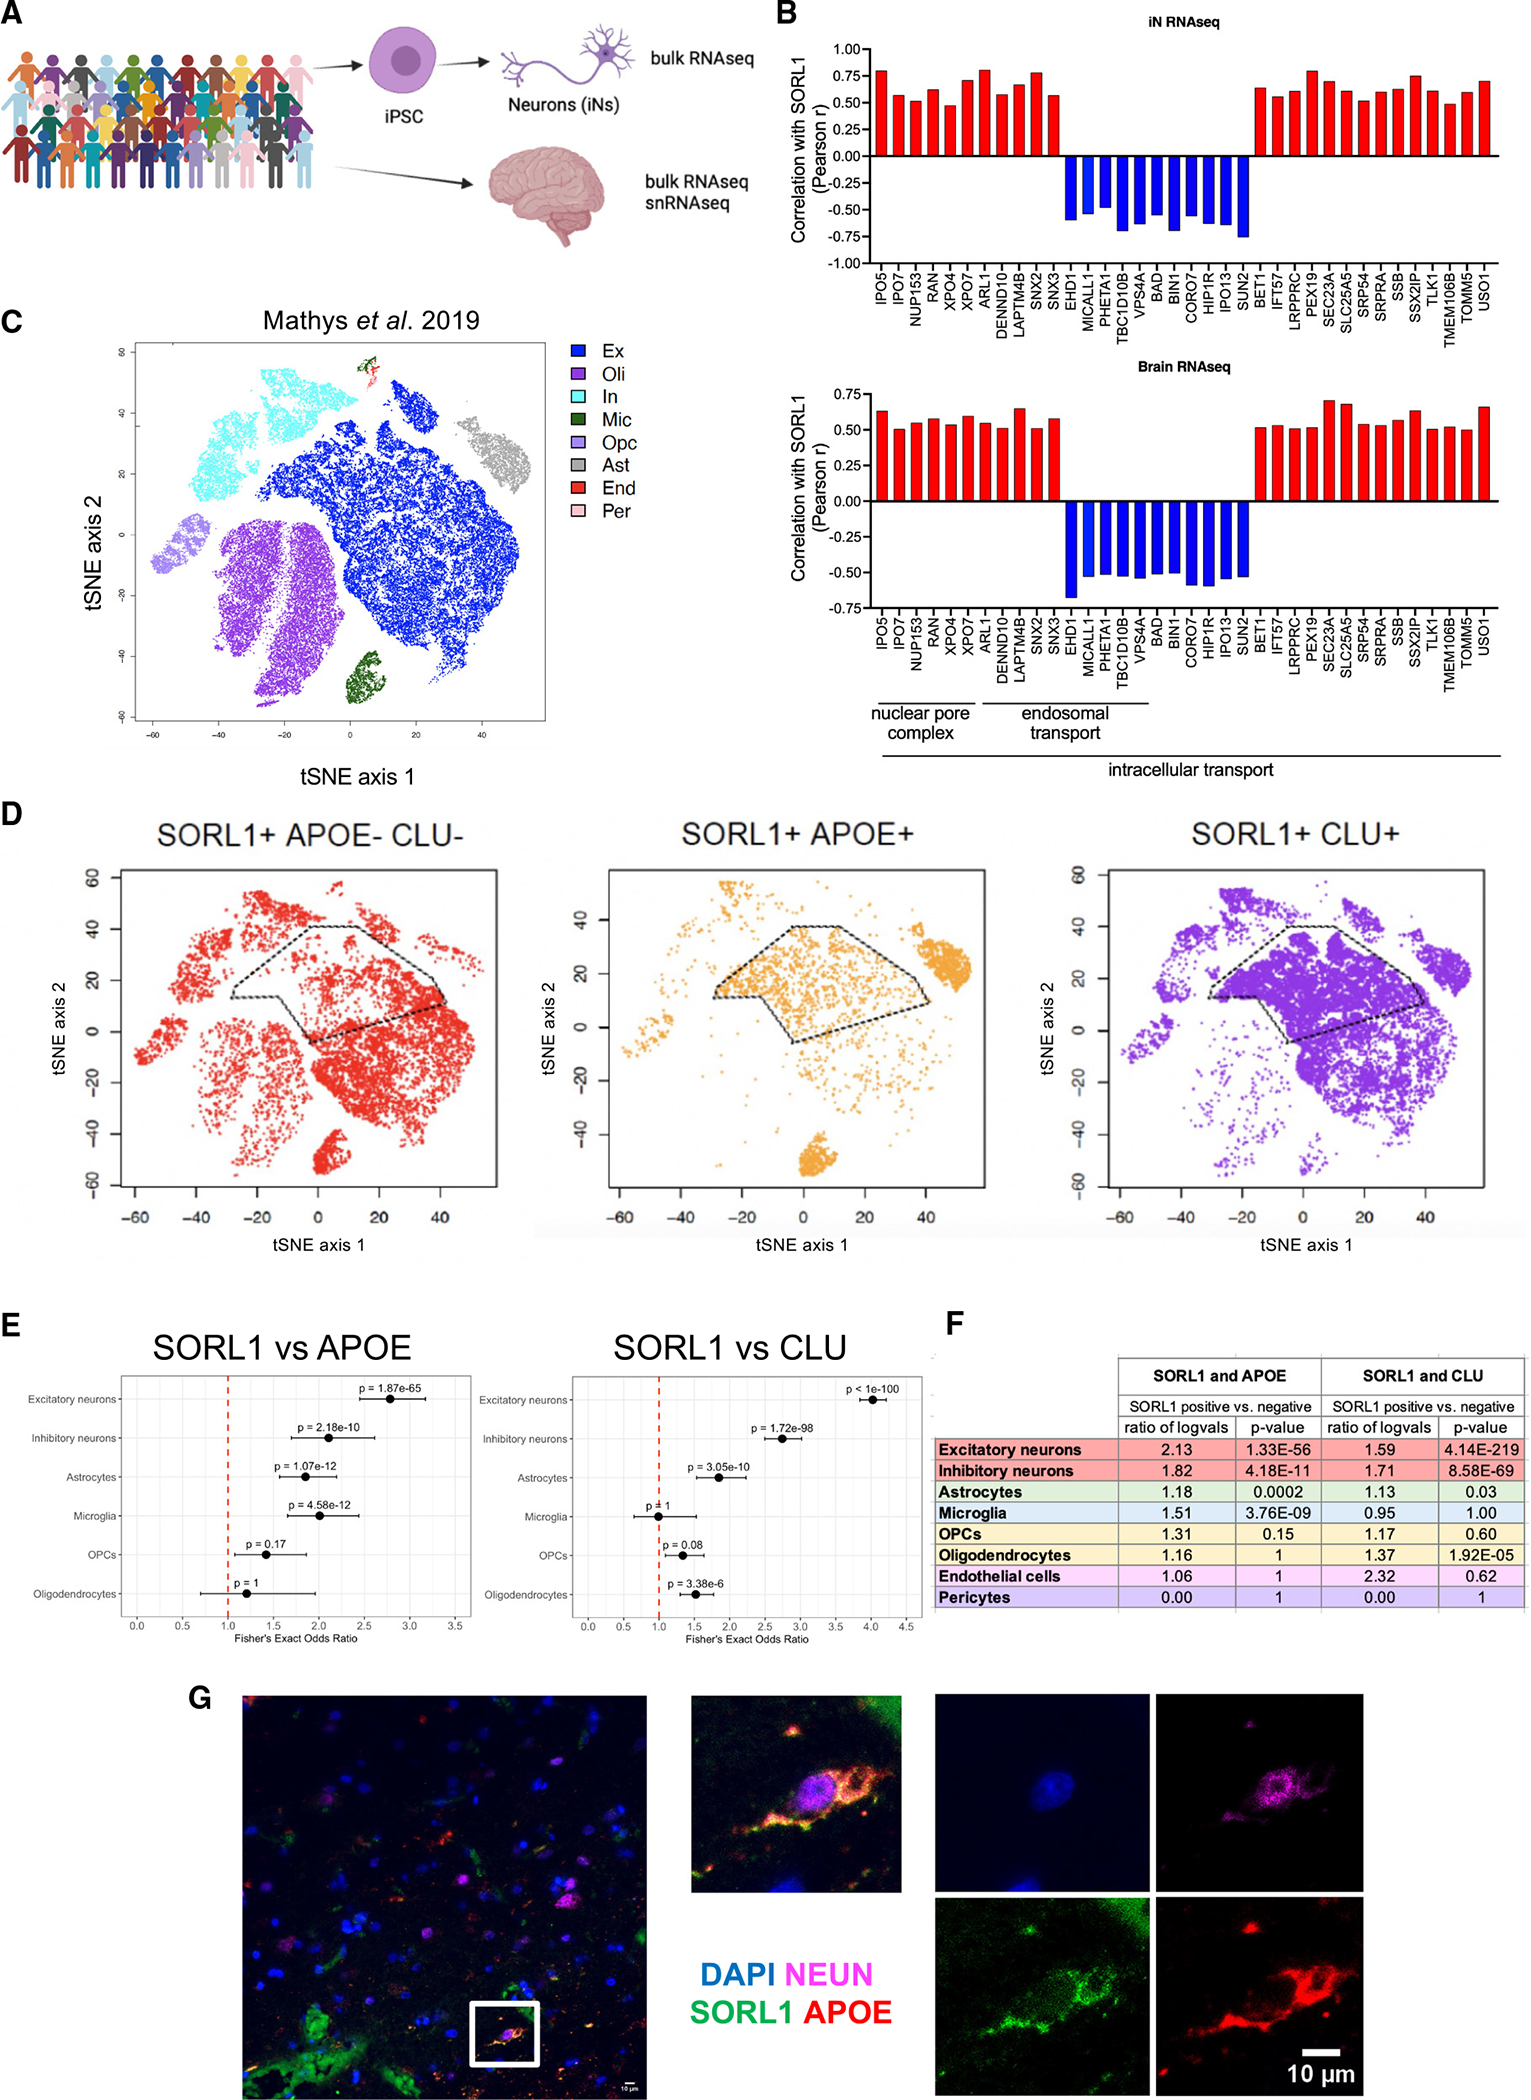
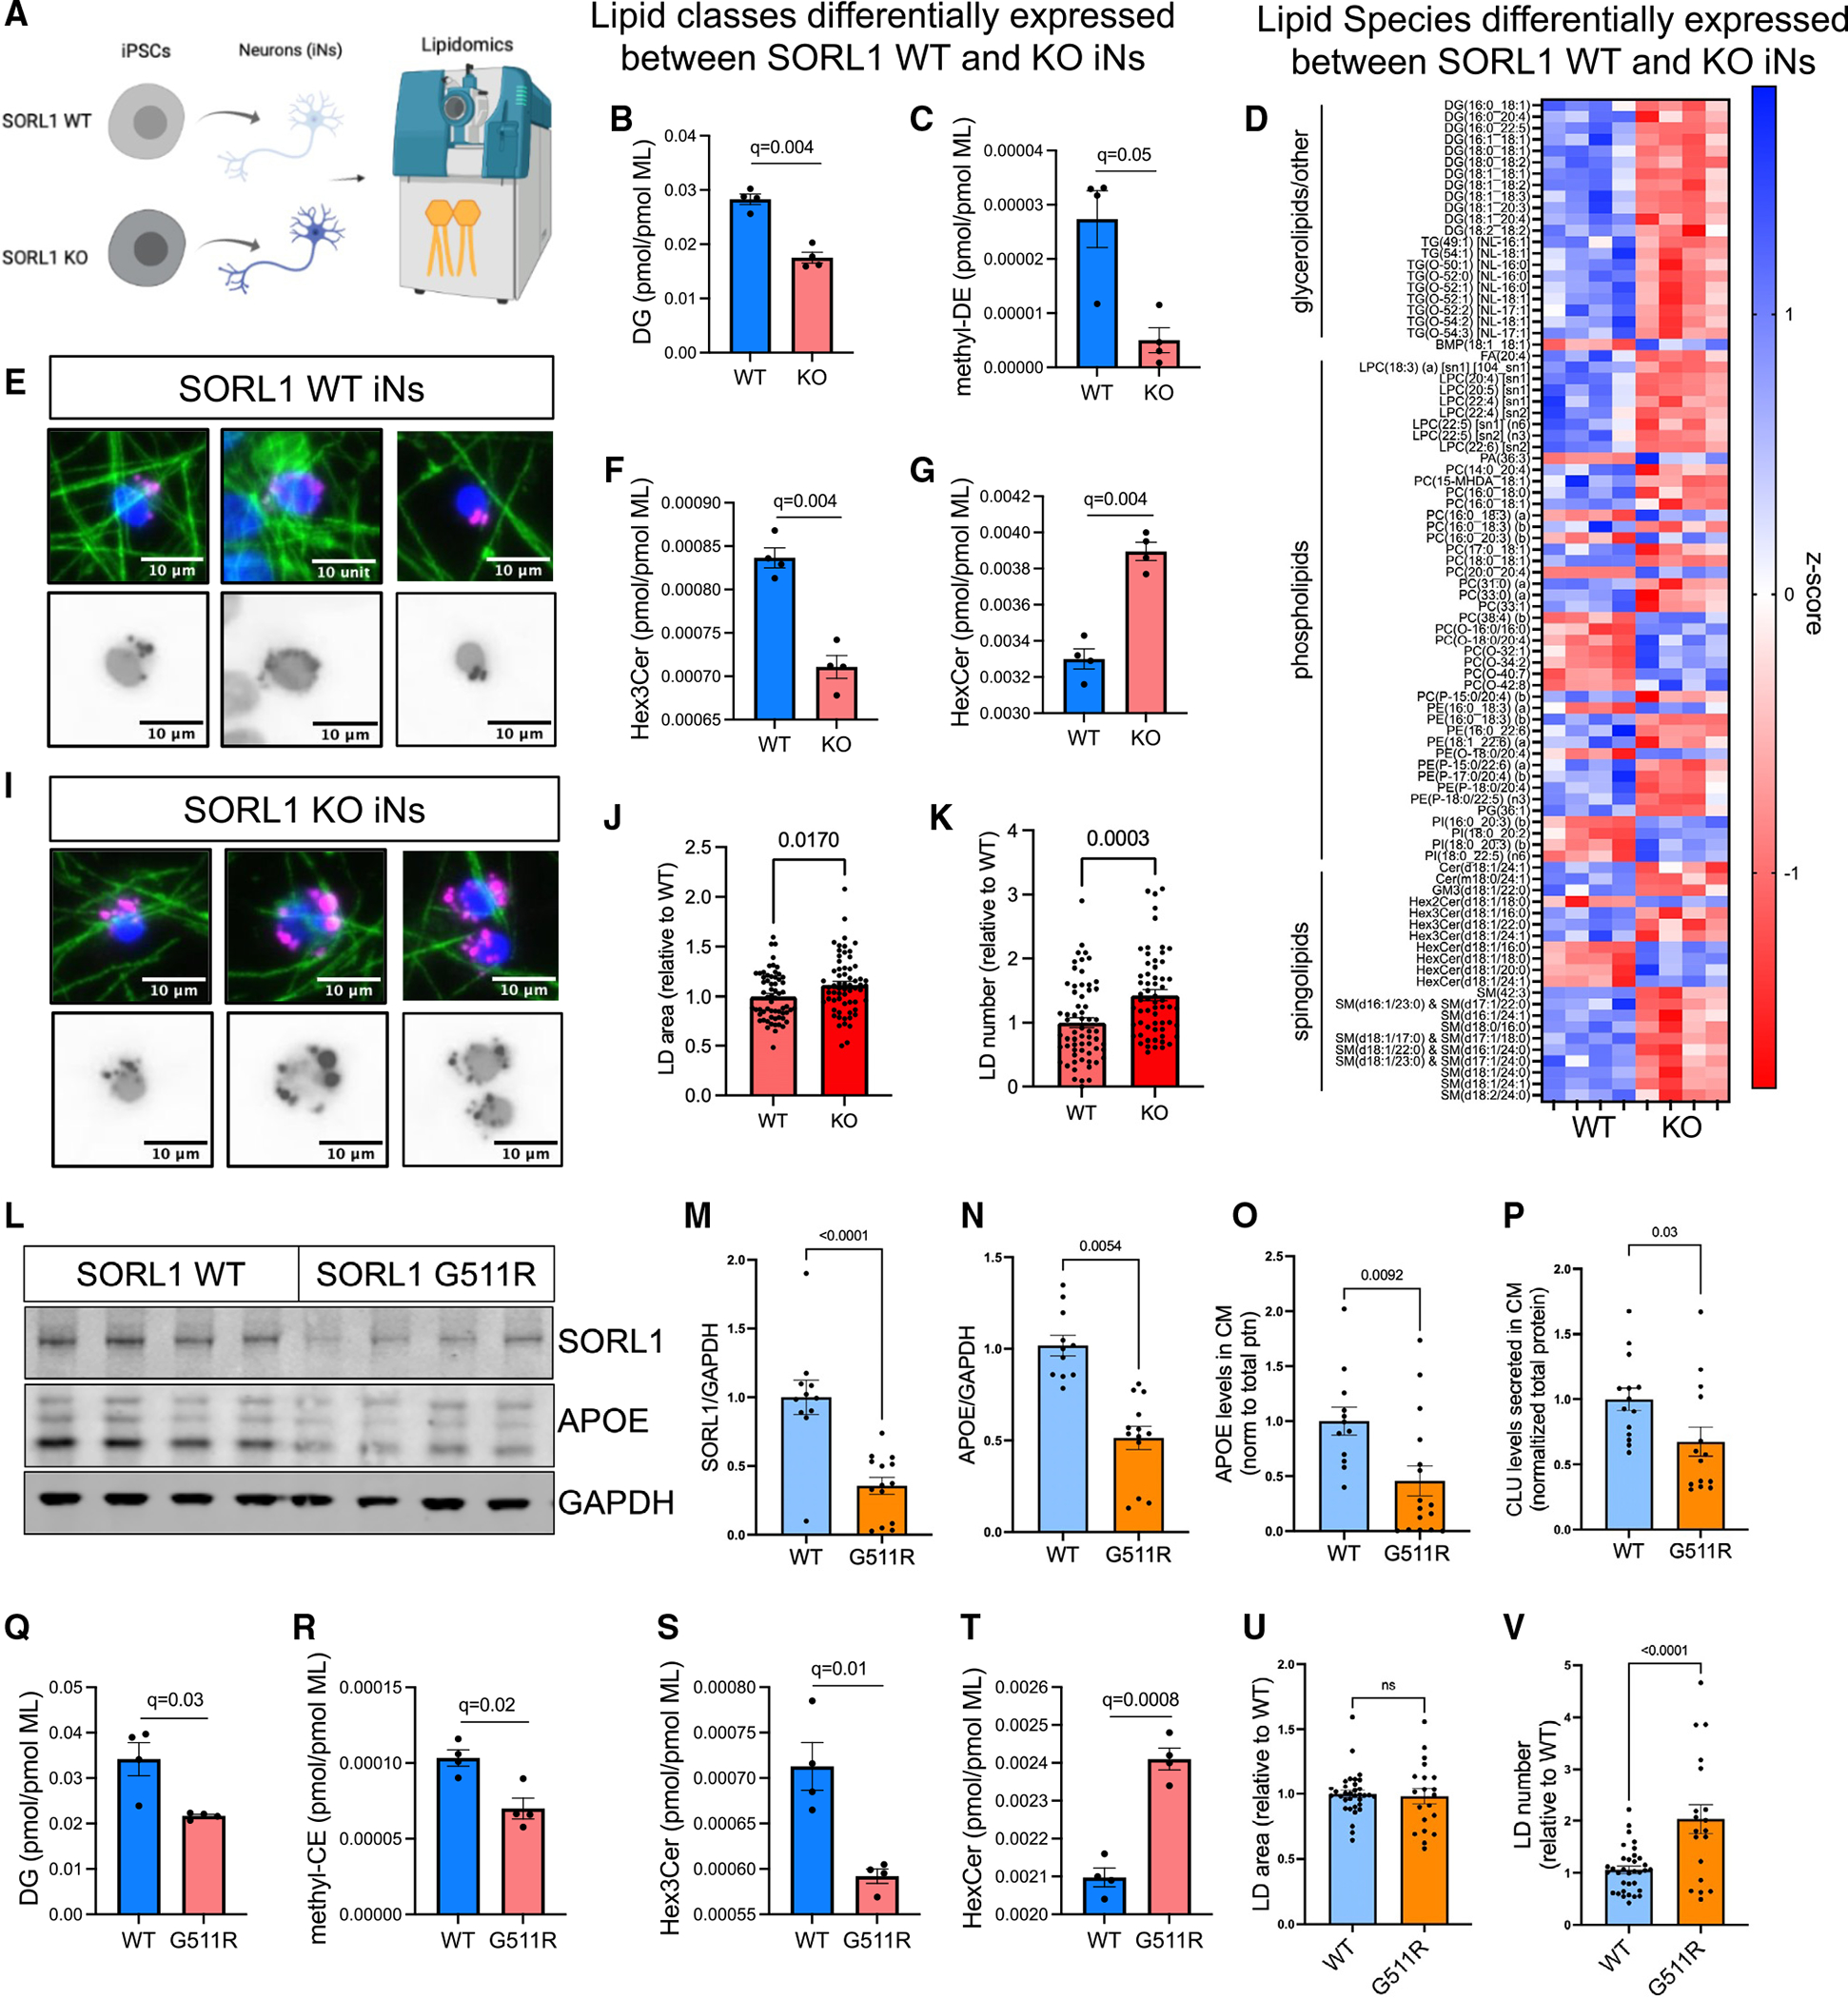
SORL1 is implicated in the pathogenesis of Alzheimer's disease (AD) through genetic studies. To interrogate the roles of SORL1 in human brain cells, SORL1-null induced pluripotent stem cells (iPSCs) were differentiated to neuron, astrocyte, microglial, and endothelial cell fates. Loss of SORL1 leads to alterations in both overlapping and distinct pathways across cell types, with the greatest effects in neurons and astrocytes. SORL1 loss induces a neuron-specific reduction in apolipoprotein E (APOE) and clusterin (CLU) and altered lipid profiles. Analyses of iPSCs derived from a large cohort reveal a neuron-specific association between SORL1, APOE, and CLU levels, a finding validated in postmortem brain. Enhancement of retromer-mediated trafficking rescues tau phenotypes observed in SORL1-null neurons but does not rescue APOE levels. Pathway analyses implicate transforming growth factor β (TGF-β)/SMAD signaling in SORL1 function, and modulating SMAD signaling in neurons alters APOE RNA levels in a SORL1-dependent manner. Taken together, these data provide a mechanistic link between strong genetic risk factors for AD.

Keywords: APOE; Alzheimer's; CLU; CP: Neuroscience; SMAD; SORL1; TGFbeta; amyloid; endolysosomal; retromer; tau.


Conflict of interest statement

Declaration of interests The authors declare no competing interests.

Figures

Figure 1.
Figure 1.. APOE and CLU RNA and protein levels are reduced in SORL1 KO neurons
(A) Schematic of the experimental design. SORL1 KO iPSCs were generated using CRISPR-Cas9 as previously published, and paired KO and WT iPSCs were differentiated into neurons (iNs), astrocytes (iAs), microglia (iMGLs), and endothelial/epithelial cell (iEC) fates. (B) Representative immunocytochemistry images of iN, iA, iMGL, and iEC cultures. Scale bars, 50 μm. (C) Heatmap of RNA expression (Z score) of cell-type-specific markers. (D and E) Cultures were analyzed via RNA-seq and differential expression analyses performed within each cell type. DEGs were identified using Sleuth by performing a Wald test (false discovery rate [FDR] q < 0.05 and b < −0.5 or b > 0.5). The numbers of DEGs between SORL1 WT and KO in each cell type are shown as a table (D) and as a Venn diagram (E). Complete datasets can be found in Tables S1. (F) Dot plot showing significantly overrepresented Gene Ontology (GO) pathways in iNs, iAs, iMGLs, and iECs comparing SORL1 KO and WT within each cell type. Dots are sized based on the number of DEGs in the indicated pathway and colored based on adjusted p value. (G) Venn diagram of LOAD GWAS genes that are differentially expressed in SORL1 KO neurons, astrocytes, and microglia. Genes with adjusted p <0.05 are included in the diagram. (H) Representative western blot of iNs, iAs, iMGLs, and iECs showing protein expression levels of SORL1, APOE, and GAPDH. (I–L) Quantification of APOE/GAPDH in iNs, iAs, iMGLs, and iECs. (M–P) Secreted APOE and CLU values were measured using MSD ELISA, and the values were normalized to WT within each comparison. For each panel, three independent differentiations were performed. In each round of differentiation, three or four wells were included for each group. Comparisons only performed within cell type; paired Student’s t test (two tailed), p values listed.
Figure 2.
Figure 2.. SORL1 KO neurons express elevated Aβ and increased phosphorylation of tau
(A) Overview of the experimental design to generate SORL1 KO neurons. SORL1 KO iPSCs were generated using CRISPR-Cas9 and were differentiated into neurons using induced expression of NGN2. (B) Representative immunocytochemistry images of D21 iNs showing the expression of neuronal markers. Scale bars, 20 μm. (C) Representative western blot of iN D21 protein lysates from line 1 and line 2. (D–F) Quantifications within cell line pair 2 of APOE/GAPDH in lysates (D), APOE in the media (E), and CLU in the media (F) normalized to total protein are shown. (G) Aβ42 levels in the media normalized to protein concentration for cell line pairs 1 and 2. (H) Quantification of p-tau (p202/205)/total tau ratio in iN D21 protein lysates from western blot data. SORL1 KO iNs from pairs 1 and 2 both show increased phosphorylation of tau. Data in (D)–(H) show mean ± SEM from three independent differentiations. Within each round of differentiation, three wells were included for each group. Values are normalized to WT within paired lines. Unpaired Student’s t test (two tailed), p values are shown. (I) Dot plot of molecular pathway over-representation in up- or downregulated DEGs in both lines 1 and 2. All pathway enrichments have an adjusted p value <0.05). (J–L) Heatmap of a subset of genes that are differentially expressed in SORL1 WT vs. KO iNs and their relative expression levels (Z score) from selected GO terms in (I). Full datasets can be found in Table S2.
Figure 3.
Figure 3.. Enhancement of retromer function or autophagy rescues Aβ and tau phenotypes, while modulation of SMAD signaling regulates APOE levels in a SORL1-dependent manner
(A–C) Line #1 iNs were treated with R33, a retromer stabilizer, at either 10 or 20 μM for 72 h and harvested at D21 of differentiation. A representative western blot of lysates from these SORL1 WT and KO iNs is shown in (A). Quantification shown of the protein expression of p-tau/tau (p202/205) (B) and APOE/GAPDH (C). (D–F) iNs were treated with trehalose, a putative enhancer of autophagy, at 100 mM for 72 h and harvested at D21 of differentiation. A representative western blot of these lysate is shown in (D). Quantifications shown for p-tau/tau (p202/205) (E) and APOE/GAPDH (F). (G–I) iNs were treated with 5 μM chloroquine (CQ) (to inhibit autophagic vesicle fusion with the lysosome) for 72 h and harvested at D21 of differentiation. A representative western blot of lysates is shown (G). Quantifications shown for LC3b-II/GAPDH (H) and APOE/GAPDH (I). (J) SORL1 WT and KO iNs were treated with vehicle, TGF-β, or SB-431542 for 72 h. Lysates were collected, RNA purified, and qPCR performed for APOE and GAPDH (J, left) or else cells were lysed and western blotting was performed for APOE and GAPDH (J, right). For all quantifications in (B)–(J), data show mean ± SEM from three independent differentiations. For each round of differentiation, three replicates were included for each group. Values are normalized to WT iNs treated with vehicle. One-way ANOVA with Tukey’s multiple comparisons test. (K) Schematic showing the intracellular life cycle of APOE, including a speculative model for the regulation of APOE by TGF-β signaling in neurons, with activation of TGF-β signaling resulting in repression of APOE transcription.
Figure 4.
Figure 4.. SORL1 levels show a strong positive correlation with APOE and CLU levels in iPSC-derived neurons from the ROSMAP cohort
(A) Peripheral blood mononuclear cells (PBMCs) were collected from ROSMAP cohort participants, which were converted to iPSCs (previously published in Lagomarsino et al.) and differentiated into neurons (iNs) and astrocytes (iAs). RNA-seq and proteomic profiling were then performed. (B and C) RNA expression levels of SORL1 and other members of the LDL receptor family were each compared to APOE and members of the apolipoprotein family in both iNs (B) and iAs (C). Correlation dot plots are used to represent Spearman correlations for each comparison, with the size of the dot increasing with lower p values (asterisks indicate p < 0.001) and color indicating R value. (D) A representative western blot image of SORL1, APOE, and GAPDH levels of ROSMAP iN protein lysates. Individuals have a unique ID that is colored based on their AD diagnosis status. LPNCI, low AD neuropathology not cognitively impaired; HPNCI, high AD neuropathology not cognitively impaired; AD, clinical and pathological diagnosis of Alzheimer’s disease and dementia. (E) Spearman correlation between SORL1/GAPDH and APOE/GAPDH levels in iN lysates. (F) Representative western blot image of SORL1, APOE, and GAPDH expression in ROSMAP iA protein lysates. (G) Spearman correlation between SORL1/GAPDH and APOE/GAPDH levels in iA lysates. All western blots can be found in Figure S7. (H and I) Conditioned media from the same cells were analyzed via ELISA to measure CLU levels. Shown are correlations between SORL1/GAPDH and CLU in iNs (H, R = 0.69, p = 4.0E−08) and iAs (I, R = −0.07, p = 0.65).
Figure 5.
Figure 5.. Unbiased RNA-seq and proteomics of ROSMAP iNs identify genes and pathways associated with genetically encoded natural variation in SORL1 levels
(A) ROSMAP iPSC lines were differentiated to neuron fates, and RNA-seq and TMT-MS proteomic profiling was performed. Pearson correlation coefficients between SORL1 and all other genes detected within both the RNA-seq and proteomics datasets are plotted. Each dot represents data for a single gene. High-density areas of the plot highlight genes that are either positively or negatively correlated with SORL1 in both the RNA-seq and the proteomics data. (B) Correlation between SORL1 and APOE and CLU in ROSMAP iN RNA-seq and proteomics data. (C) Correlation between SORL1 and BIN1 and VPS26B in ROSMAP iN RNA-seq and proteomics data. For (B) and (C), Each dot represents data from iNs derived from one individual. (D) Pathway enrichment dot plot representing biological gene cohorts that are significantly overrepresented in either the upper right (POS) or lower left (NEG) sections of the SORL1 correlation plot in (A). Dot size represents the number of genes passing a correlation cutoff of p < −0.05 or p > 0.5 within the gene set, while color indicates q value. All pathways shown had q < 0.02. (E and F) Gene concept network plots representing genes that belong to the pathways identified in (D) whose levels are associated with SORL1 expression.
Figure 6.
Figure 6.. snRNA-seq of postmortem brain tissue validates an association between SORL1 and both APOE and CLU in excitatory neurons
(A) iN bulk RNA-seq and postmortem brain bulk RNA-seq as well as snRNA-seq dataset (medial frontal cortex) were generated from the ROSMAP cohort. (B) Correlation coefficient values (Pearson r) were calculated between SORL1 and other genes in bulk RNA-seq data from iNs and brain tissue. Shown are examples of concordant associations of SORL1 with genes in intracellular transport, endosomal transport, and nuclear pore complex gene sets within both iN and brain RNA-seq datasets. (C) TSNE plot of snRNA-seq data derived from the ROSMAP cohort, colored by cell type, as determined by marker expression (data from Mathys et al.). Data are from 70,634 cells from 48 individuals. (D) TSNE plots with cells colored by SORL1, APOE, and/or CLU detection, as labeled. A high degree of overlap is observed between SORL1 expression and APOE and CLU expression in a subset of excitatory neurons, as well as in microglia and astrocytes. (E) Fisher’s exact test results (adjusted p value and odds ratio) for the detection overlap of SORL1, APOE, and CLU within nuclei, separated by cell type. (F) Differential expression results of APOE and CLU between SORL1+ and SORL1− nuclei using a Wilcoxon rank-sum test, separated by cell type. See also Table S6. (G) Representative immunocytochemistry image of human brain section showing co-localization of DAPI, NEUN, SORL1, and APOE in a subset of cells. Scale bars, 10 μm.
Figure 7.
Figure 7.. Dysregulation of lipid metabolism with SORL1 mutation
(A) SORL1 WT and KO neurons were harvested for lipidomic analysis at D21, and 813 lipid species were quantified representing 47 different classes. Values for each species and class were normalized by total membrane lipid content within each sample to control for subtle differences in cell density and efficiency of lipid extraction. Then t tests were performed between WT and KO, with multiple comparisons testing using two-stage step-up (Benjamini-Hochberg), FDR 5%. Data showing four biological replicates. (B, C, F, and G) Eight lipid classes show dysregulation in SORL1 KO iNs including diacylglycerol (DG, B), methyl-dehydrocholesteryl ester (me-DE, C), trihexosylceramide (“ex3Cer, F), and monohexosylceramide (HexCer, G). Data show mean ± SEM. (D) Heatmap of Z scores of all lipid species that were dysregulated (q < 0.05). (E and I–K) Representative images of LDs, stained using LipidSpot (E and I). Quantification of LD area (J) and LD number (K) per cell normalized to WT iNs. Data show mean ± SEM from three independent differentiations, three wells per differentiation. (L–V) iNs derived from SORL1 G511R mutation iPSC lines and their isogenic WT paired iPSC line were analyzed. Representative WB (L) and quantification of SORL1 (M) and APOE (N) protein levels, normalized to GAPDH. Levels of APOE (O) and CLU (P) present in the media of the same cells were quantified via ELISA. Lipidomic analyses revealed 17 classes of lipids that were differentially present. Box and whisker plots (mean with error bars from minimum to maximum) of four of these classes are shown (Q–T). The complete datasets for all lipidomic analyses can be found in Table S7. Quantification of LD area (J) and LD number (K) per cell normalized to WT iNs. Data in (Q)–(T) show four biological replicates; data in (M)–(P), (U), and (V) show mean ± SEM from three independent differentiations, three or four replicates per group.

Update of

References

    1. Lambert JC, Ibrahim-Verbaas CA, Harold D, Naj AC, Sims R, Bellenguez C, DeStafano AL, Bis JC, Beecham GW, Grenier-Boley B, et al. (2013). Meta-Analysis of 74,046 Individuals Identifies 11 New Susceptibility Loci for Alzheimer’s Disease. Nat. Genet. 45, 1452–1458. 10.1038/ng.2802. - DOI - PMC - PubMed
    1. Bellenguez C, Küçükali F, Jansen IE, Kleineidam L, Moreno-Grau S, Amin N, Naj AC, Campos-Martin R, Grenier-Boley B, Andrade V, et al. (2022). New Insights into the Genetic Etiology of Alzheimer’s Disease and Related Dementias. Nat. Genet. 54, 412–436. - PMC - PubMed
    1. Pottier C, Hannequin D, Coutant S, Rovelet-Lecrux A, Wallon D, Rousseau S, Legallic S, Paquet C, Bombois S, Pariente J, et al.; PHRC GMAJ Collaborators (2012). High Frequency of Potentially Pathogenic SORL1 Mutations in Autosomal Dominant Early-Onset Alzheimer Disease. Mol. Psychiatr. 17, 875–879. 10.1038/mp.2012.15. - DOI - PubMed
    1. Vardarajan BN, Zhang Y, Lee JH, Cheng R, Bohm C, Ghani M, Reitz C, Reyes-Dumeyer D, Shen Y, Rogaeva E, et al. (2015). Coding Mutations in SORL 1 and Alzheimer Disease: SORL1 Variants and AD. Ann. Neurol. 77, 215–227. 10.1002/ana.24305. - DOI - PMC - PubMed
    1. Holstege H, van der Lee SJ, Hulsman M, Wong TH, van Rooij JG, Weiss M, Louwersheimer E, Wolters FJ, Amin N, Uitterlinden AG, et al. (2017). Characterization of Pathogenic SORL1 Genetic Variants for Association with Alzheimer’s Disease: A Clinical Interpretation Strategy. Eur. J. Hum. Genet. 25, 973–981. 10.1038/ejhg.2017.87. - DOI - PMC - PubMed

Publication types