. 2023 Aug;11(8):e006913.
doi: 10.1136/jitc-2023-006913.

hMENA isoforms regulate cancer intrinsic type I IFN signaling and extrinsic mechanisms of resistance to immune checkpoint blockade in NSCLC

Affiliations

hMENA isoforms regulate cancer intrinsic type I IFN signaling and extrinsic mechanisms of resistance to immune checkpoint blockade in NSCLC

Paola Trono et al. J Immunother Cancer. 2023 Aug.

Abstract

Background: Understanding how cancer signaling pathways promote an immunosuppressive program which sustains acquired or primary resistance to immune checkpoint blockade (ICB) is a crucial step in improving immunotherapy efficacy. Among the pathways that can affect ICB response is the interferon (IFN) pathway that may be both detrimental and beneficial. The immune sensor retinoic acid-inducible gene I (RIG-I) induces IFN activation and secretion and is activated by actin cytoskeleton disturbance. The actin cytoskeleton regulatory protein hMENA, along with its isoforms, is a key signaling hub in different solid tumors, and recently its role as a regulator of transcription of genes encoding immunomodulatory secretory proteins has been proposed. When hMENA is expressed in tumor cells with low levels of the epithelial specific hMENA11a isoform, identifies non-small cell lung cancer (NSCLC) patients with poor prognosis. Aim was to identify cancer intrinsic and extrinsic pathways regulated by hMENA11a downregulation as determinants of ICB response in NSCLC. Here, we present a potential novel mechanism of ICB resistance driven by hMENA11a downregulation.

Methods: Effects of hMENA11a downregulation were tested by RNA-Seq, ATAC-Seq, flow cytometry and biochemical assays. ICB-treated patient tumor tissues were profiled by Nanostring IO 360 Panel enriched with hMENA custom probes. OAK and POPLAR datasets were used to validate our discovery cohort.

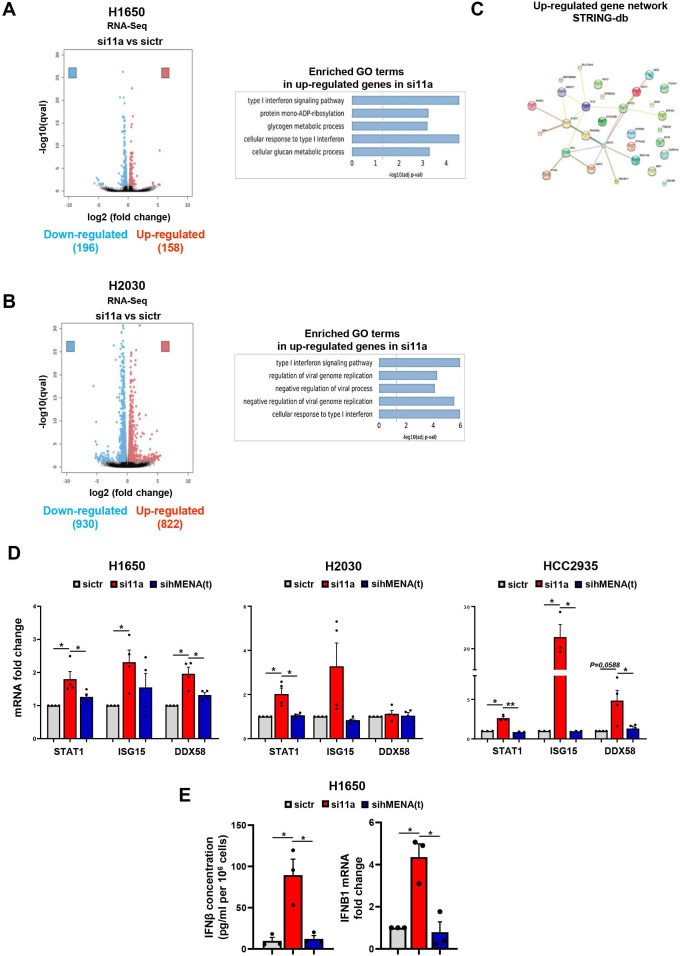
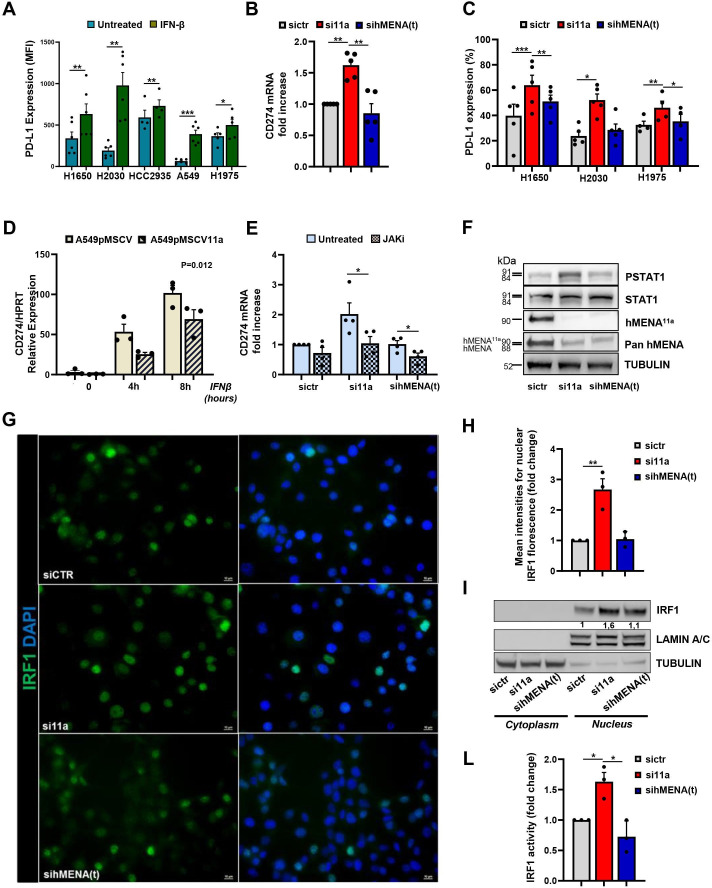
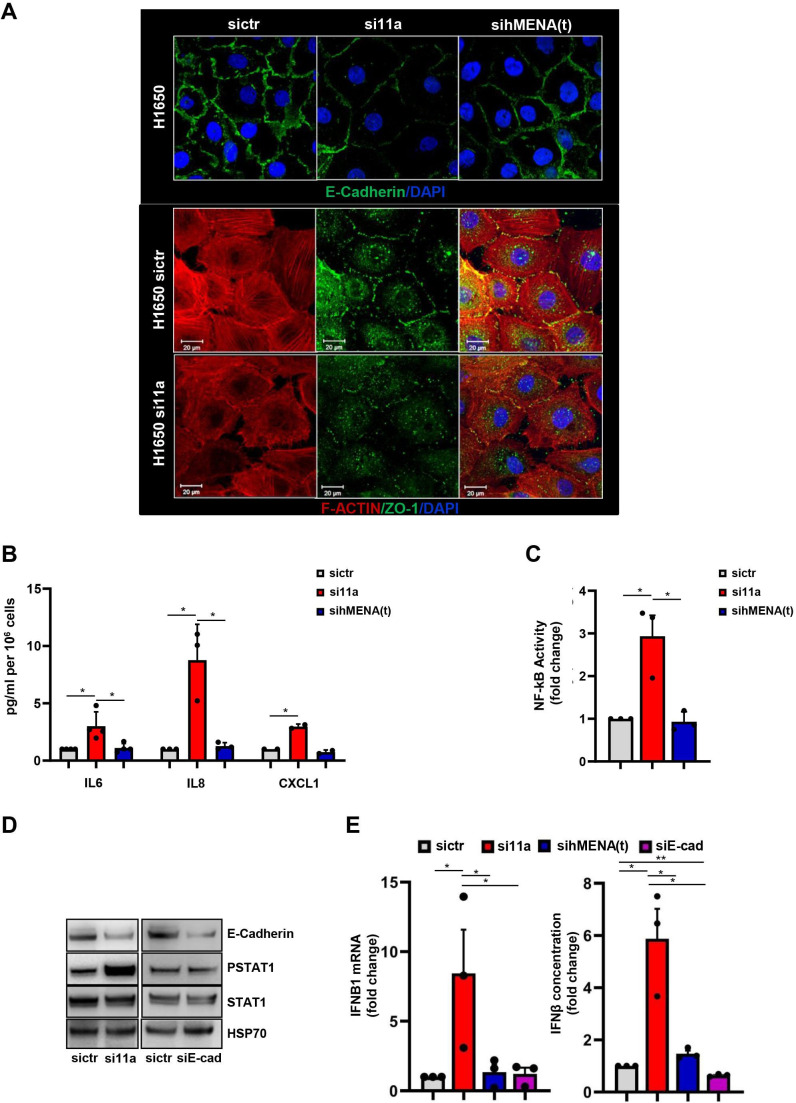
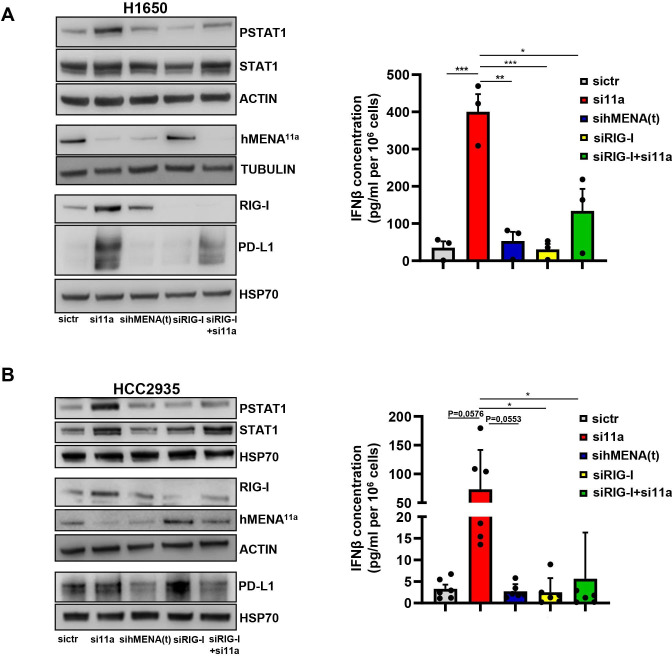
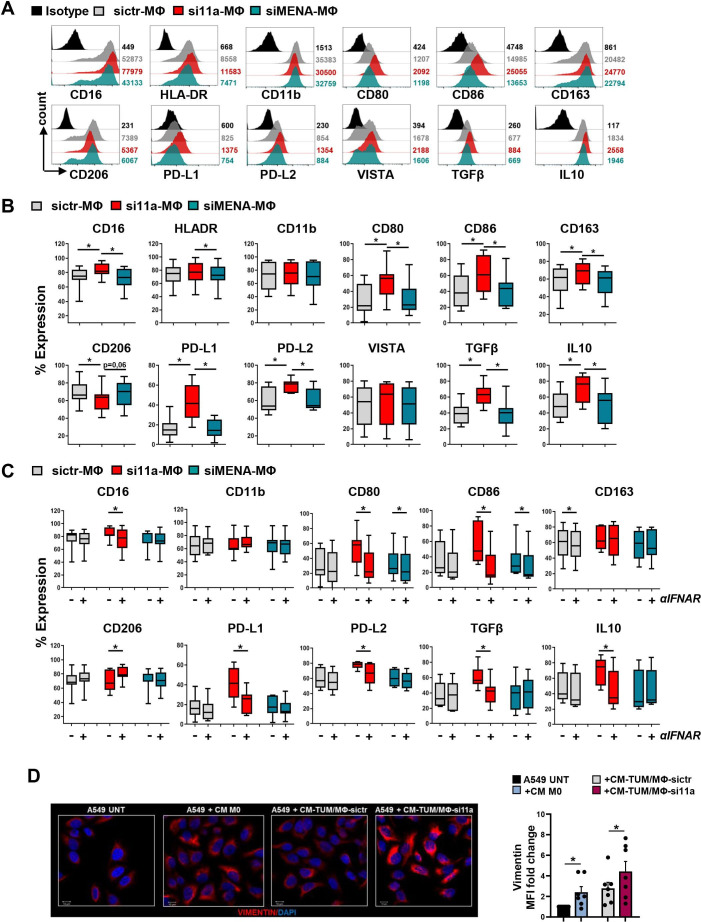
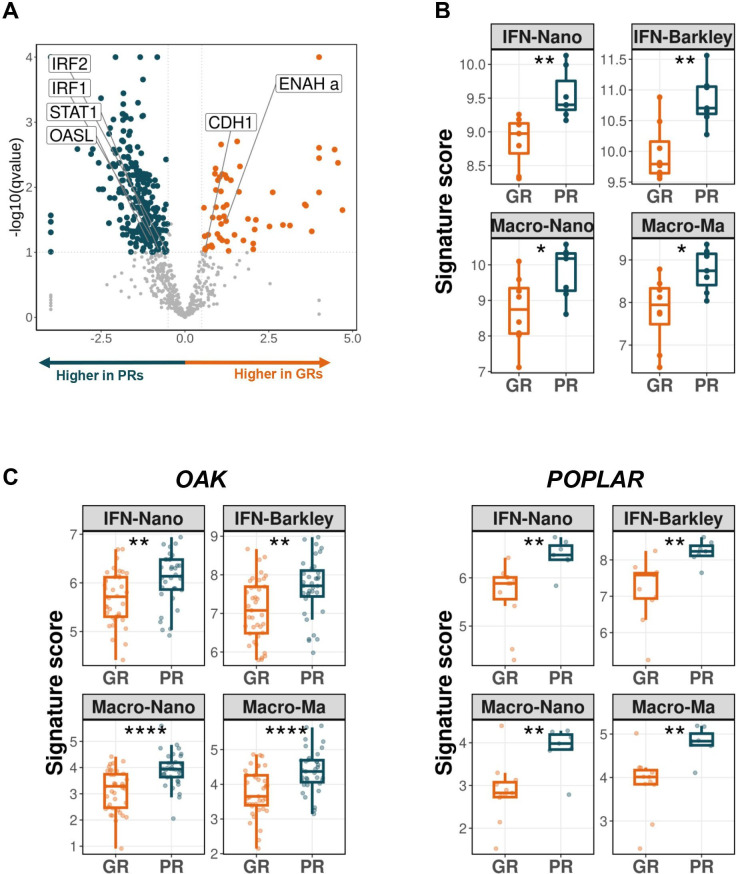
Results: Transcriptomic and biochemical analyses demonstrated that the depletion of hMENA11a induces IFN pathway activation, the production of different inflammatory mediators including IFNβ via RIG-I, sustains the increase of tumor PD-L1 levels and activates a paracrine loop between tumor cells and a unique macrophage subset favoring an epithelial-mesenchymal transition (EMT). Notably, when we translated our results in a clinical setting of NSCLC ICB-treated patients, transcriptomic analysis revealed that low expression of hMENA11a, high expression of IFN target genes and high macrophage score identify patients resistant to ICB therapy.

Conclusions: Collectively, these data establish a new function for the actin cytoskeleton regulator hMENA11a in modulating cancer cell intrinsic type I IFN signaling and extrinsic mechanisms that promote protumoral macrophages and favor EMT. These data highlight the role of actin cytoskeleton disturbance in activating immune suppressive pathways that may be involved in resistance to ICB in NSCLC.

Keywords: biomarkers, tumor; cytokines; immune checkpoint inhibitors; macrophages; non-small cell lung cancer.


Conflict of interest statement

Competing interests: None declared.

Figures

Figure 1
Figure 1
hMENA11a silencing upregulates transcripts of genes related to IFN-signaling pathways in NSCLC cell lines. (A, B) (left) Volcano plot showing statistical significance (qvalue, −log10 scaled) vs fold change (log2 scaled) for genes differentially expressed after deletion of hMENA11a in H1650 and H2030: 196 and 930 downregulated (blue) and 158 and 822 upregulated (red) genes in si11a cells vs sictr cells, respectively (q value <0.05). (A, B) (right) Enrichment analyses (GO Biological Process) of upregulated genes in si11a cells, H1650 (up) and H2030 (down). (C) Upregulated gene network in H1650 si11a cells revealed by STRING analysis. (D) qPCR results of mRNA levels of selected genes in sictr, si11a and sihMENA(t) H1650, H2030 and HCC2935 cells. (E) Levels of IFNβ in supernatants evaluated by ELISA (left) and of IFNB1 mRNA by qRT-PCR (right) expressed as fold-change relative to control in H1650 sictr, si11a, sihMENA(t) cells. (D, E) P values were calculated by two-tailed Student’s t-test. *p≤0.05; **p≤0.01.
Figure 2
Figure 2
hMENA11a silencing increases PD-L1 at mRNA and protein levels via JAK/STAT1/IRF1 axis in NSCLC cell lines. (A) PD-L1 expression levels (MFI) assessed by flow cytometry analysis in a panel of NSCLC cells, untreated or treated with IFNβ (50 ng/mL) for 24 hours. (B) qRT-PCR results of CD274 analyzed in sictr, si11a and sihMENA(t) H1650 cells. (C) PD-L1 expression levels assessed by flow cytometry analysis in a panel of sictr, si11a, and sihMENA(t) NSCLC cells. (D) CD274 mRNA expression levels evaluated by qRT-PCR in A549 transfected with empty vector (pMSCV) or hMENA11a (pMSCV11a), untreated or treated with IFNβ (50 ng/mL) for the indicated hours. (E) qRT-PCR results of CD274 analyzed in sictr, si11a and sihMENA(t) H1650 cells untreated or treated with JAK inhibitor (5 µM) for 72 hours. (F) Western blotting of cells treated as in (B). (G) Representative images of immunofluorescence of sictr, si11a and sihMENA(t) H1650 stained with anti-IRF1 antibody (green, left panel). Nuclei were stained with DAPI. Scale bar: 10 µm. (H) Quantitative analysis of nuclear IRF1 levels. Mean fluorescent intensities were determined by ImageJ and reported as fold changes. More than 100 cells were counted in three independent experiments. (I) Western blotting of nuclear and cytoplasmic fractions of sictr, si11a and sihMENA(t) H1650 cells. Anti-Lamin A/C and anti-tubulin antibodies were used as nuclear and cytoplasmic markers, respectively. Immunoreactivity was determined by ImageJ and numbers indicate the fold changes of IRF1 vs Lamin optical density values. For all western blots, one representative of at least three experiments is reported. (L) Luciferase assays of IRF1 transcriptional reporter activity in sictr, si11a and sihMENA(t) H1650 cells. Cells were cotransfected with non-targeting siRNA (sictr), or hMENA11a specific siRNA (si11a) or siRNA targeting total hMENA (sihMENA(t)) and with inducible IRF1 responsive construct expressing Renilla luciferase. 48 hours later a luciferase assay was performed. Graphs represent mean±SEM of three independent experiments. (A–C, E, H, L). P values were calculated by two-tailed Student’s t-test. (D) P value calculated by repeated measure ANOVA. *P≤0.05; **P≤ 0.01; ***P≤0.001. ANOVA, analysis of variance.
Figure 3
Figure 3
hMENA11a depletion perturbs cell–cell junction, induces proinflammatory cytokines via NF-kB. E-cadherin loss does not activate IFN-I pathway. (A) Representative immunofluorescence images of sictr and si11a, sihMENA(t) H1650 cells stained with anti-E-Cadherin antibody (green) (upper panel) or with phalloidin (red) and anti-ZO-1 antibody (green) (lower panel). Nuclei were stained with DAPI. Scale bar: 20 µm. (B) ELISA for the indicated cytokines in supernatants of sictr, si11a and sihMENA(t) H1650 cells. (C) NF-kB transcriptional reporter activity was assessed by luciferase assays in sictr, si11a and sihMENA(t) H1650 cells. Cells were cotransfected with specific siRNAs and with inducible NF-kB responsive construct expressing Renilla luciferase. Forty-eight hours later, a luciferase assay was performed. (D) Western blotting of sictr, si11a and siE-Cadherin H1650 cells. Anti-HSP70 was used as loading control. (E) IFNβ expression at mRNA level (IFNB1, qRT-PCR, left) and protein level detected by ELISA in supernatants (right) of H1650 sictr, si11a, sihMENA(t) and siE-Cadherin cells. Graphs represent mean±SEM of three independent experiments. (B, C, E). P values were calculated by two-tailed Student’s t-test. *P≤ 0.05; **P≤ 0.01.
Figure 4
Figure 4
hMENA11a depletion induces an increase of RIG-I which sustains IFNβ production, STAT1 activation and PD-L1 upregulation. (A, B) (Left) Western blotting analysis of sictr, si11a and sihMENA(t), siRIG-I and siRIG-I+si11a H1650 (A) and HCC2935 (B) cells. Anti-HSP70 was used as loading control. (A, B) (Right) IFNβ levels were measured by ELISA in supernatants of H1650 (A) and HCC2935 (B). Graphs represent the mean±SEM of three independent experiments. (A, B) P values were calculated by two-tailed Student’s t-test.
Figure 5
Figure 5
Conditioned medium derived from si11a NSCLC cells induces a unique macrophage phenotype. (A) Mean fluorescence intensity (MFI) expression levels of macrophage-specific markers shown in a representative flow cytometry analysis. Monocyte-derived M0-MΦs from healthy donors (HDs) were polarized for 24 hours with CM derived from sictr, si11a and sihMENA(t) H1650 cells (sictr-MΦs, si11a-MΦs, siMENA-MΦs, respectively). MFI values are indicated. (B) Levels of expression of macrophage markers by flow cytometry in MΦs treated as in (A) (n=9). Median value, first and third quartiles by box, minimum and maximum by whiskers. (C) Analysis of expression levels of selected macrophage markers by flow cytometry in M0-MΦs untreated or treated for 48 hours with anti-IFNAR Chain 2 Antibody (1 µg/mL), and then polarized with CM from sictr, si11a and sihMENA(t) H1650 cells (n=7). (D) (Left) Representative images of immunofluorescence analysis of A549 cells untreated (UNT) or treated with CM from M0-MΦs, CM-TUM/MΦ-sictr or CM-TUM/MΦ-si11a, stained with anti-Vimentin antibody (red). Nuclei were stained with DAPI. Scale bar: 20 µm. (Right) Quantitative analysis of Vimentin levels. MFI of vimentin/DAPI of three different fields per sample were reported as fold changes (n=7). P values were calculated by Wilcoxon rank test, with Bonferroni correction for multiple comparison. *p≤0.05. NSCLC, non-small cell lung cancer.
Figure 6
Figure 6
Low hMENA11a expression, high IFN pathway and Macrophage score identify poor responder ICB treated NSCLC patients. Differential Gene Expression Analysis (DGEA) between seven poor responders (PRs) and eight good responders (GRs) ICB treated NSCLC patients, by Nanostring nCounter PanCancer IO 360 Panel and custom probes for hMENA splicing variants (ENAHa for hMENA11a). (A) Volcano plot showing statistical significance (q value, −log10 scaled) vs Fold Change (log2 scaled) for genes differentially expressed in good responder cohort (GRs) vs poor responder cohort (PRs). Genes with −log10 (qvalue) <0.1 were considered significantly modulated. Log2 (Fold Change) positive values indicate higher expression in GRs (orange), log2 (Fold Changes) negative values indicate higher expression in PRs (blue). Selected genes are reported. The complete list of differentially expressed genes between GRs and PRs is reported in online supplemental file 2. (B) Boxplots showing the comparison of scores (log2 scaled) of four reported signatures between GRs and PRs in our internal cohort. IFN-Nano: IFN Response Signature Pathway included in IO 360 Panel by NanoString (t-test p<0.01); IFN-Barkley: Interferon Response Module reported by Barkley et al (t-test p<0.01); Macro-Nano: Macrophage signature genes included in IO 360 Panel by NanoString (t-test p<0.05); Macro-Ma: signature genes of IFN-TAM cluster reported by Ma et al (t-test p<0.05). (C) Boxplots showing the comparison of scores (log2 scaled) of the signatures reported in (B) between GRs and PRs in the OAK (39 vs 35 patients) and POPLAR (11 vs 7 patients) datasets. Shown in the boxplots are the medians (horizontal lines), 25th–75th percentiles (box outlines), and highest and lowest values within 1.5 times the interquartile range (vertical lines). T test OAK dataset: IFN-Nano: P=0.0024; IFN-Barkley: P=0.0021; Macro-Nano: P<0.00001; Macro-Ma: P<0.00001. T test POPLAR dataset: IFN-Nano: P=0.0035; IFN-Barkley: P=0.0025; Macro-Nano: P=0.003; Macro-Ma: P=0.0018. * P ≤ 0.05; ** P ≤ 0.01; **** P ≤ 0.0001. ICB, immune checkpoint blockade; NSCLC, non-small cell lung cancer.

Similar articles

Cited by

References

    1. Govindan R, Aggarwal C, Antonia SJ, et al. . Society for Immunotherapy of cancer (SITC) clinical practice guideline on Immunotherapy for the treatment of lung cancer and Mesothelioma. J Immunother Cancer 2022;10:e003956. 10.1136/jitc-2021-003956 - DOI - PMC - PubMed
    1. Anagnostou V, Landon BV, Medina JE, et al. . Translating the evolving molecular landscape of tumors to biomarkers of response for cancer Immunotherapy. Sci Transl Med 2022;14:eabo3958. 10.1126/scitranslmed.abo3958 - DOI - PMC - PubMed
    1. Parker BS, Rautela J, Hertzog PJ. Antitumour actions of Interferons: implications for cancer therapy. Nat Rev Cancer 2016;16:131–44. 10.1038/nrc.2016.14 - DOI - PubMed
    1. Musella M, Guarracino A, Manduca N, et al. . Type I Ifns promote cancer cell Stemness by triggering the epigenetic regulator Kdm1B. Nat Immunol 2022;23:1379–92. 10.1038/s41590-022-01290-3 - DOI - PMC - PubMed
    1. Chen J, Cao Y, Markelc B, et al. . Type I IFN protects cancer cells from Cd8+ T cell-mediated cytotoxicity after radiation. J Clin Invest 2019;129:4224–38. 10.1172/JCI127458 - DOI - PMC - PubMed

Publication types

MeSH terms