. 2023 Aug 23;14(1):5137.
doi: 10.1038/s41467-023-40820-x.

Type-2 CD8+ T-cell formation relies on interleukin-33 and is linked to asthma exacerbations

Affiliations

Type-2 CD8+ T-cell formation relies on interleukin-33 and is linked to asthma exacerbations

Esmee K van der Ploeg et al. Nat Commun. .

Abstract

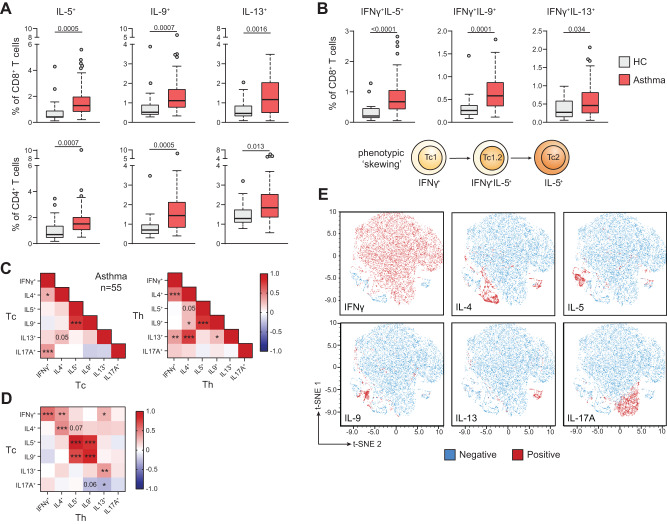
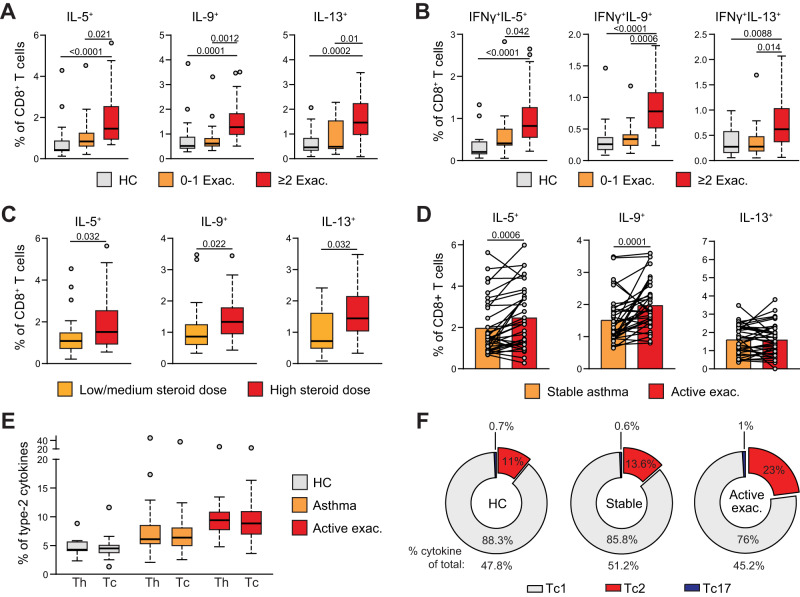
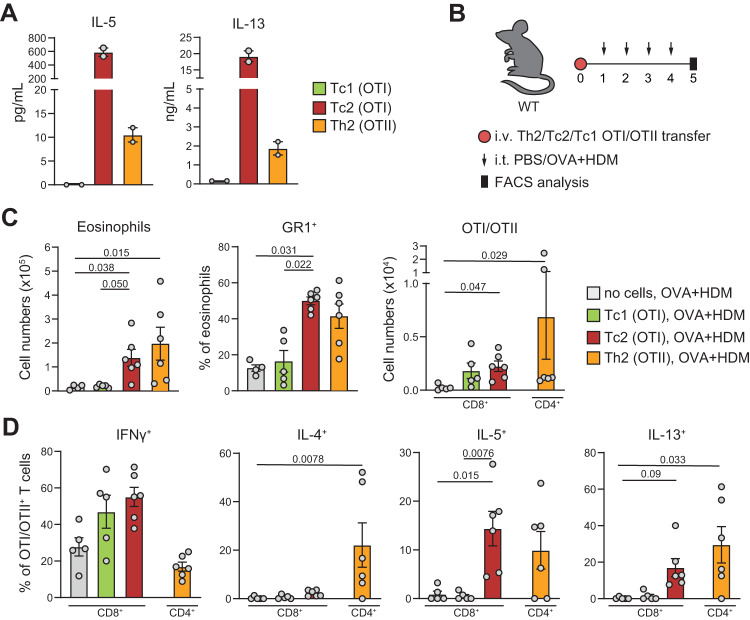
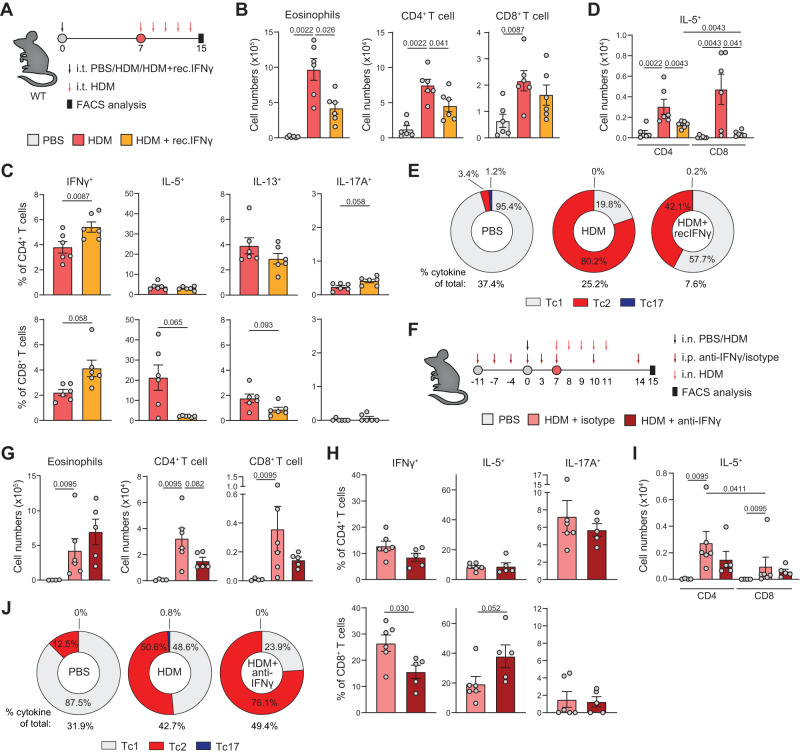
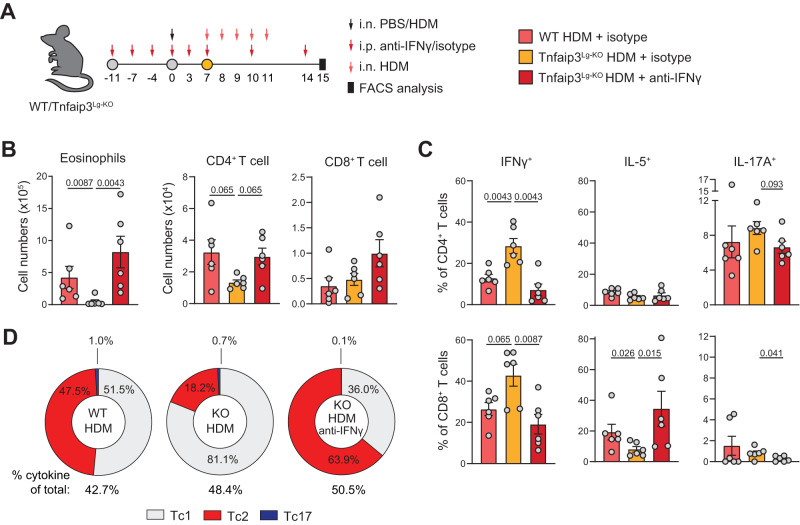
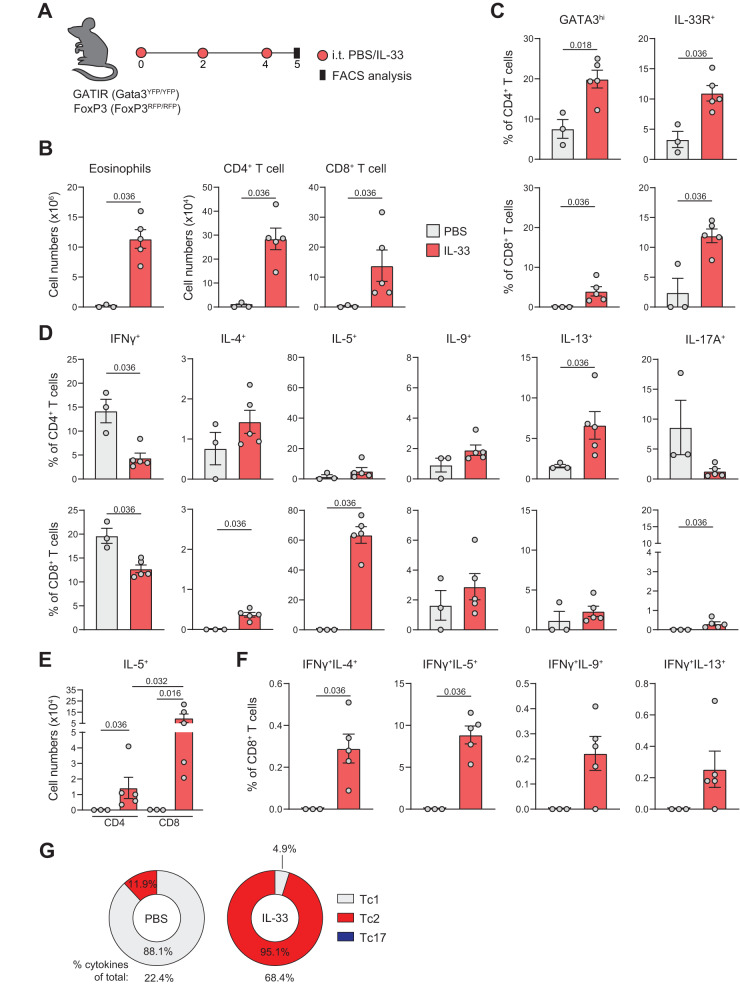
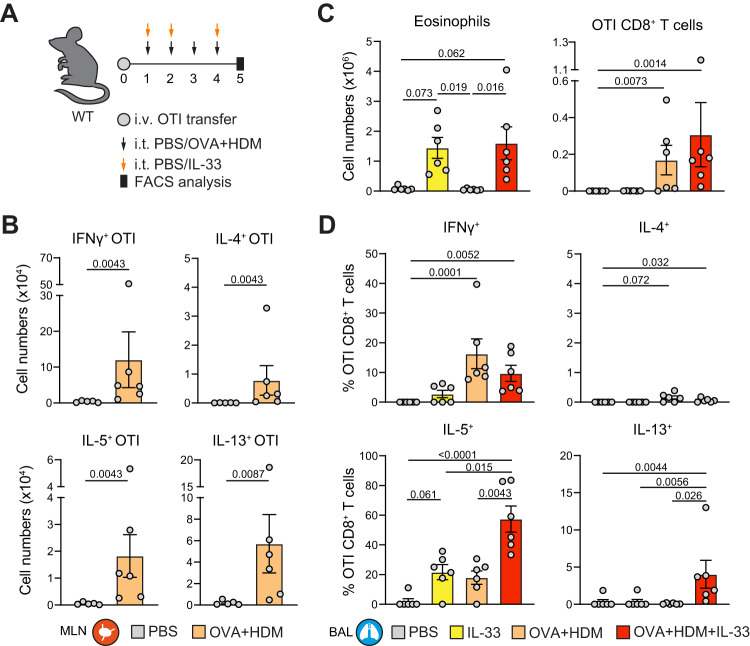
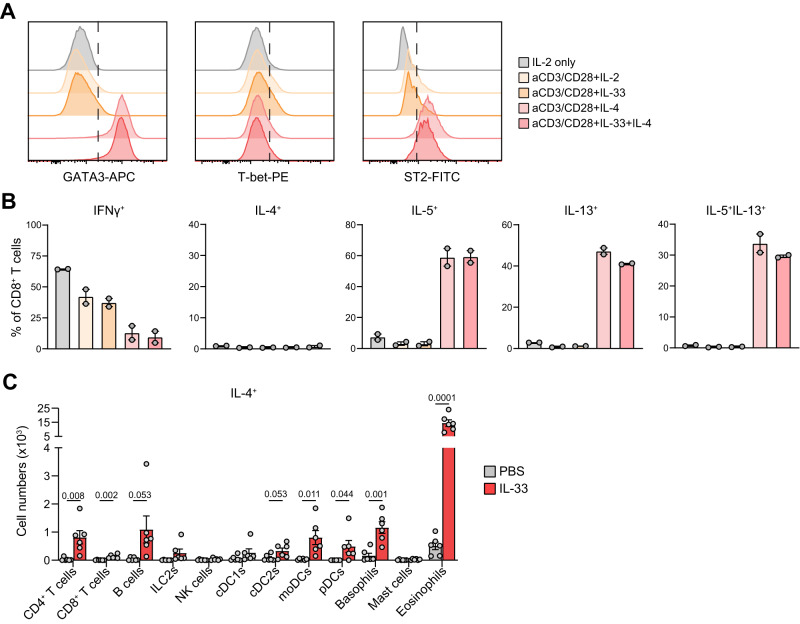
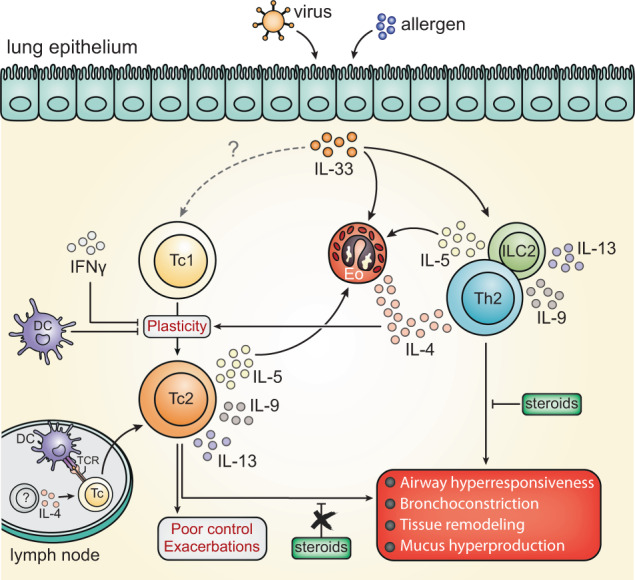
CD4+ T helper 2 (Th2) cells and group 2 innate lymphoid cells are considered the main producers of type-2 cytokines that fuel chronic airway inflammation in allergic asthma. However, CD8+ cytotoxic T (Tc) cells - critical for anti-viral defense - can also produce type-2 cytokines (referred to as 'Tc2' cells). The role of Tc cells in asthma and virus-induced disease exacerbations remains poorly understood, including which micro-environmental signals and cell types promote Tc2 cell formation. Here we show increased circulating Tc2 cell abundance in severe asthma patients, reaching peak levels during exacerbations and likely emerging from canonical IFNγ+ Tc cells through plasticity. Tc2 cell abundance is associated with increased disease burden, higher exacerbations rates and steroid insensitivity. Mouse models of asthma recapitulate the human disease by showing extensive type-2 skewing of lung Tc cells, which is controlled by conventional type-1 dendritic cells and IFNγ. Importantly, we demonstrate that the alarmin interleukin-33 (IL-33) critically promotes type-2 cytokine production by lung Tc cells in experimental allergic airway inflammation. Our data identify Tc cells as major producers of type-2 cytokines in severe asthma and during exacerbations that are remarkably sensitive to alterations in their inflammatory tissue micro-environment, with IL-33 emerging as an important regulator of Tc2 formation.


Conflict of interest statement

G.J.B. and G.A.T. declare the following competing interests: G.J.B. has received grant/research support for consultations and/or speaking at conferences from Novartis, GSK, AstraZeneca, ALK, Teva, Sanofi, and Chiesi. G.A.T. has received research support and consultation fees from OM Pharma, AstraZeneca, and Chiesi, all paid to a research foundation. The remaining authors declare no competing interests.

Figures

Fig. 1
Fig. 1. Type-2 skewing of circulating Tc cells in asthma.
A Quantification of IL-5+, IL-9+, and IL-13+ Tc and Th cells using flow cytometry in PB samples of 17 HC individuals and 55 asthma patients. B Quantification of IFNγ+IL-5+, IFNγ+IL-9+, and IFNγ+IL-13+ double-producing Tc cells in PB samples of HC individuals and asthma patients. C, D Correlation matrices of cytokine production between (C) and across (D) Th/Tc cell compartments. E tSNE analysis of flow cytometry data using all cytokine-producing Tc cells from asthma patients, depicting either IFNγ+, IL-4+, IL-5+, IL-9+, IL-13+, or IL-17A+ producing Tc cells in red. Symbols in A, B represent individual donors; bars indicate mean values ±SEM. *P < 0.05, **P < 0.01, ***P < 0.001, ****P < 0.0001 (two-tailed Mann–Whitney U test, Pearson correlation coefficient analysis). PB peripheral blood, HC healthy control. Source data are provided as a Source Data file.
Fig. 2
Fig. 2. Type-2 skewing of Tc cells is linked to asthma symptom severity.
A Quantification of IL-5+, IL-9+, and IL-13+ Tc cells using flow cytometry in PB samples of 17 HC individuals and asthma patients with 0-1 exacerbations (‘Exac.’, n = 16) or ≥2 exacerbations in the previous year (n = 38). B Quantification of IFNγ+IL-5+, IFNγ+IL-9+, and IFNγ+IL-13+ double-producing Tc cells in PB samples of 17 HC individuals and asthma patients with 0-1 exacerbations (‘Exac.’, n = 16) or ≥2 exacerbations in the previous year (n = 38). C Quantification of IL-5+, IL-9+, and IL-13+ Tc cells in PB samples of asthma patients with low/medium steroid dose intake (<1000 bioequivalent units, n = 23) and high steroid dose intake (>1000 dose bioequivalent units, n = 30). D Quantification of IL-5+, IL-9+, and IL-13+ Tc cells in 35 paired PB samples of asthma patients during stable disease and during an active exacerbation (‘Active exac’). E Quantification of type-2 cytokine production (combining all IL-4, IL-5, IL-9, and IL-13 producing cells) by Th and Tc cells in 17 HC individuals, 55 asthma patients, and during an active exacerbation (n = 35). F Pie charts summarizing proportions of Tc1, Tc2, and Tc17 cells in HCs, asthma patients, and during an active exacerbation. ‘% cytokines of total:’ indicates percentage of all Tc cells that produce one of the cytokine assayed. Symbols in AE represent individual donors; Bars indicate mean values ±SEM. *P < 0.05, **P < 0.01, ***P < 0.001, ****P < 0.0001 (two-tailed Mann–Whitney U test, Wilcoxon rank-sum test, Kruskal–Wallis test corrected for multiple testing or Pearson correlation coefficient analysis), PB peripheral blood, HC healthy control, Tc1: cells producing IFNγ excluding double-producers of type-2 or type-3 cytokines, Tc2: any cell producing either IL-4 IL-5 IL-9 or IL-13, Tc17: cells producing IL-17A excluding double-producers of type-1 or type-2 cytokines. PB peripheral blood, HC healthy control. Source data are provided as a Source Data file.
Fig. 3
Fig. 3. Tc2 cells can induce eosinophilic airway inflammation in vivo.
A IL-5 and IL-13 levels were measured by ELISA in culture supernatants of the indicated cells, derived from two OTI or OTII mice. naive OTI or OTII cells were cultured with anti-CD3, anti-CD28 in the presence of IL-2 for Tc1 polarization, or IL-2, IL-4, and anti-IFNγ for Tc2 polarization. For Th2 polarization, cells were cultured in the presence of IL-2, IL-4, anti-IFNγ and anti-IL-12/23 p40. B Schematic overview of AAI model induced by ovalbumin (OVA): cultured Tc1, Tc2, or Th2 OTI/OTII cells were transferred intravenously into WT mice. The next day, mice were challenged i.t. with 50 μg OVA and 10 μg HDM daily for 4 consecutive days. Analysis was performed on day 5. C Numbers of total eosinophils, proportions of GR-1% eosinophils, and numbers of CD4+ or CD8+ T cells determined in BAL by flow cytometry analysis. No cells, OVA + HDM: n = 4, OTI Tc1, OVA + HDM: n = 5, OTI Tc2, OVA + HDM: n = 6, OTII Th2, OVA + HDM: n = 6. D Quantification of IFNγ+, IL-4+, IL-5+, and IL-13+ Th and Tc cells in BAL by flow cytometry. No cells, OVA + HDM: n = 5, OTI Tc1, OVA + HDM: n = 5, OTI Tc2, OVA + HDM: n = 6, OTII Th2, OVA + HDM: n = 6. Symbols represent individual mice, bars indicate mean values ±SEM. *P < 0.05, **P < 0.01, ***P < 0.001, (two-tailed Kruskal–Wallis test corrected for multiple testing). AAI allergic airway inflammation, WT wild type, BAL bronchoalveolar lavage. Source data are provided as a Source Data file.
Fig. 4
Fig. 4. IFNγ suppresses type-2 skewing of Tc cells.
A Schematic overview of AAI model induced by HDM: WT mice were sensitized i.t. with PBS or 10 μg HDM on day 0 and challenged i.t. with 10 μg HDM daily from day 7 to day 11. 50 ng recombinant-IFNγ (recIFNγ) was given i.t. simultaneously with HDM sensitization on day 0. Analysis was performed on day 15. B Numbers of eosinophils, CD4+, and CD8+ T cells determined in BAL by flow cytometry analysis. C Quantification of IFNγ+, IL-5+, IL-13+, and IL-17A+ Th and Tc cells in BAL by flow cytometry. D Numbers of IL-5+ Th and Tc cells in BAL measured by flow cytometry. E Pie charts summarizing proportions of Tc1, Tc2, and Tc17 cells in PBS or HDM-sensitized WT mice treated with or without recIFNγ. F Schematic overview of AAI model induced by HDM: WT mice were sensitized intranasally (i.n.) with PBS or 1 μg HDM on day 0 and challenged i.n. with 10 μg HDM daily from day 7 to day 11. 0.5 mg anti-IFNγ was given intraperitoneally (i.p.) on days −11, −7, −4, 0, 3, 7, 10, and 14. Analysis was performed on day 15. G Numbers of eosinophils, CD4+, and CD8+ T cells were determined in BAL by flow cytometry. PBS: n = 4, HDM: n = 6, HDM+anti-IFNγ: n = 5. H Quantification of IFNγ+, IL-5+, and IL-17A+ Th and Tc cells in BAL by flow cytometry. HDM: n = 6, HDM+anti-IFNγ: n = 5. I Numbers of IL-5+ Th and Tc cells in BAL measured by flow cytometry. PBS: n = 4, HDM: n = 6, HDM+anti-IFNγ: n = 5. J Pie charts summarizing proportions of Tc1, Tc2, and Tc17 cells in PBS or HDM-sensitized WT mice treated with or without anti-IFNγ. ‘% cytokine of total:’ indicates percentage of all Tc cells that produce one of the cytokines assayed. Symbols represent individual mice, B–D: n = 6 mice per group, G-I: PBS, n = 4 mice; HDM, n = 6 mice; HDM+anti-IFNγ, n = 5 mice. Bars indicate mean values ±SEM. *P < 0.05, **P < 0.01 (two-tailed Mann–Whitney U test). AAI allergic airway inflammation, HDM house dust mite, WT wild type, BAL bronchoalveolar lavage. Source data are provided as a Source Data file.
Fig. 5
Fig. 5. Depletion of Tnfaip3 in Langerin+ cDC1s suppresses type-2 skewing of Tc cells which is restored by blocking IFNγ.
A Schematic overview of AAI model induced by HDM: WT and Tnfaip3Lg-KO mice were sensitized intranasally (i.n.) with PBS or 1 μg HDM on day 0 and challenged i.n. with 10 μg HDM daily from day 7 to day 11. 0.5 mg anti-IFNγ was given intraperitoneal (i.p.) on days −11, −7, −4, 0, 3, 7, 10, and 14. Analysis was performed on day 15. B Numbers of eosinophils, CD4+, and CD8+ T cells determined in BAL by flow cytometry analysis. C Quantification of IFNγ+, IL-5+, and IL-17A+ Th and Tc cells in BAL by flow cytometry. D Pie charts summarizing proportions of Tc1, Tc2, and Tc17 cells in PBS or HDM-sensitized WT or Tnfaip3Lg-KO mice treated with or without anti-IFNγ. ‘% cytokine of total:’ indicates percentage of all Tc cells that produce one of the cytokines assayed. Symbols represent individual mice, B-C: n = 6 mice per group, bars indicate mean values ±SEM. *P < 0.05, **P < 0.01 (two-tailed Mann–Whitney U test). AAI allergic airway inflammation, HDM house dust mite, WT wild type, BAL bronchoalveolar lavage. Source data are provided as a Source Data file.
Fig. 6
Fig. 6. IL-33 induces type-2 skewing of Tc cells.
A Schematic overview of eosinophilic airway inflammation induced by IL-33: GATIR/FoxP3 (Gata3YFP/YFPFoxP3IRES/mRFP) mice were treated i.t. with PBS or 0.5 μg IL-33 on day 0, 2 and 4. Analysis was performed on day 5. B Numbers of eosinophils, CD4+, and CD8+ T cells determined in BAL by flow cytometry. C Quantification of GATA3hi and IL-33R+ (ST2) Th and Tc cells in BAL by flow cytometry. D Quantification of IFNγ+, IL-4+, IL-5+, IL-9+, IL-13+, and IL-17A+ Th and Tc cells in BAL by flow cytometry. E Numbers of IL-5+ Th and Tc cells in the BAL measured by flow cytometry. F Quantification of IFNγ+IL-4+, IFNγ+IL-5+, IFNγ+IL-9+, and IFNγ+IL-13+ double-producing Tc cells in BAL. G Pie charts summarizing proportions of Tc1, Tc2, and Tc17 cells in PBS or IL-33 treated WT mice. ‘% cytokine of total:’ indicates percentage of all Tc cells that produce one of the cytokines assayed. Symbols represent individual mice, PBS: n = 3 mice, IL-33: n = 5 mice, bars indicate mean values ±SEM. *P < 0.05, (two-tailed Mann–Whitney U test). AAI allergic airway inflammation, WT wild type, BAL bronchoalveolar lavage. Source data are provided as a Source Data file.
Fig. 7
Fig. 7. Type-2 skewing by IL-33 in the context of an antigen-specific Tc response.
A Schematic overview of eosinophilic airway inflammation induced by IL-33 and/or ovalbumin (OVA): naive OTI cells were first transferred into WT recipient mice. The next day, mice were challenged intratracheally with 50 μg OVA and 10 μg HDM, 0.5 µg IL-33, or a combination treatment. Analysis was performed on day 5. B Numbers of IFNγ+, IL-4+, IL-5+, and IL-13+ OTI Tc cells were determined in the mediastinal lymph node (MLN) by flow cytometry. PBS: n = 5, OVA + HDM: n = 6 mice. C Numbers of eosinophils and OTI Tc cells determined in BAL by flow cytometry. D Quantification of IFNγ+, IL-4+, IL-5+, and IL-13+ OTI Tc cells in BAL by flow cytometry. Symbols represent individual mice, C, D n = 6 mice per group, bars indicate mean values ±SEM. *P < 0.05, **P < 0.01, ***P < 0.001 (two-tailed Mann–Whitney or Kruskal–Wallis test corrected for multiple testing). WT wild type, BAL bronchoalveolar lavage. Source data are provided as a Source Data file.
Fig. 8
Fig. 8. Loss of IL-33 reduces type-2 skewing in Tc cells.
A Schematic overview of AAI model induced by HDM: WT and IL-33KO mice were sensitized i.t. with PBS or 10 μg HDM on day 0 and challenged i.t. with 10 μg HDM daily from day 7 to day 11. Analysis was performed on day 12. B Numbers of eosinophils, CD4+, and CD8+ T cells determined in BAL by flow cytometry analysis. PBS: n = 11, WT HDM: n = 13, IL-33ko HDM: n = 12 mice. C Quantification of IFNγ+, IL-5+, IL-9+, and IL-17A+ Th and Tc cells in BAL by flow cytometry. For IFNγ, IL-5 and IL-17A, WT HDM: n = 13 and for IL-33ko HDM: n = 12 mice. For IL-9, n = 6 mice per group. D Numbers of IL-5+ Th and Tc cells in the BAL measured by flow cytometry. PBS: n = 11, WT HDM: n = 13, IL-33ko HDM: n = 12 mice. E Pie charts summarizing proportions of Tc1, Tc2, and Tc17 cells in PBS or HDM-sensitized WT and IL-33KO mice. ‘% cytokine of total:’ indicates percentage of all Tc cells that produce one of the cytokines assayed. Symbols represent individual mice, bars indicate mean values ±SEM. *P < 0.05, ***P < 0.001, ****P < 0.0001 (two-tailed Mann–Whitney U test). AAI allergic airway inflammation, HDM house dust mite, WT wild type, BAL bronchoalveolar lavage. Source data are provided as a Source Data file.
Fig. 9
Fig. 9. Evidence for indirect type-2 skewing of Tc cells by IL-33.
A Flow cytometric characterization of the transcription factors GATA3 and T-bet and the IL-33 receptor ST2 on cultured mouse Tc cells exposed to the indicated cytokines in combination with TCR stimulation via anti-CD3/CD28 beads. B Quantification of IFNγ+, IL-4+, IL-5+, IL-9+, IL-13+, and IL-5+IL-13+ cultured Tc cells measured by flow cytometry (n = 2). C Numbers of IL-4 producing CD4+ and CD8+ T cells, B cells, group 2 innate lymphoid cells (ILC2s), natural killer (NK) cells, conventional DC (cDC) 1 and cDC2 cells, monocyte-derived DCs (moDCs), plasmacytoid DCs (pDCs), basophils, mast cells and eosinophils determined in BAL of PBS or IL-33 treated mice (n = 6 mice per group, treatment regime shown in Fig. 6A) by flow cytometry analysis. Symbols represent individual mice, bars indicate mean values ±SEM. *P < 0.05, **P < 0.01, ***P < 0.001 (two-tailed Mann–Whitney U test). BAL bronchoalveolar lavage. Source data are provided as a Source Data file.
Fig. 10
Fig. 10. Tc2 cell formation as a key mediator of uncontrolled asthma and exacerbations.
Schematic drawing summarizing the main findings of this study and placing them in the context of asthma pathophysiology (adapted from Ref. .). Allergens induce epithelial release of alarmins such as IL-33, which can promote type-2 cytokine production (IL-4, IL-5, IL-9, and IL-13) by allergen-specific CD4+ Th2 cells that are classically considered to fuel the hallmark symptoms of allergic asthma (listed in the red box). In addition, IL-33 promotes local IL-4 production by various other immune cells, including eosinophils. Respiratory viruses, the major triggers of asthma exacerbations, promote CD8+ Tc cell activation in the lung and also induce epithelial IL-33 release. In severe asthmatics, in particular during a virus-induced exacerbation, high levels of IL-33 promote immune cell-derived IL-4 production to induce phenotypic skewing of the Tc1 cell population towards type-2 cytokine-producing Tc2 cells. It remains possible that IL-33 also directly acts up Tc1 cells to activate type-2 cytokine synthesis in vivo. Type-2 skewing likely occurs via plasticity of canonical IFNγ-producing Tc1 cells and is suppressed by IFNγ and cDC1 activity. Tc2 formation can also occur in draining lymph nodes in the context of a primary antigen-specific Tc response, although the local cellular source of IL-4 in this scenario remains to be determined. Altogether, this Tc2-derived surge in type-2 cytokine production capacity may explain the increased disease burden, exacerbation frequencies, and corticosteroid resistance observed in severe asthma patients.

References

    1. Papi A, Brightling C, Pedersen SE, Reddel HK. Asthma. Lancet. 2018;391:783–800. - PubMed
    1. Hammad H, Lambrecht BN. The basic immunology of asthma. Cell. 2021;184:1469–1485. - PubMed
    1. van der Ploeg EK, Carreras Mascaro A, Huylebroeck D, Hendriks RW, Stadhouders R. Group 2 innate lymphoid cells in human respiratory disorders. J. Innate Immun. 2020;12:47–62. - PMC - PubMed
    1. Pavord ID, et al. After asthma: redefining airways diseases. Lancet. 2018;391:350–400. - PubMed
    1. Banuelos J, Lu NZ. A gradient of glucocorticoid sensitivity among helper T cell cytokines. Cytokine Growth Factor Rev. 2016;31:27–35. - PMC - PubMed

Publication types