. 2023 Aug 23;10(1):554.
doi: 10.1038/s41597-023-02458-8.

An open-access dataset of naturalistic viewing using simultaneous EEG-fMRI

Affiliations

An open-access dataset of naturalistic viewing using simultaneous EEG-fMRI

Qawi K Telesford et al. Sci Data. .

Abstract

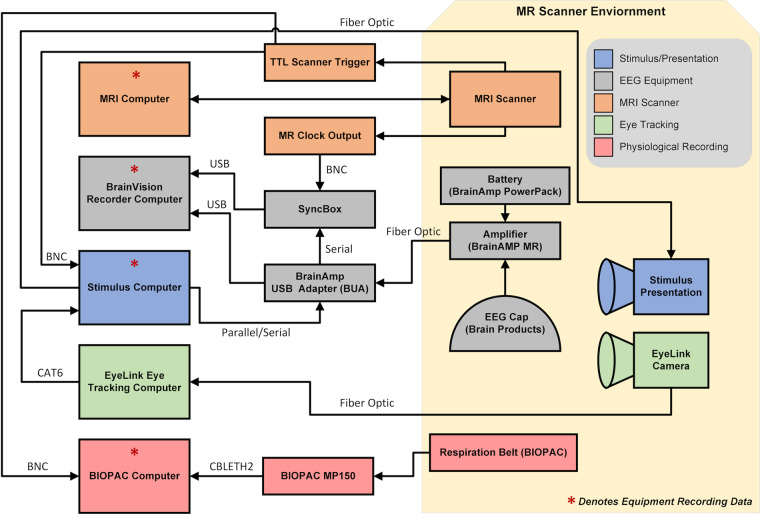
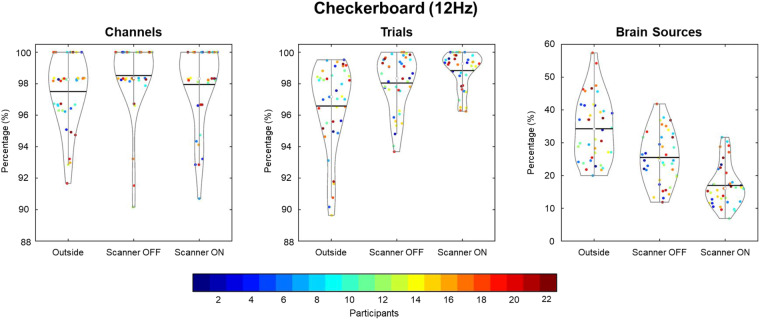
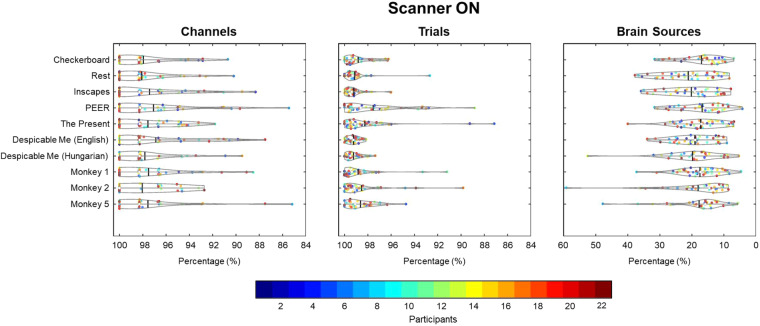
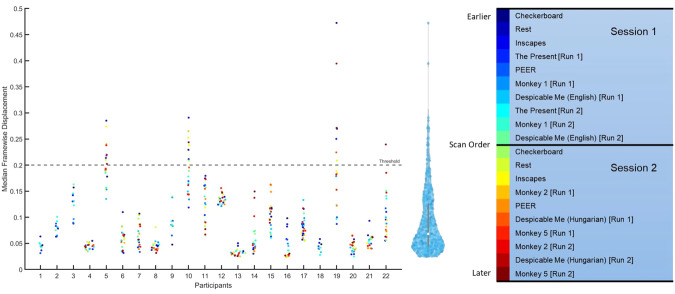
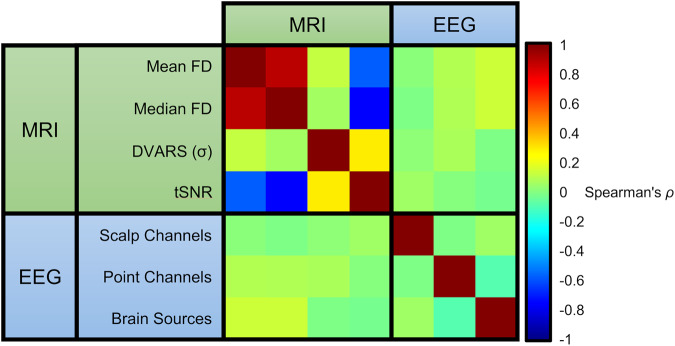
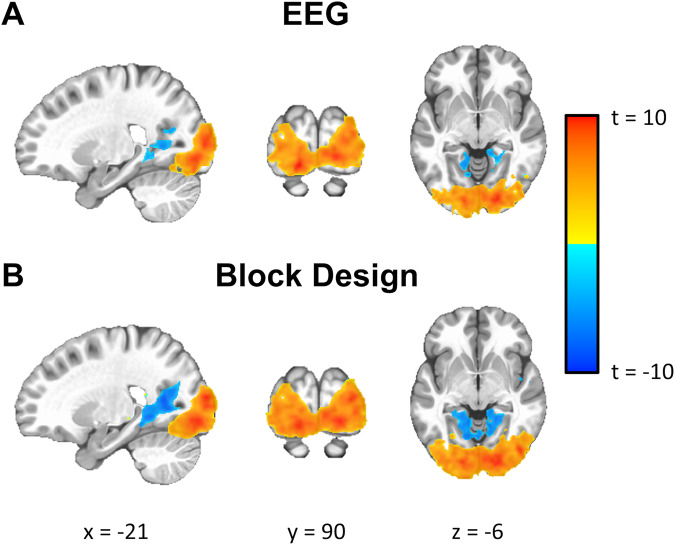
In this work, we present a dataset that combines functional magnetic imaging (fMRI) and electroencephalography (EEG) to use as a resource for understanding human brain function in these two imaging modalities. The dataset can also be used for optimizing preprocessing methods for simultaneously collected imaging data. The dataset includes simultaneously collected recordings from 22 individuals (ages: 23-51) across various visual and naturalistic stimuli. In addition, physiological, eye tracking, electrocardiography, and cognitive and behavioral data were collected along with this neuroimaging data. Visual tasks include a flickering checkerboard collected outside and inside the MRI scanner (EEG-only) and simultaneous EEG-fMRI recordings. Simultaneous recordings include rest, the visual paradigm Inscapes, and several short video movies representing naturalistic stimuli. Raw and preprocessed data are openly available to download. We present this dataset as part of an effort to provide open-access data to increase the opportunity for discoveries and understanding of the human brain and evaluate the correlation between electrical brain activity and blood oxygen level-dependent (BOLD) signals.


Conflict of interest statement

The authors declare no competing interests.

Figures

Fig. 1
Fig. 1
Schematic of EEG-fMRI setup.
Fig. 2
Fig. 2
EEG data validation. (A) Comparison of the power spectrum for participants across scanning conditions: Outside, Inside the scanner with the Scanner OFF, and Scanner ON; (B) Time-frequency comparison of checkerboard and rest blocks over 2 s epochs across conditions; (C) Permutation subtraction of Checkerboard and Rest. Statistically significant regions are outlined by black lines. Natably, the frequency range around 12 and 24 Hz are statistically significant across all conditions; (D) Topographic plots comparing Rest and Checkerboard condition, and their difference, across three conditions.
Fig. 3
Fig. 3
EEG data quality comparison for flickering checkerboard task across participants. Three quality metrics (percentage of good channels, percentage of good trials, and percentage of ICA brain sources) were assessed across scan conditions. For channels and trials, the data quality was high across all scan conditions, denoting high quality of EEG data.
Fig. 4
Fig. 4
EEG data quality comparison inside scanner. Three quality metrics (percentage of good channels, percentage of good trials, and percentage of ICA brain sources) were assessed across scan conditions. For channels and trials, the data quality was high across all scan conditions, denoting the maintenance of high quality EEG data across the imaging session.
Fig. 5
Fig. 5
Median framewise displacement for fMRI data across the 22 participants in the study. The median framewise displacement was measured for each scan across both sessions and plotted for each participant. Scans with a value above 0.2 were considered high motion, indicated as points about the dotted threshold line. To the right of the plot, is the distribution of all scans. As seen in the distribution, participant compliance was good and most scans had low motion as measured by median FD.
Fig. 6
Fig. 6
Distributions of correlation coefficients comparing within scans and between scans from the same participant, and within subject and between subject scans across all participants. When viewing a single participant, the distribution of correlation coefficients is broader (i.e., a longer tailed distribution) within scan compared to correlations between scans, reflecting stronger intrascan correlation coefficients. Similarly, the within subject correlation coefficients were stronger within participant compared to correlations between subjects.
Fig. 7
Fig. 7
Correlation between MRI and EEG data. As expected, there is strong positive correlation between measures of mean and median FD; likewise, there is a strong negative correlation between measures of FD and tSNR. In contrast, there appears no association among EEG measures within modality and with fMRI quality measures.
Fig. 8
Fig. 8
Checkerboard task group activation map either using the (A) group average EEG signal from Oz as a regressor or (B) a block design to generate the hemodynamic response function.

References

    1. Mele G, et al. Simultaneous EEG-fMRI for functional neurological assessment. Front. Neurol. 2019;10:848. doi: 10.3389/fneur.2019.00848. - DOI - PMC - PubMed
    1. Nentwich M, et al. Functional connectivity of EEG is subject-specific, associated with phenotype, and different from fMRI. Neuroimage. 2020;218:117001. doi: 10.1016/j.neuroimage.2020.117001. - DOI - PMC - PubMed
    1. Allen PJ, Josephs O, Turner R. A method for removing imaging artifact from continuous EEG recorded during functional MRI. Neuroimage. 2000;12:230–239. doi: 10.1006/nimg.2000.0599. - DOI - PubMed
    1. Yan WX, Mullinger KJ, Geirsdottir GB, Bowtell R. Physical modeling of pulse artefact sources in simultaneous EEG/fMRI. Hum. Brain Mapp. 2010;31:604–620. doi: 10.1002/hbm.20891. - DOI - PMC - PubMed
    1. Luo Q, Huang X, Glover GH. Ballistocardiogram artifact removal with a reference layer and standard EEG cap. J. Neurosci. Methods. 2014;233:137–149. doi: 10.1016/j.jneumeth.2014.06.021. - DOI - PMC - PubMed