Observational Study
. 2023 Aug 23;14(1):5139.
doi: 10.1038/s41467-023-40460-1.

Persistent symptoms after COVID-19 are not associated with differential SARS-CoV-2 antibody or T cell immunity

Affiliations
Observational Study

Persistent symptoms after COVID-19 are not associated with differential SARS-CoV-2 antibody or T cell immunity

Daniel M Altmann et al. Nat Commun. .

Abstract

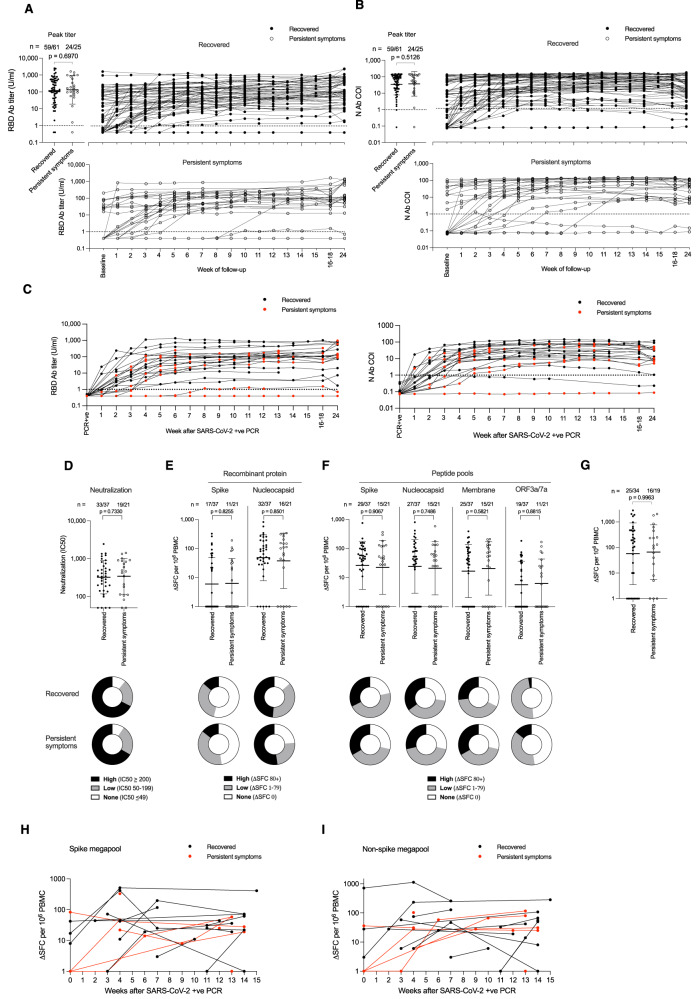
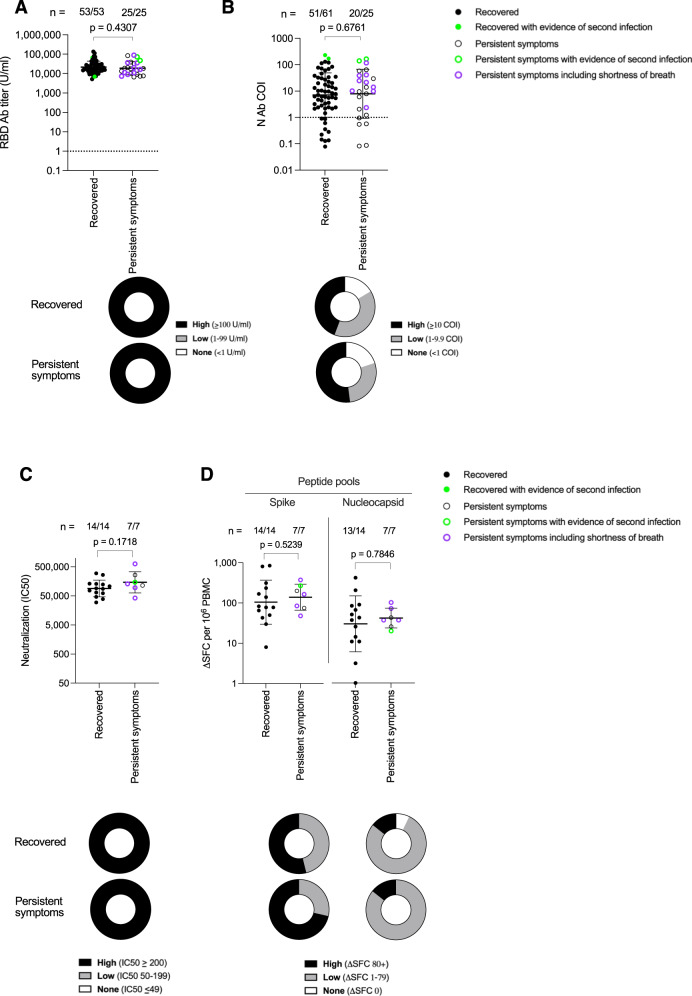
Among the unknowns in decoding the pathogenesis of SARS-CoV-2 persistent symptoms in Long Covid is whether there is a contributory role of abnormal immunity during acute infection. It has been proposed that Long Covid is a consequence of either an excessive or inadequate initial immune response. Here, we analyze SARS-CoV-2 humoral and cellular immunity in 86 healthcare workers with laboratory confirmed mild or asymptomatic SARS-CoV-2 infection during the first wave. Symptom questionnaires allow stratification into those with persistent symptoms and those without for comparison. During the period up to 18-weeks post-infection, we observe no difference in antibody responses to spike RBD or nucleoprotein, virus neutralization, or T cell responses. Also, there is no difference in the profile of antibody waning. Analysis at 1-year, after two vaccine doses, comparing those with persistent symptoms to those without, again shows similar SARS-CoV-2 immunity. Thus, quantitative differences in these measured parameters of SARS-CoV-2 adaptive immunity following mild or asymptomatic acute infection are unlikely to have contributed to Long Covid causality. ClinicalTrials.gov (NCT04318314).


Conflict of interest statement

R.J.B. and D.M.A. are members of the Global T cell Expert Consortium and have consulted for Oxford Immunotec outside the submitted work. DMA has received honorarium payments from Pfizer, AstraZeneca and Novavax for consultancy work. The remaining authors declare no competing interests.

Figures

Fig. 1
Fig. 1. Longitudinal antibody and T cell responses to SARS-CoV-2 during the first 16–18 weeks after infection in HCW that either recovered or reported persistent symptoms.
A cohort of health care workers (HCW) recruited in March 2020 with laboratory confirmed SARS-CoV-2 infection (n = 86, 33% male) were followed up weekly. Serum was assayed for A S1 RBD and B Nucleocapsid antibody titers. Twenty-five HCW reported persistent symptoms at 12 months post-infection (open circle, 28% male) whilst the remaining 61 HCW fully recovered (closed circle, 34% male). In both panels, peak antibody titer during the 24-week follow-up and longitudinal data is plotted for each HCW. C S1 RBD and nucleocapsid antibody titers plotted longitudinally relative to timing of positive SARS-CoV-2 PCR (Recovered, black, n = 15, 40% male; Persistent symptoms, red, n = 9, 44% male). Thirty-seven of Recovered HCW (closed circle, 30% male) and 21 of the HCW with persistent symptoms (open circle, 24% male) were assayed for D Neutralizing antibody (IC50) against SARS-CoV-2 ancestral (Wuhan Hu-1) strain pseudovirus at 16–18 weeks; E T cell response against spike and nucleocapsid recombinant proteins and F peptide pools containing mapped epitopes from spike, nucleocapsid, membrane and ORF3a/7a proteins. G T cell response against peptide pool containing epitopes from Cytomegalovirus, Epstein Barr virus and Influenza (Recovered, n = 34, closed circle, 29% male; Persistent symptoms, n = 19, open circle, 26% male). For AG, numbers of HCW showing a positive response for each assay are shown at the top of each plot and the proportion of each group with a high (black), low (grey) or no response (white) are represented by doughnut plots below. Longitudinal T cell responses to spike H and non-spike I peptide megapools assayed by ELISpot (in Recovered HCW, black circle, n = 14, 36% male; and HCW reporting Persistent symptoms, red circle, n = 8, 50% male) at 12 months after SARS-CoV-2 infection. Data is plotted relative to when HCW had a SARS-CoV-2 positive PCR. Two-tailed Mann-Whitney U tests (Graphpad Prism version 8.0) were used to test for significant differences between recovered HCW and those reporting persistent symptoms. Source data are provided as a Source Data file. Error bars shown are geometric mean ± 1 geometric SD. Ab antibody, COI cut-off index, N nucleocapsid, ORF open reading frame, PBMC peripheral blood mononuclear cells, RBD receptor binding domain, SD standard deviation, SFC spot forming cells, U units.
Fig. 2
Fig. 2. Antibody and T cell responses against SARS-CoV-2 at 12 months after laboratory confirmed infection in HCW that either Recovered or reported Persistent symptoms.
A S1 RBD (Recovered, closed circle, n = 53, 40% male); Persistent symptoms, open circle, n = 25, 28% male) and B Nucleocapsid antibody (Recovered, closed circle, n = 61, 34% male; Persistent symptoms, open circle, n = 25, 28% male) titers in HCW 12 months after laboratory confirmed SARS-CoV-2 infection. S1 RBD data is plotted for HCW who had received 2 doses of COVID-19 vaccine at the time of the 12-month blood sample. Numbers of HCW with a positive antibody titer are shown at the top of each plot. The proportion of HCW with a high (black), low (grey) or no antibody (white) titer is shown in doughnut plots below. Fifteen Recovered HCW (closed circle, 57% male) and 7 HCW with Persistent symptoms (open circle, 57% male) were assayed for C Neutralizing antibody IC50 against live ancestral (Wuhan Hu-1) SARS-CoV-2 virus and D T cell responses against spike and nucleocapsid mapped epitope peptide pools, 12 months after laboratory confirmed SARS-CoV-2 infection. Numbers of HCW showing a positive neutralizing antibody or T cell response for each assay are shown at the top of each plot. The proportion of HCW in each group with a high (black), low (grey) or no response (white) (as defined in each key) are represented by doughnut plots below. Two-tailed Mann-Whitney U test (Graphpad Prism version 8.0) was used to test for significant differences between Recovered HCW and those reporting Persistent symptoms. Source data are provided as a Source Data file. HCW with serological evidence of a subsequent SARS-CoV-2 re-infection between 6 and 12 months are annotated in green. HCW who reported persistent shortness of breath at 12 months are shown as purple open circles. Error bars shown are geometric mean + 1 geometric SD. Ab antibody, COI cut-off index, HCW health care workers, N nucleocapsid, PBMC peripheral blood mononuclear cells, RBD receptor binding domain, SD standard deviation, SFC spot forming cells, U units.

References

    1. https://www.ons.gov.uk/peoplepopulationandcommunity/healthandsocialcare/...
    1. Davis HE, et al. Characterizing long COVID in an international cohort: 7 months of symptoms and their impact. EClinicalMedicine. 2021;38:101019. doi: 10.1016/j.eclinm.2021.101019. - DOI - PMC - PubMed
    1. Subramanian A, et al. Symptoms and risk factors for long COVID in non-hospitalized adults. Nat. Med. 2022;28:1706–1714. doi: 10.1038/s41591-022-01909-w. - DOI - PMC - PubMed
    1. Munblit D, et al. A core outcome set for post-COVID-19 condition inadults for use in clinical practice and research: an international Delphi consensus study. Lancet Respir. Med. 2022;10:715–724. doi: 10.1016/S2213-2600(22)00169-2. - DOI - PMC - PubMed
    1. Antonelli M, et al. Risk of long COVID associated with delta versus omicron variants of SARS-CoV-2. Lancet. 2022;399:2263–2264. doi: 10.1016/S0140-6736(22)00941-2. - DOI - PMC - PubMed

Publication types

Substances

Associated data