. 2023 Aug 23;14(1):5116.
doi: 10.1038/s41467-023-40621-2.

An integrated proteome and transcriptome of B cell maturation defines poised activation states of transitional and mature B cells

Affiliations

An integrated proteome and transcriptome of B cell maturation defines poised activation states of transitional and mature B cells

Fiamma Salerno et al. Nat Commun. .

Abstract

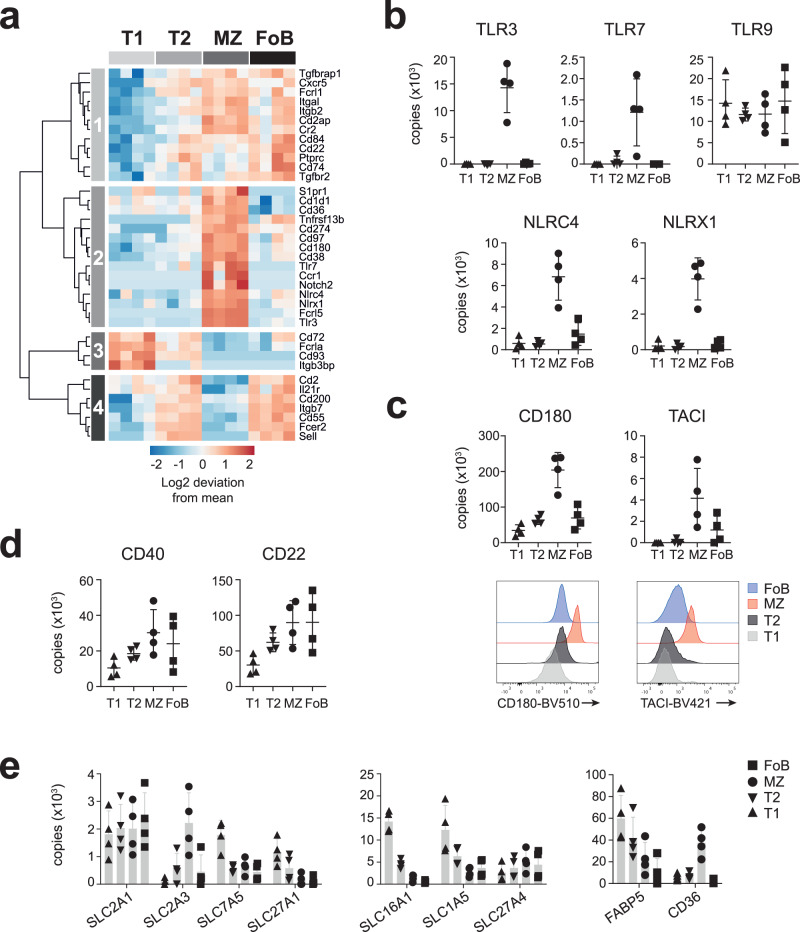
During B cell maturation, transitional and mature B cells acquire cell-intrinsic features that determine their ability to exit quiescence and mount effective immune responses. Here we use label-free proteomics to quantify the proteome of B cell subsets from the mouse spleen and map the differential expression of environmental sensing, transcription, and translation initiation factors that define cellular identity and function. Cross-examination of the full-length transcriptome and proteome identifies mRNAs related to B cell activation and antibody secretion that are not accompanied by detection of the encoded proteins. In addition, proteomic data further suggests that the translational repressor PDCD4 restrains B cell responses, in particular those from marginal zone B cells, to a T-cell independent antigen. In summary, our molecular characterization of B cell maturation presents a valuable resource to further explore the mechanisms underpinning the specialized functions of B cell subsets, and suggest the presence of 'poised' mRNAs that enable expedited B cell responses.


Conflict of interest statement

The authors declare no competing interests.

Figures

Fig. 1
Fig. 1. Differential expression of cellular protein signatures during peripheral B cell maturation.
a Representative flow cytometry plots identifying T1 (CD19+ CD93+ IgM+ CD23-), T2 (CD19+ CD93+ IgM+ CD23+), MZ (CD19+ CD93- CD21+ CD23-) and FoB (CD19+ CD93- CD21- CD23+) cells. Full gating strategy is reported in Supplementary Fig 9a. b Proportion of proteins that were unchanged or differentially expressed within T1, T2, MZ and FoB cells based on ANOVA test followed by a Benjamini-Hochberg multiple testing correction with FDR < 0.05. Numbers indicate proteins that were identified in at least three out of four biological replicates and by more than one unique peptide. The full list of proteins is provided in Supplementary Data 1a. c Heat map showing the log2-fold deviation from the mean of normalized copy numbers of 1816 DE proteins as in b. d Venn diagram indicates number of proteins that were found in one or more B cell subsets based on their copy numbers. Example of proteins that were exclusively found in T1 or MZ cells are reported on the left of the diagram. All proteins are listed in Supplementary Data 1b, c. In bd, B cells were sorted from n = 4 biologically independent replicates from two independent experiments. Source data of (c) are provided as Source Data file.
Fig. 2
Fig. 2. Expression profile of transcription factors defining B cell maturation stages.
a Heat map depicts the log2-fold deviation from the mean of normalized copy numbers of 57 transcription factors that were differentially expressed among T1, T2, MZ and FoB cells (FDR-adjusted p values < 0.05, calculated as in Fig. 1b). bf Graphs show copy numbers per cell of transcription factors that were selected based on their known relevance to immunity (n = 4 mice; mean ± SD). Source data are provided as Source Data file.
Fig. 3
Fig. 3. Receptors involved in environmental-sensing and nutrient transport in B cells.
a Heat map shows the log2-fold deviation from the mean of normalized copy numbers of 38 receptors that were differentially expressed among T1, T2, MZ and FoB cells (FDR-adjusted p values < 0.05, calculated as in Fig. 1b). The list of receptors was manually curated and includes CD molecules; toll-like receptors; NOD-like receptors; Fc receptors; complement receptors; TNF receptor superfamily; receptors for cytokines such as interleukins, interferons, TGF-β; chemotactic receptors belonging to the CCR, CXCR or sphingosine-1-phosphate families; adhesion molecules; ADAM metalloproteinases and Notch receptors. bd Graphs display copy numbers per cell of receptors selected based on their biological function. In c, histograms represent CD180 and TACI expression as detected by flow cytometry. e, Copy numbers of the major glucose-, lactate- and amino acid-transporters and selected fatty acid transporters (n = 4 mice; mean ± SD). Source data are provided as Source Data file.
Fig. 4
Fig. 4. Integration of mRNA and protein abundance during B cell development.
ac Scatter plots show the average mRNA abundance (in transcripts per million - TPM) and the average protein abundance (in copy numbers) of T1, T2, MZ and FoB cells. Expression and trend line of the whole dataset encompassing 7303 genes is reported in each graph (grey dots and line). Black dots indicate expression of 113 TOP-mRNAs (a), 265 transcription factors (b), and 74 sensory and chemotactic receptors (c). Red points highlight specific genes of interest within those categories. A list of TOP-mRNAs was extracted from refs. ,; transcription factors were annotated from Gene Ontology term 0003700; a list of receptors was manually curated as in Fig. 3. d mRNA and protein abundance of Tnfrsf13b/TACI and NOTCH2 in B cell subsets (n = 4 mice; mean ± SD). The full list of TPMs and copy numbers is provided in Supplementary Data 2. Source data of (d) are provided as Source Data file.
Fig. 5
Fig. 5. B cells express early activation genes in a poised state.
a, d, g mRNA abundance in TPM of selected early activation genes as measured by Illumina sequencing (n = 4 mice; mean ± SD). Genome browser view displays individual long-reads from ONT sequencing of Cd69 (chr6: 129,266,982-129,275,447) (b), Nr4a1 (chr15:101,254,093-101,275,115) (e), Myc (chr15: 61,983,341-61,992,361) (h), visualized with the Integrative Genomics Viewer. RefSeq GRCm38 annotation (blue), coverage of (dark grey) and aligned long-reads (light grey) were reported for each gene. Lines connecting light grey boxes indicate splicing junctions between aligned sequences. In squared brackets the maximum read coverage for each B cell population. c, f, i Black symbols show protein detection of indicated genes within our proteomic dataset. Grey boxes represent protein copy numbers (mean ± SD) for the 100 protein-coding genes with closest RNA expression (log2 TPM) to the indicated gene. The centre and bounds of the boxes represent the median and interquartile range, respectively. The upper and lower whiskers extend to the maximum and minimum values, respectively, or, in cases where outliers are displayed, to the 75th/25th percentile +/− 1.5x interquartile range. Source data are provided as Source Data file.
Fig. 6
Fig. 6. B cells express PB-related genes in a poised state.
a, d, g mRNA abundance in TPM of selected PB-related genes as measured by Illumina sequencing (n = 4 mice; mean ± SD). Genome browser view displays individual long-reads from ONT sequencing of Xbp1 (chr11: 5,520,014-5,526,248) (b), Aft4 (chr15: 80,255,164-80,257,565) (e), Atf6 (chr1:170,703,549-170,870,441) (h), visualized with the Integrative Genomics Viewer. RefSeq GRCm38 annotation (blue), coverage of (dark grey) and aligned long-reads (light grey) were reported for each gene. Lines connecting light grey boxes indicate splicing junctions between aligned sequences. In squared brackets the maximum read coverage for each B cell population. c, f, i Black symbols show protein detection of indicated genes within our proteomic dataset. Grey boxes represent protein copy numbers (mean ± SD) for the 100 protein-coding genes with closest RNA expression (log2 TPM) to the indicated gene. The centre and bounds of the boxes represent the median and interquartile range, respectively. The upper and lower whiskers extend to the maximum and minimum values, respectively, or, in cases where outliers are displayed, to the 75th/25th percentile +/− 1.5x interquartile range. Source data are provided as Source Data file.
Fig. 7
Fig. 7. Regulators of mRNA translation in B cells.
a Total content of ribosomal proteins was calculated as sum of CN x MW / NA, where CN is protein copy number, MW is protein molecular weight, and NA is Avogadro’s constant. Graph depicts ribosomal proteins as a proportion to total protein content in T1, T2, MZ and FoB cells. b, c Graphs display copy numbers of key components of the eIF4F mRNA translation initiation complex (eIF4A1, eIF4B, eIF4E, eIF4G1). Overlay histogram represents flow cytometric detection of eIF4A1 in MZ and FoB cells. d PDCD4 protein amounts detected by mass spectrometry (left) or flow cytometry (right). e Ratio between EIF4A1 and PDCD4 copy numbers was calculated in each B cell subset. Graphs display mean ± SD (n = 4 mice). Source data are provided as Source Data file.
Fig. 8
Fig. 8. PDCD4 restrains MZ B cell responses to NP-Ficoll immunization.
Reconstitution of WT (filled circles) and PDCD4 KO (open squares) μMT chimeras (a) or competitive chimeras (b) was analysed in blood samples 8-9 weeks after BM transfer. Contour plots represent detection of transferred CD45.2+ cells by flow cytometry. Graphs display numbers of CD45.2+ CD19+ B220+ B cells. c Chimeric mice were immunized i.v. with NP-Ficoll and analysed after 7 days. Contour plots and graphs depict percentage of CD138+ TACI+ CD19int/low IgD- CD45.2+ PBs of μMT chimeras (top) or competitive chimeras (bottom). Full gating strategy is reported in Supplementary Fig 9b–c. ac n = 14–15 mice for μMT chimeras; n = 8 mice for competitive chimeras. d ELISpot-analysis of splenic NP20-IgM (left) and NP20-IgG3 (right) antibody-secreting cells (ASC) 7 days after NP-Ficoll immunization of μMT chimeric mice (n = 9–10 mice per group). Unimmunized WT μMT chimeric mice were used as a control (n = 3 mice). ASC numbers were calculated as proportion of 106 MZ B cells. e Endpoint titers of NP20-IgM (left) and NP20-IgG3 (right) were measured in serum of μMT chimeric mice before (d-1) and after (d4, d7) NP-Ficoll immunization (n = 9–10 mice per group). ae Graphs display data pooled from at least two independently performed experiments (mean ± SD). Two-tailed unpaired Student’s t-test analysis was performed between WT and PDCD4 KO samples. f Puromycin incorporation 30 min following administration to μMT chimeras (top) or competitive chimeras (bottom) 9 weeks after BM transfer. Overlay histograms indicate puromycin incorporation of WT (light grey) and PDCD4 KO (dark grey) MZ B cells. g Volcano plot of proteins quantified by mass spectrometry from FACS-sorted MZ B cells that were derived from WT or PDCD4 KO competitive chimeras. Vertical dashed lines indicate fold changes of 0.5. Horizontal dashed lines indicate p values of 0.05, which were calculated using a two-tailed t-test with unequal variance (n = 3 mice per group from two independently performed BM chimeras). Source data are provided as Source Data file.

References

    1. Allman D, et al. Resolution of three nonproliferative immature splenic B cell subsets reveals multiple selection points during peripheral B cell maturation. J. Immunol. 2001;167:6834–6840. - PubMed
    1. Metzler G, Kolhatkar NS, Rawlings DJ. BCR and co-receptor crosstalk facilitate the positive selection of self-reactive transitional B cells. Curr. Opin. Immunol. 2015;37:46–53. - PMC - PubMed
    1. Allman D, Pillai S. Peripheral B cell subsets. Curr. Opin. Immunol. 2008;20:149–157. - PMC - PubMed
    1. Wen L, et al. Evidence of marginal-zone B cell-positive selection in spleen. Immunity. 2005;23:297–308. - PubMed
    1. Merrell KT, et al. Identification of anergic B cells within a wild-type repertoire. Immunity. 2006;25:953–962. - PubMed

Publication types