. 2023 Aug 23;13(1):13739.
doi: 10.1038/s41598-023-40124-6.

XRF analysis searching for fingerprint elemental profile in south-eastern Sicily tomatoes

Affiliations

XRF analysis searching for fingerprint elemental profile in south-eastern Sicily tomatoes

Salvina Panebianco et al. Sci Rep. .

Abstract

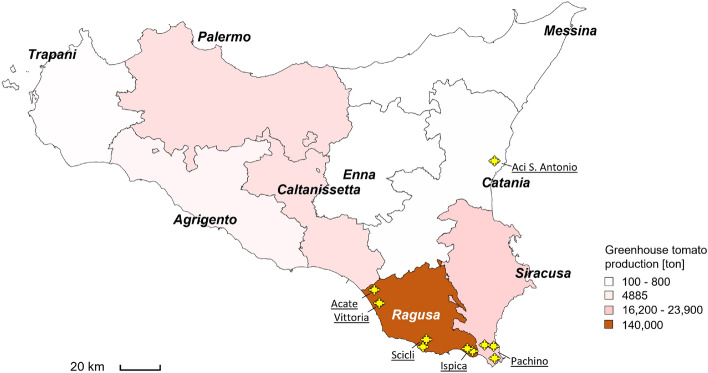
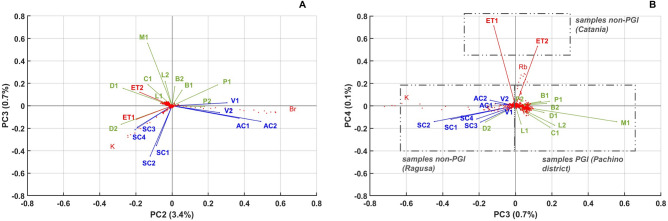
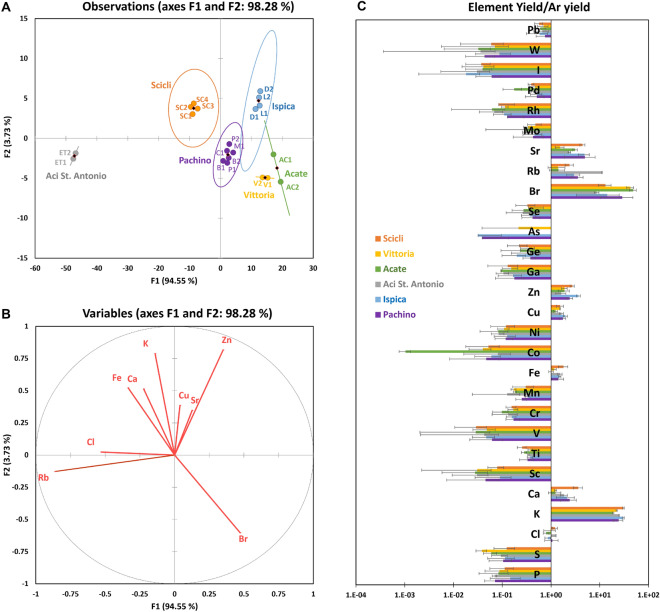
The implementation of analytical techniques able to certify food quality and origin in a fast and non-destructive way is becoming a widespread need in the agri-food sector. Among the physical non-destructive techniques, X-ray fluorescence (XRF) spectrometry is often used to analyze the elemental composition of biological samples. In this study, X-ray fluorescence (XRF) elemental profiles were measured on tomato samples belonging to different geographical areas in Sicily (Italy). The purpose of this investigation was aiming to establish a protocol for in-situ measurement and analysis able to provide quality assessment and traceability of PGI agri-food products, specifically sustaining health safety and self qualifying bio-chemical signature. In detail, sampling was performed in one of the most tomato productive area of south-eastern Sicily (Pachino district), characterised by a relative higher amount of Organic Carbon and Cation Exchange Capacity, and compared with samples from other growing areas of Sicily, falling in Ragusa province and Mt. Etna region. Experimental data were analyzed in the framework of multivariate analysis by using principal component analysis and further validated by discriminant analysis. The results show the presence of specific elemental signatures associated to several characterizing elements. This methodology establishes the possibility to disentangle a clear fingerprint pattern associated to the geographical origin of an agri-food product.


Conflict of interest statement

The authors declare no competing interests.

Figures

Figure 1
Figure 1
Tomato greenhouse production distribution within Sicily in 2022 (production distribution in 2021 is reported in). Province of Ragusa has the highest tomato production rate. Yellow stars indicate the sampled sites of the present study. The figure has been created by using Microsoft Excel Bing Maps, Bing ©, GeoNames, Tom Tom (https://www.geonames.org).
Figure 2
Figure 2
XRF spectra associated to the “pulp” and the “pulp + skin” of D1 sample. The spectra referred to the “D1—pulp” sample, obtained by configuring the Bruker spectrometer with Cu/Ti/Al (0.006” Cu, 0.001” Ti, 0.012” Al) and Ti/Al (0.001” Ti, 0.012” Al) filters, are plotted in (A) and (B), whereas XRF spectrum associated to “D1—pulp + skin” sample, measured with Ti/Al filter, is plotted in (C). In (A), (B) and (C), the raw spectra are reported in black, data global fit and background evaluation in red and green, respectively. In (D) the comparison of XRF spectra after background subtraction for the “pulp” of D1 sample obtained by using Ti/Al/Cu and Ti/Al filters (blue and red line, respectively) is shown; in the same plot, net XRF spectrum for the “pulp + skin” of D1 sample measured with Ti/Al filters is reported as a green line. Finally, plot (E) reports the extracted element yield distributions concerning the three experimental configurations M1, M2 and M3. Statistical error bars are included.
Figure 3
Figure 3
Comparisons of PC3 versus PC2 biplots obtained by analyzing “original spectra” with background (A), “net spectra” without background (B) and “element yields” (C) of “pulp” samples irradiated by an X-ray beam reduced by using Ti/Al/Cu filter (plots in the left side), Ti/Al filter (plots in the center) and of “pulp +skin” samples and Ti/Al filter (plots in the right side). Samples were obtained by PGI-tomatoes coming from the Pachino district (Pachino and Ispica municipalities). The variables, represented trough vectors, are the tomato samples collected from Pachino (samples A1, A2, A3, A4, P1, P2 from farm 1; B1, B2 from farm 2; C1, M1 from farm 3) and Ispica (D1, D2 from farm 4; L1, L2 from farm 5) (for details see Table 1).
Figure 4
Figure 4
PCA carried out on “pulp + skin” samples obtained from tomatoes with PGI and non-PGI certification (in A, biplot PC3 vs PC2; in B, biplot PC4 vs. PC3). The biplots were obtained by the raw spectra data-sets, made excluding A1–A4 samples (outliers). The variables (vectors symbolizing tomato samples coming from PGI- and non-PGI sites) were distinguished by using different colours (in green, PGI samples from Pachino district; in blue, non-PGI samples from Ragusa; in red, non-PGI samples from Aci St. Antonio).
Figure 5
Figure 5
On the left, DA plots obtained by using nine variables including the elements with larger yield (element to Argon ratio larger than one): observations are plot in (A) and variables are plot in (B). In (C), averaged element yields detected in the “pulp + skin” samples obtained from tomatoes with PGI and non-PGI certification harvested in Pachino (P1, P2, B1, B2, C1, M1), Ispica (D1, D2, L1 and L2), Scicli (SC1, SC2, SC3 and SC4), Vittoria (V1, V2), Acate (AC1, AC2) and Aci St. Antonio (ET1, ET2). Yields have been normalized to Argon yield for each region before being averaged. In correspondence of each element, bars show the standard deviations.
Figure 6
Figure 6
Bubble maps extracted from LUCAS database for Sicily concerning the values of CaCO3 (g/kg), CO (g/kg), CEC (cmol(+)/kg), pH in H2O, N (g/kg) and K (g/kg) in soils. Maps have been created by using the software GPS Visualizer (https://www.gpsvisualizer.com). Map data were obtained from OpenStreetMap (https://www.openstreetmap.org).
Figure 7
Figure 7
On the left, sampling sites (yellow stars) are overlapped on the pedological map from; on the right, PCA results obtained from the full sample-set measurements (already shown in Fig. 4). In the biplot, the samples are plotted with the same color code used to indicate the pedological zones of provenance: fuchsia for ET1, ET2 samples (zone n. 32 in the map); red for SC1, SC2, SC3, SC4, D1, D2, L1, L2, M1, C1 samples (zone n. 40); orange for B1, B2, P1, P2 samples (zone n. 41); beige for AC1, AC2, V1, V2 samples (zone n. 44). Map reproduces, with appropriate modifications, the Soil Map of Italy reported in.

References

    1. Barchitta M, et al. Integrated approach of nutritional and molecular epidemiology, mineralogical and chemical pollutant characterization: The protocol of a cross-sectional study in women. BMJ Open. 2017;7:e014756. doi: 10.1136/bmjopen-2016-014756. - DOI - PMC - PubMed
    1. Natesh H, Abbey L, Asiedu SK. An overview of nutritional and antinutritional factors in green leafy vegetables. Hortic. Int. J. 2017;1(2):00011. doi: 10.15406/hij.2017.01.00011. - DOI
    1. Gallardo H, et al. Possibilities of low-power X-ray fluorescence spectrometry methods for rapid multielemental analysis and imaging of vegetal foodstuffs. J. Food Compos. Anal. 2016;50:1–9. doi: 10.1016/j.jfca.2016.04.007. - DOI
    1. Panebianco S, et al. Feasibility study of tomato fruit characterization by fast XRF analysis for quality assessment and food traceability. Food Chem. 2022;383:132364. doi: 10.1016/j.foodchem.2022.132364. - DOI - PubMed
    1. Melquiades FL, Bortoleto GG, Marchiori LFS, Bueno MIMS. Direct determination of sugar cane quality parameters by X-ray spectrometry and multivariate analysis. J. Agric. Food Chem. 2012;60(43):10755–10761. doi: 10.1021/jf302471b. - DOI - PubMed

Publication types