. 2023 Aug;620(7976):1018-1024.
doi: 10.1038/s41586-023-06442-5. Epub 2023 Aug 23.

Reef-building corals farm and feed on their photosynthetic symbionts

Affiliations

Reef-building corals farm and feed on their photosynthetic symbionts

Jörg Wiedenmann et al. Nature. 2023 Aug.

Erratum in

Abstract

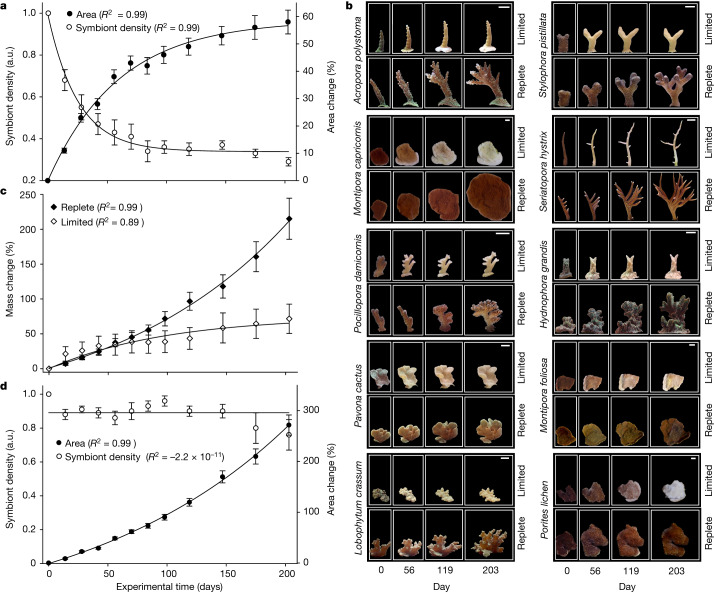
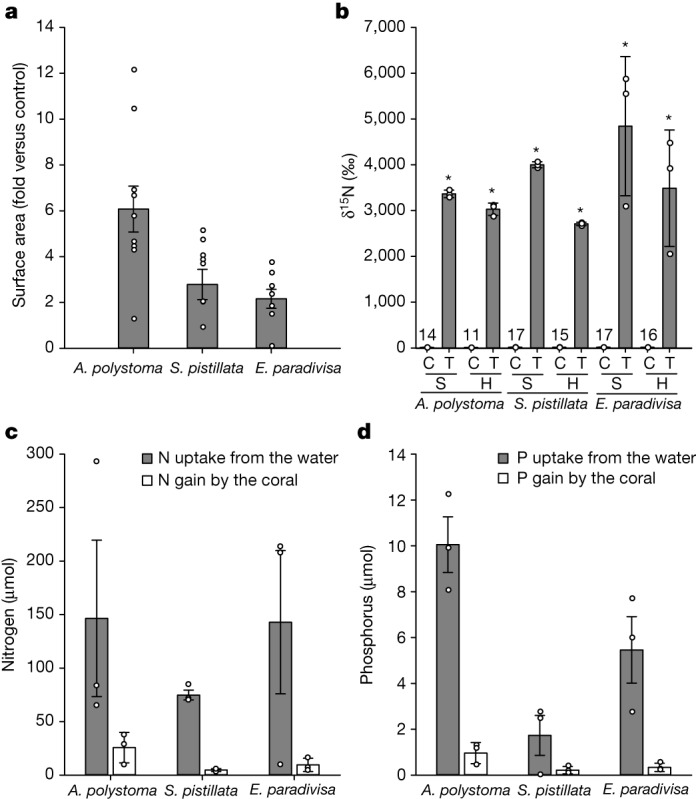
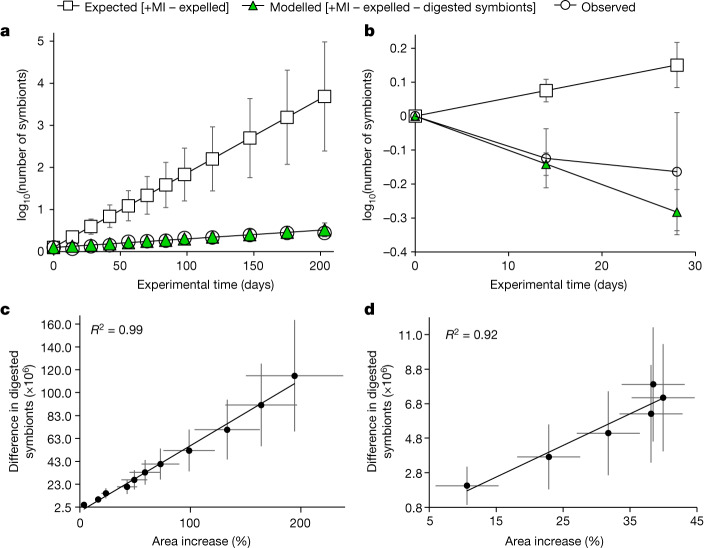
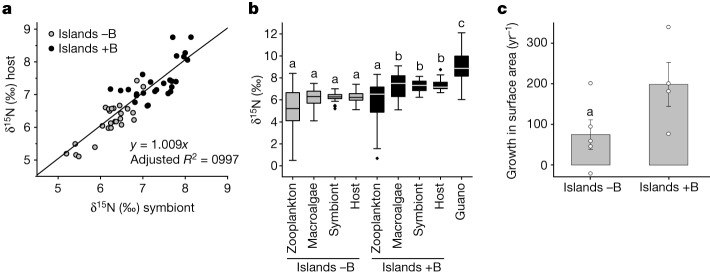
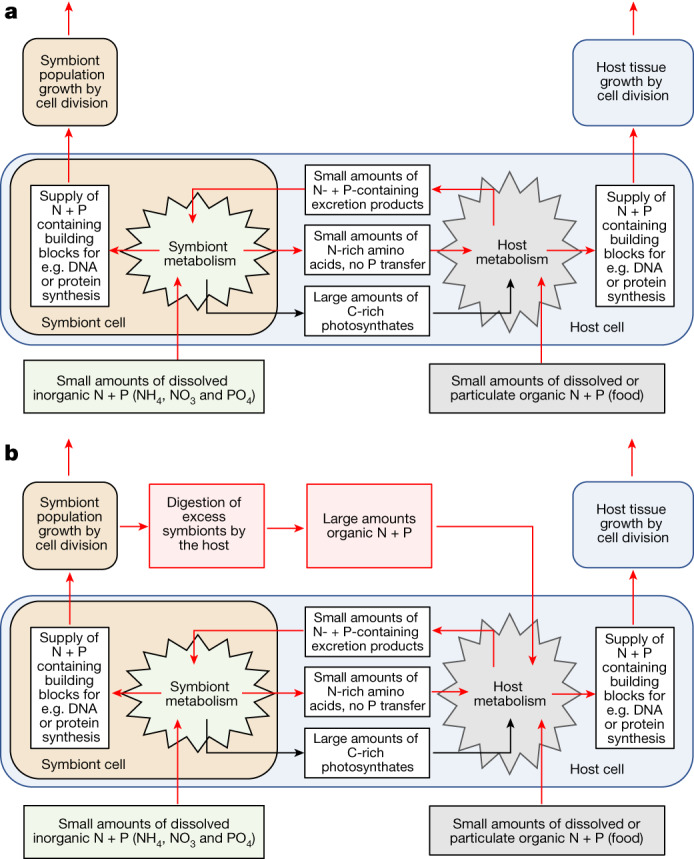
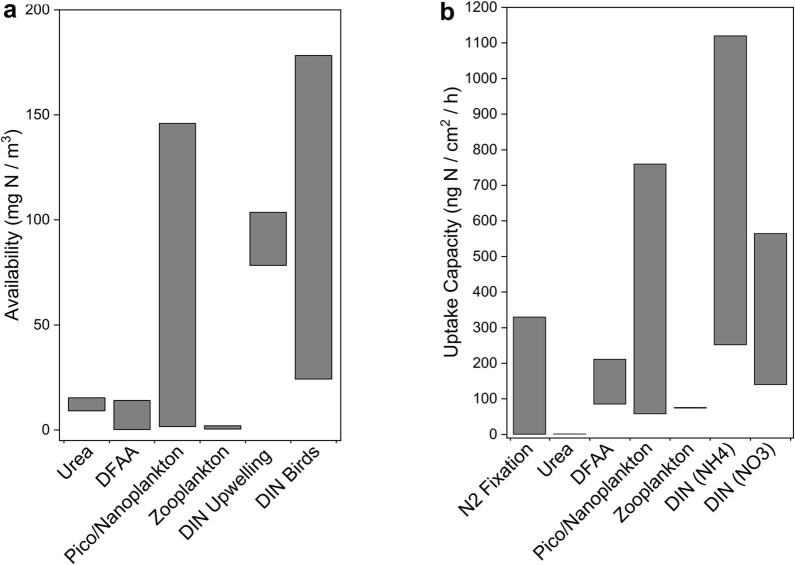
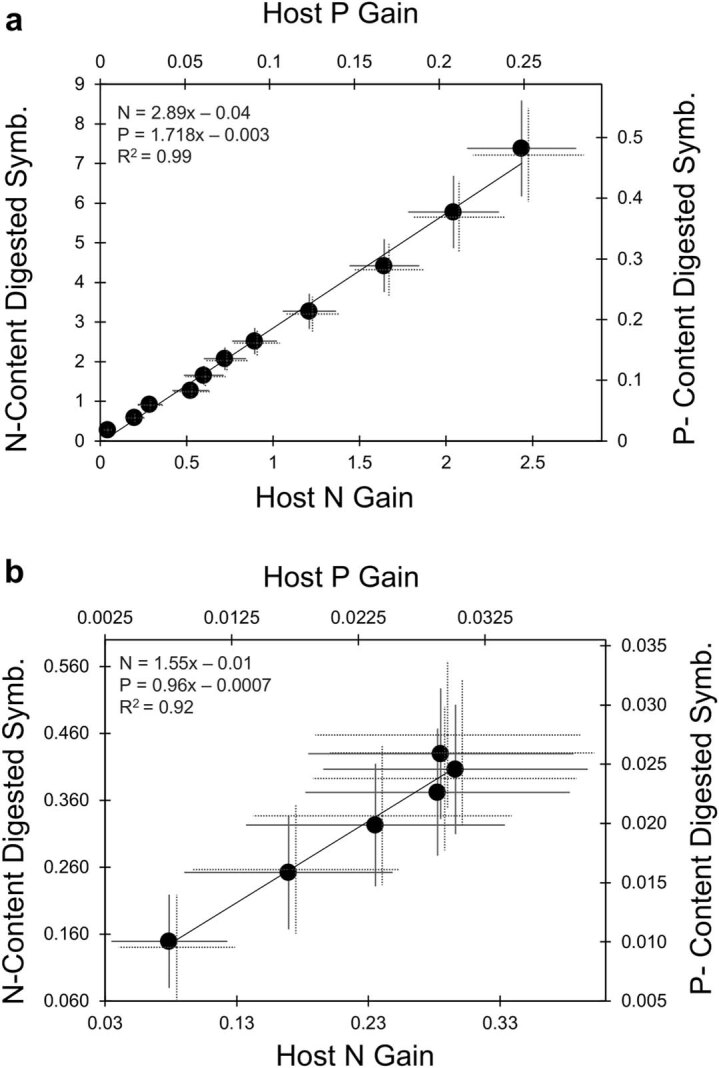
Coral reefs are highly diverse ecosystems that thrive in nutrient-poor waters, a phenomenon frequently referred to as the Darwin paradox1. The energy demand of coral animal hosts can often be fully met by the excess production of carbon-rich photosynthates by their algal symbionts2,3. However, the understanding of mechanisms that enable corals to acquire the vital nutrients nitrogen and phosphorus from their symbionts is incomplete4-9. Here we show, through a series of long-term experiments, that the uptake of dissolved inorganic nitrogen and phosphorus by the symbionts alone is sufficient to sustain rapid coral growth. Next, considering the nitrogen and phosphorus budgets of host and symbionts, we identify that these nutrients are gathered through symbiont 'farming' and are translocated to the host by digestion of excess symbiont cells. Finally, we use a large-scale natural experiment in which seabirds fertilize some reefs but not others, to show that the efficient utilization of dissolved inorganic nutrients by symbiotic corals established in our laboratory experiments has the potential to enhance coral growth in the wild at the ecosystem level. Feeding on symbionts enables coral animals to tap into an important nutrient pool and helps to explain the evolutionary and ecological success of symbiotic corals in nutrient-limited waters.


Conflict of interest statement

The authors declare no competing interests.

Figures

Fig. 1
Fig. 1. Time course of coral growth and calcification over 203 days in nutrient-replete and nutrient-limited conditions in the absence of particulate food.
a, Changes in coral surface area and symbiont density in nutrient-limited conditions. a.u., arbitrary units. b, Representative replicate samples of each experimental coral species showing visual changes in coral area and symbiont density-dependent colour over time in nutrient-limited (top) and nutrient-replete (bottom) conditions. Scale bars, 1 cm. c, Changes in coral mass in nutrient-limited and nutrient-replete conditions. Mass changes of scleractinian coral species are driven mostly by the growth of the calcaraeous skeletons. d, Changes in coral surface area and symbiont density in nutrient-replete conditions. Data are presented as mean ± s.e.m. for n = 10 different coral species for each of the 2 experimental conditions (6–10 replicate colonies were analysed for each species). Data points are fitted with exponential decrease, increase or saturation functions. R2 values indicating quality of fits are shown. Horizontal linear fit through sample mean describes symbiont density over time. Source data
Fig. 2
Fig. 2. Uptake and assimilation of dissolved inorganic N and P.
a, Increase in coral surface area in response to defined pulses with 15NO3 and PO4 relative to untreated controls. n is the number of independent individuals per species for treatments (T) and controls (C). A. polystoma: nt = 10, nc = 10; S. pistillata: nt = 9, nc = 8; E. paradivisa: nt = 7, nc = 7. b, δ15N (‰) of host tissue (H) and symbionts (S) in response to treatment with defined 15NO3 pulses compared with untreated controls. Numbers above control bars indicate the δ15N (‰) values. Data are mean ± s.d. of replicate samples for each species (n = 3 independent host tissue or symbiont samples from independent individuals for all species, except n = 2 for E. paradivisa control). Asterisks indicate statistically significant differences between treatment and control (n = 3 independent biological species per symbiont community); t-test pairwise comparisons, two-tailed PH = 0.0002, PS = 0.0007. c,d, The amount of N and P taken up from the water and the N and P gain of host tissue and symbionts over 217 days. Data are mean normalized to the coral surface area. Error bars represent the s.e.m. of N and P uptake from the water from n = 3 independent measurements on three different days and of N and P gain by the coral from n = 3 independent tissue samples from different individuals. Source data
Fig. 3
Fig. 3. Changes in symbiont numbers in response to the availability of dissolved inorganic nutrients.
a, Expected expansion of the symbiont population in corals cultured in nutrient-replete conditions based on cell division (mitotic index (+MI)) and expulsion rates over 203 days, the observed increase in symbiont numbers and a model reproducing the observed increases in numbers based on the continuous removal of symbionts by the host. b, Expected increase, and observed and modelled decrease in symbiont numbers in corals cultured under nutrient-limited conditions. c,d, Correlation between the number of missing symbionts and the growth of corals measured as area increase under nutrient-replete conditions over 203 days (c) and nutrient-limited conditions over 84 days (d). ad, Points represent normalized average ± s.e.m. for four coral species (A. polystoma, S. pistillata, M. capricornis and M. foliosa). The average for each species represents 6–10 colonies. R2 values are shown. Correlation between variables of each fit in c,d are significant (P < 0.0001). Source data
Fig. 4
Fig. 4. Assimilation of 15N-enriched nitrogen by Acropora sp. in reefs adjacent to islands with dense seabird populations in the Chagos Archipelago compared to islands with low numbers of seabirds.
a, δ15N for host tissue and associated symbionts from islands with high (+B) or low (−B) densities of seabirds. The equation of the linear fit and adjusted R2 are shown. b, δ15N of biologically independent samples from islands with high or low densities of seabirds for coral host (n+B = 27, n−B = 25), symbionts (n+B = 27, n−B = 25), their nitrogen sources (zooplankton (n+B = 18, n−B = 17) and bird guano (n = 22)). Macroalgae (n+B = 55, n−B = 45) from the same reefs are included for comparison. In box plots, the centre line shows the median, the box encompasses 25th and 75th percentiles, and whiskers extend to minimum and maximum values of the dataset. The filled circles display outliers. Significant differences (indicated by different letters) between samples were determined by one-way ANOVA (P < 0.001) followed by pairwise multiple comparison (Holm–Sidak method, < 0.05). The number of biologically independent samples (in the range of n = 17–55) are provided in Methods. c, Growth of Acropora sp. colonies measured as expansion of surface area per year. Data are mean ± s.e.m., a indicates a significant difference between the datasets (t-test pairwise comparison, two-tailed P = 0.04). Samples represent independent islands (n+B = 4; n–B = 5) across three atolls in the Chagos Archipelago. Source data
Fig. 5
Fig. 5. Schematic depiction of N and P uptake, partitioning and recycling mechanisms within the coral–dinoflagellate symbiosis.
a, In the traditional view, large amounts of C along with modest amounts of N and essentially no P are released from the symbionts. Accordingly, the uptake and assimilation of dissolved inorganic N and P by the symbiont provides limited benefits to the host. The host relies largely on heterotrophic uptake of the essential N and P to obtain the building blocks for its growth. b, Based on our findings, the host can gain full access to the pool of dissolved inorganic nutrients, that would otherwise not be accessible to coral animals, by acquiring N and P through feeding on symbionts. If sufficiently large amounts of dissolved inorganic N and P are available to the symbiont, the host can sustain its growth and metabolic demands exclusively through symbiont farming and digestion. In nutrient-limited conditions, the symbiotic association can exploit both major pools of nutrients, dissolved inorganic forms of N and P as well as dissolved and particulate organic forms of N and P. In well-lit, clear, warm and nutrient-poor waters, the ability of the coral to reciprocally transfer these vital N and P compounds between the partners of the symbiotic association gains them an evolutionary and ecological advantage over plants or animals that are limited to accessing one or the other nutrient pool.
Extended Data Fig. 1
Extended Data Fig. 1. Environmental nitrogen supply to symbiotic corals.
(a) Examples of the availability of N in different chemical forms in reef waters that can be taken up by symbiotic corals. (b) Capacity of symbiotic coral to take up nitrogen in different chemical forms including dissolved free amino acids (DFAA). Bars represent the range of nitrogen availability and uptake capacity defined by the upper and lower boundary values deduced from the published literature. Relevant references and unit transformation measures are summarised in Extended Data Tables 1 and 2. Dissolved inorganic N (DIN) values provided in (a) are for (i) upwelling areas in which coral dominance is increased by 44% compared to comparable habitats with less exposure to internal wave driven upwelling and for (ii) reef waters in which the nutrient provision by seabirds results in elevated DIN values (up to >90% nitrate) and 3-fold increase growth Acropora formosa.
Extended Data Fig. 2
Extended Data Fig. 2. Correlation of the N and P content of the digested symbiont fraction with the N and P content gained by the host during growth over 203 days in the nutrient replete (a) and nutrient limited (b) conditions.
Data points represent means ± standard error (solid line error bars: changes in N, dotted line error bars: P). n = 4 independent species: A. polystoma, S. pistillata, M. capricornis, M. foliosa. 6–10 colonies were analysed per species. Equations of linear fits and R2 are given in the chart. Correlations between variables of each fit are significant with p < 0.0001.

Comment in

References

    1. Rougerie, F. in The French-Speaking Pacific: Population, Environment and Eevelopment Issues (ed. Jost, C.) 163–171 (Boombana, 1998).
    1. Falkowski, P. G., Dubinsky, Z., Muscatine, L. & Porter, J. W. Light and the bioenergetics of a symbiotic coral. Bioscience34, 705–709 (1984).
    1. Muscatine, L., Falkowski, P., Porter, J. & Dubinsky, Z. Fate of photosynthetic fixed carbon in light-and shade-adapted colonies of the symbiotic coral Stylophora pistillata. Proc. R. Soc. Lond. B222, 181–202 (1984).
    1. Godinot, C., Ferrier-Pagès, C. & Grover, R. Control of phosphate uptake by zooxanthellae and host cells in the scleractinian coral Stylophora pistillata. Limnol. Oceanogr.54, 1627–1633 (2009).
    1. Sutton, D. & Hoegh-Guldberg, O. Host–zooxanthella interactions in four temperate marine invertebrate symbioses: assessment of effect of host extracts on symbionts. Biol. Bull.178, 175–186 (1990). - PubMed

Publication types