. 2023 Aug;620(7976):1101-1108.
doi: 10.1038/s41586-023-06441-6. Epub 2023 Aug 23.

Structural mechanism of mitochondrial membrane remodelling by human OPA1

Affiliations

Structural mechanism of mitochondrial membrane remodelling by human OPA1

Alexander von der Malsburg et al. Nature. 2023 Aug.

Abstract

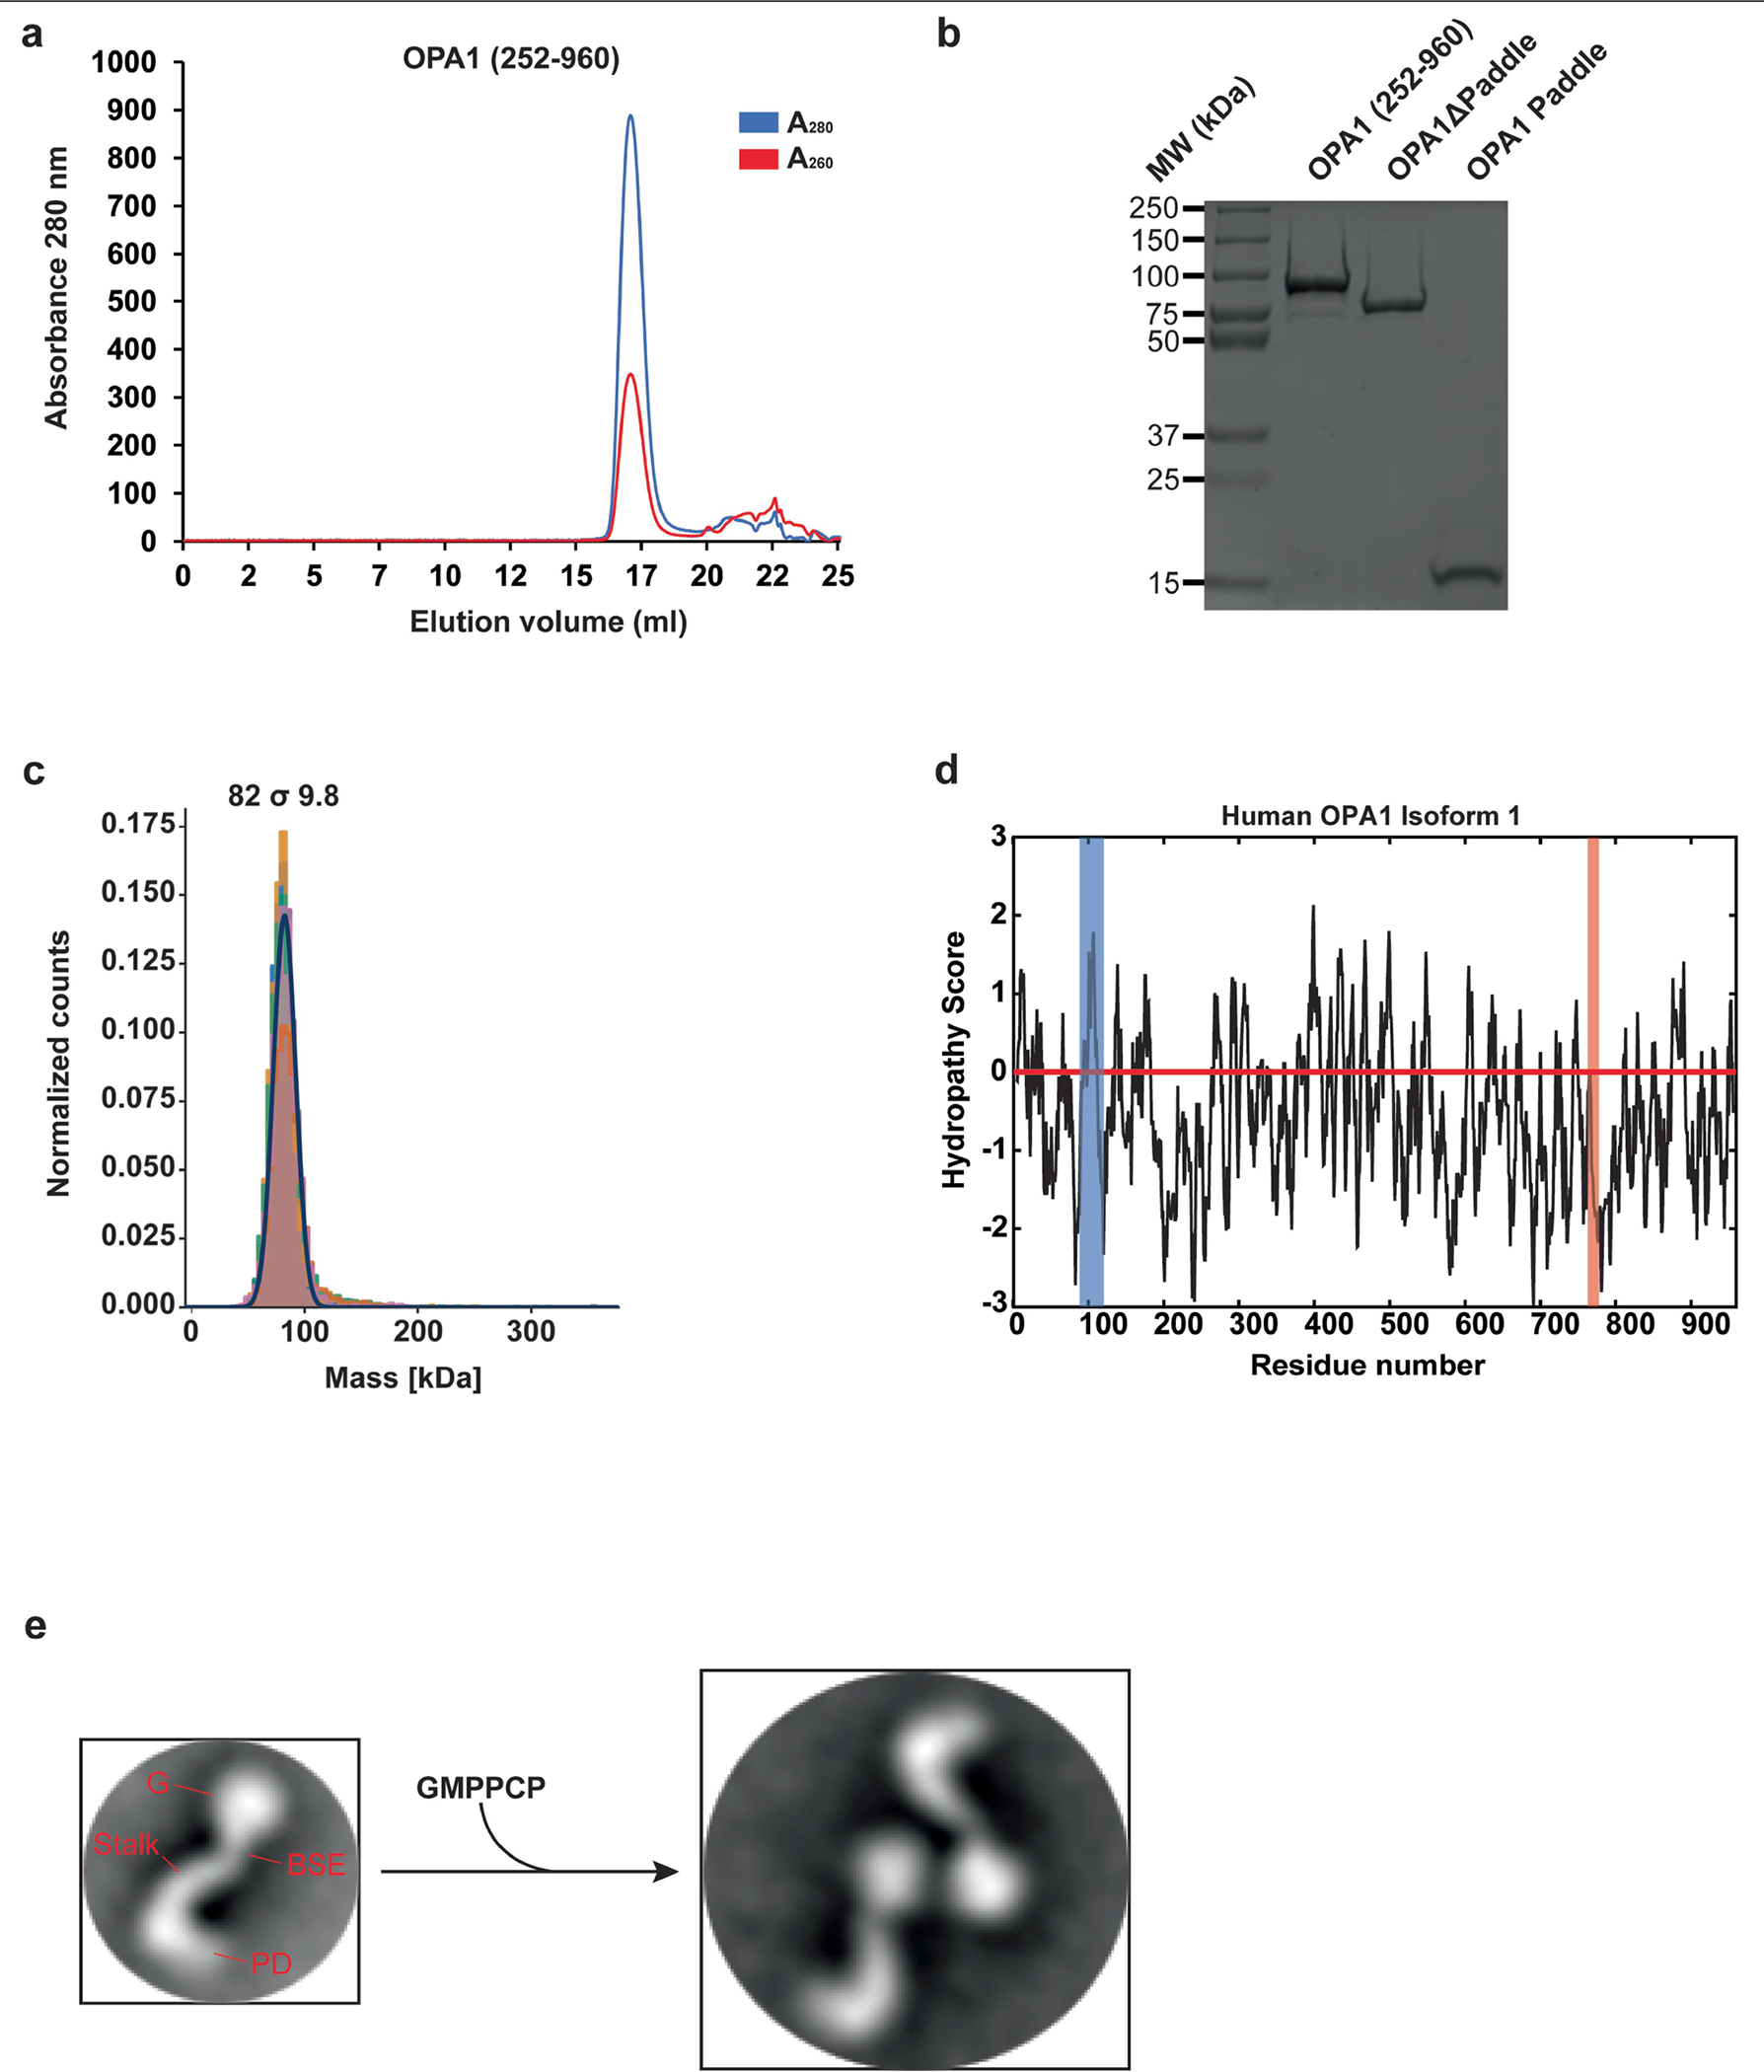
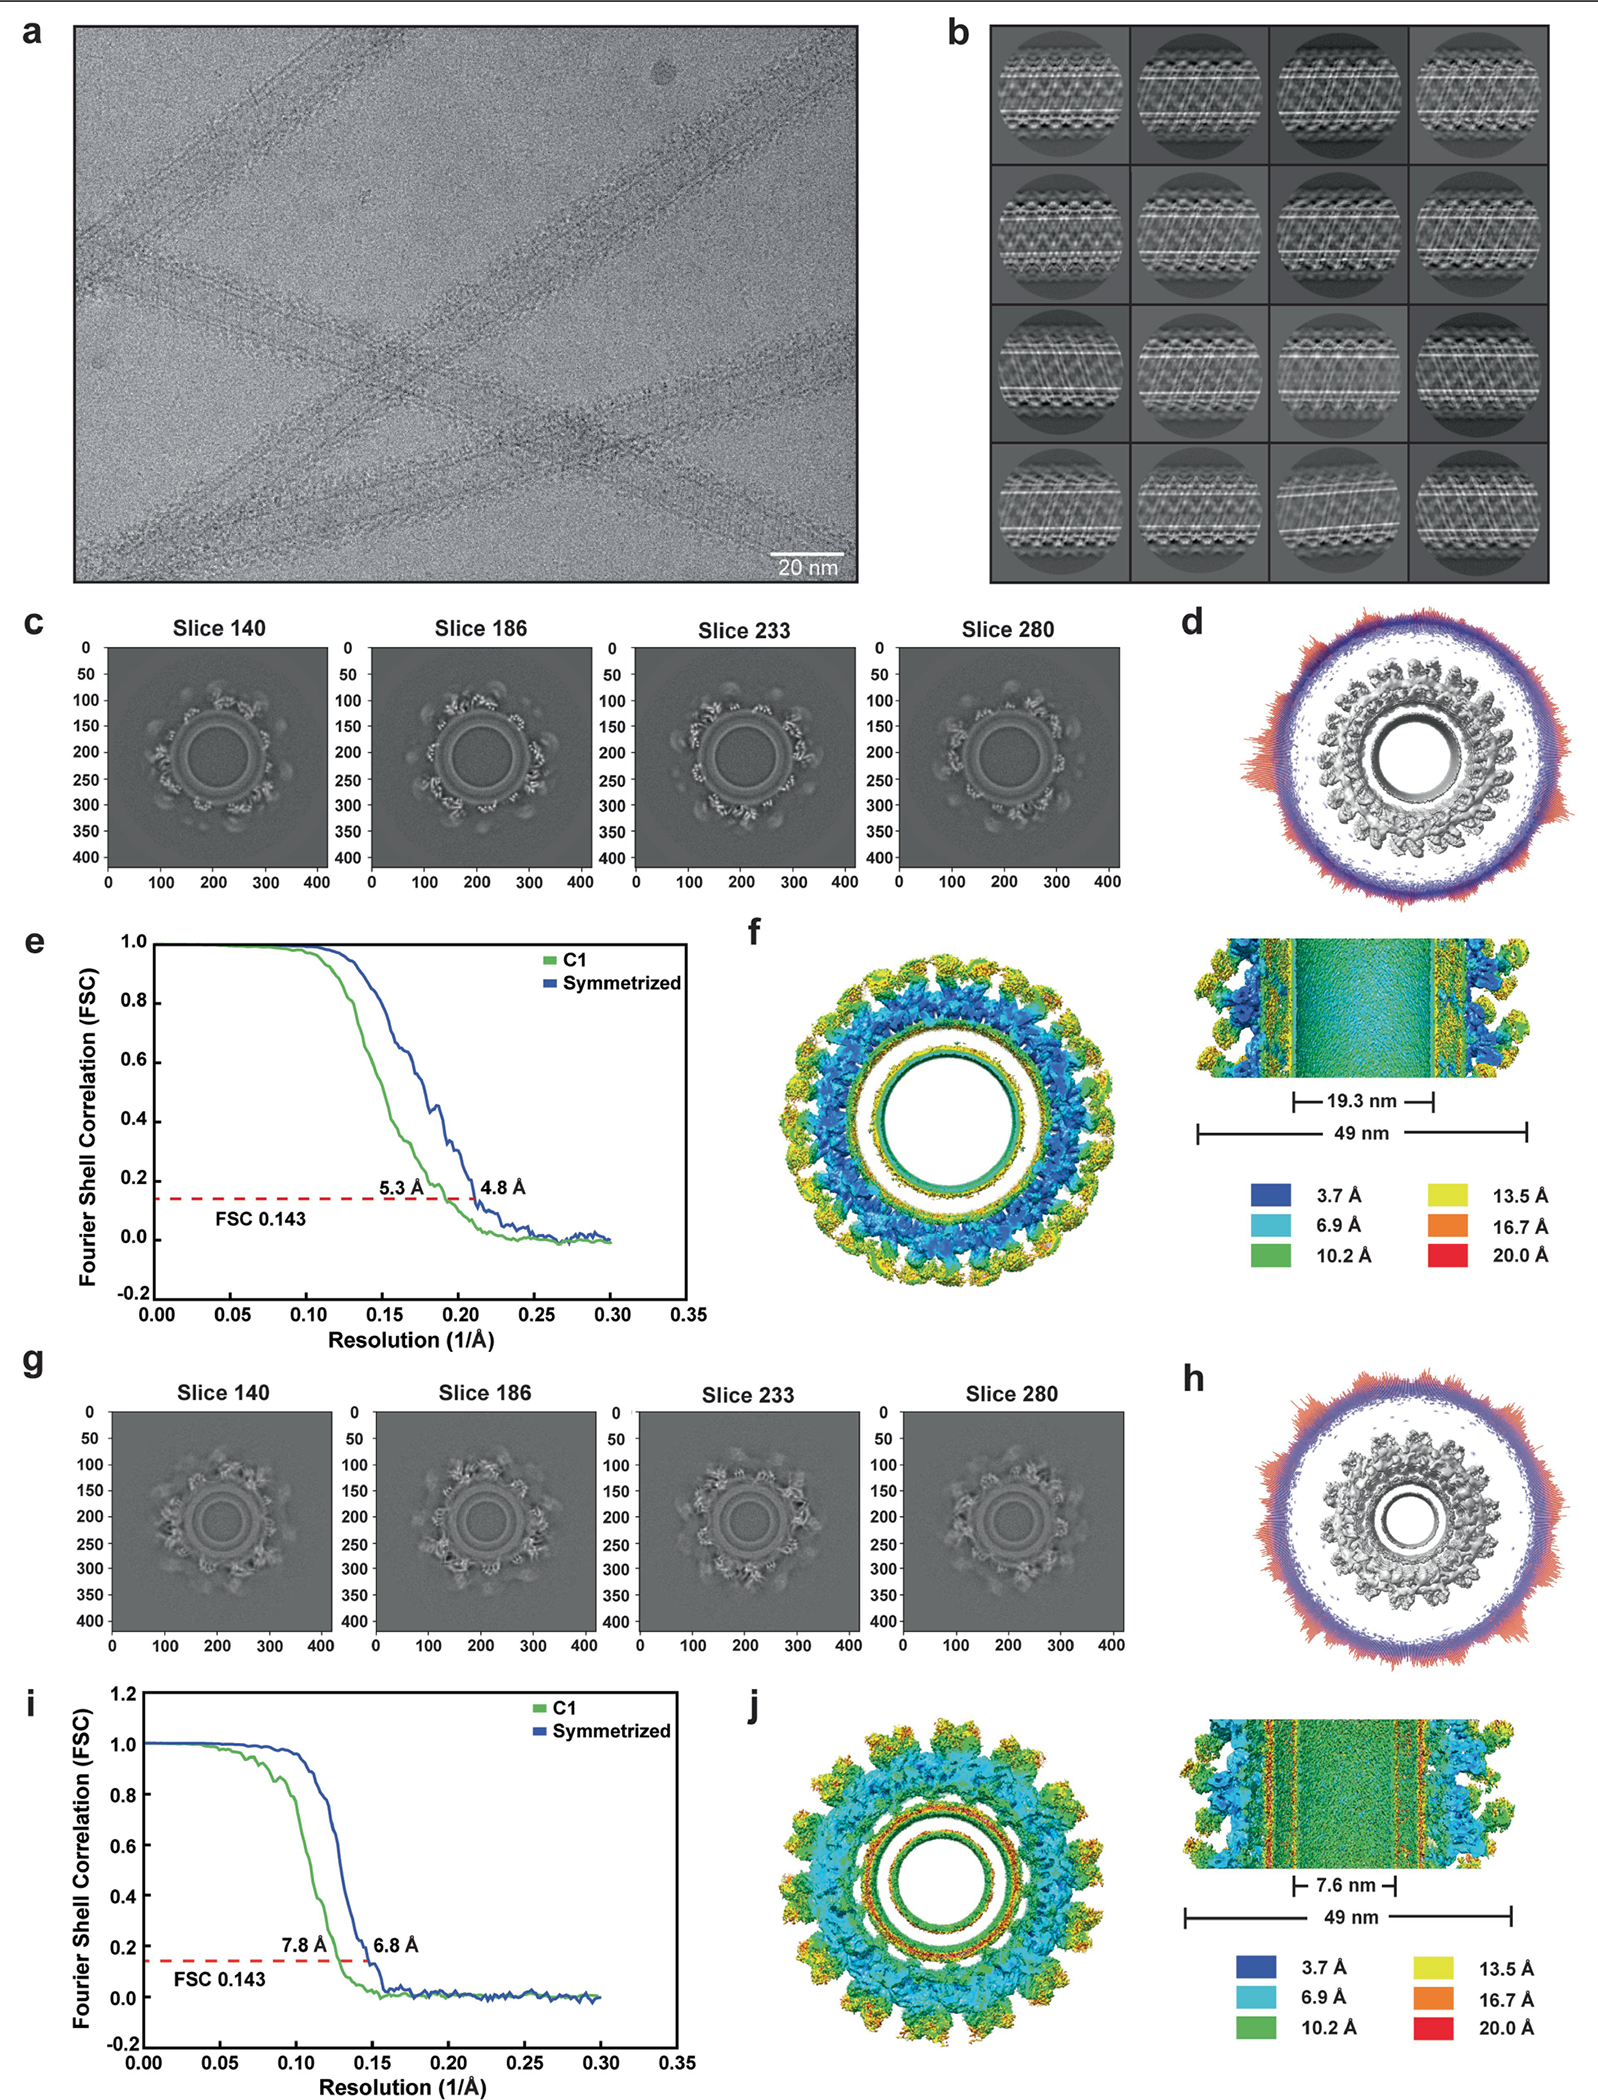
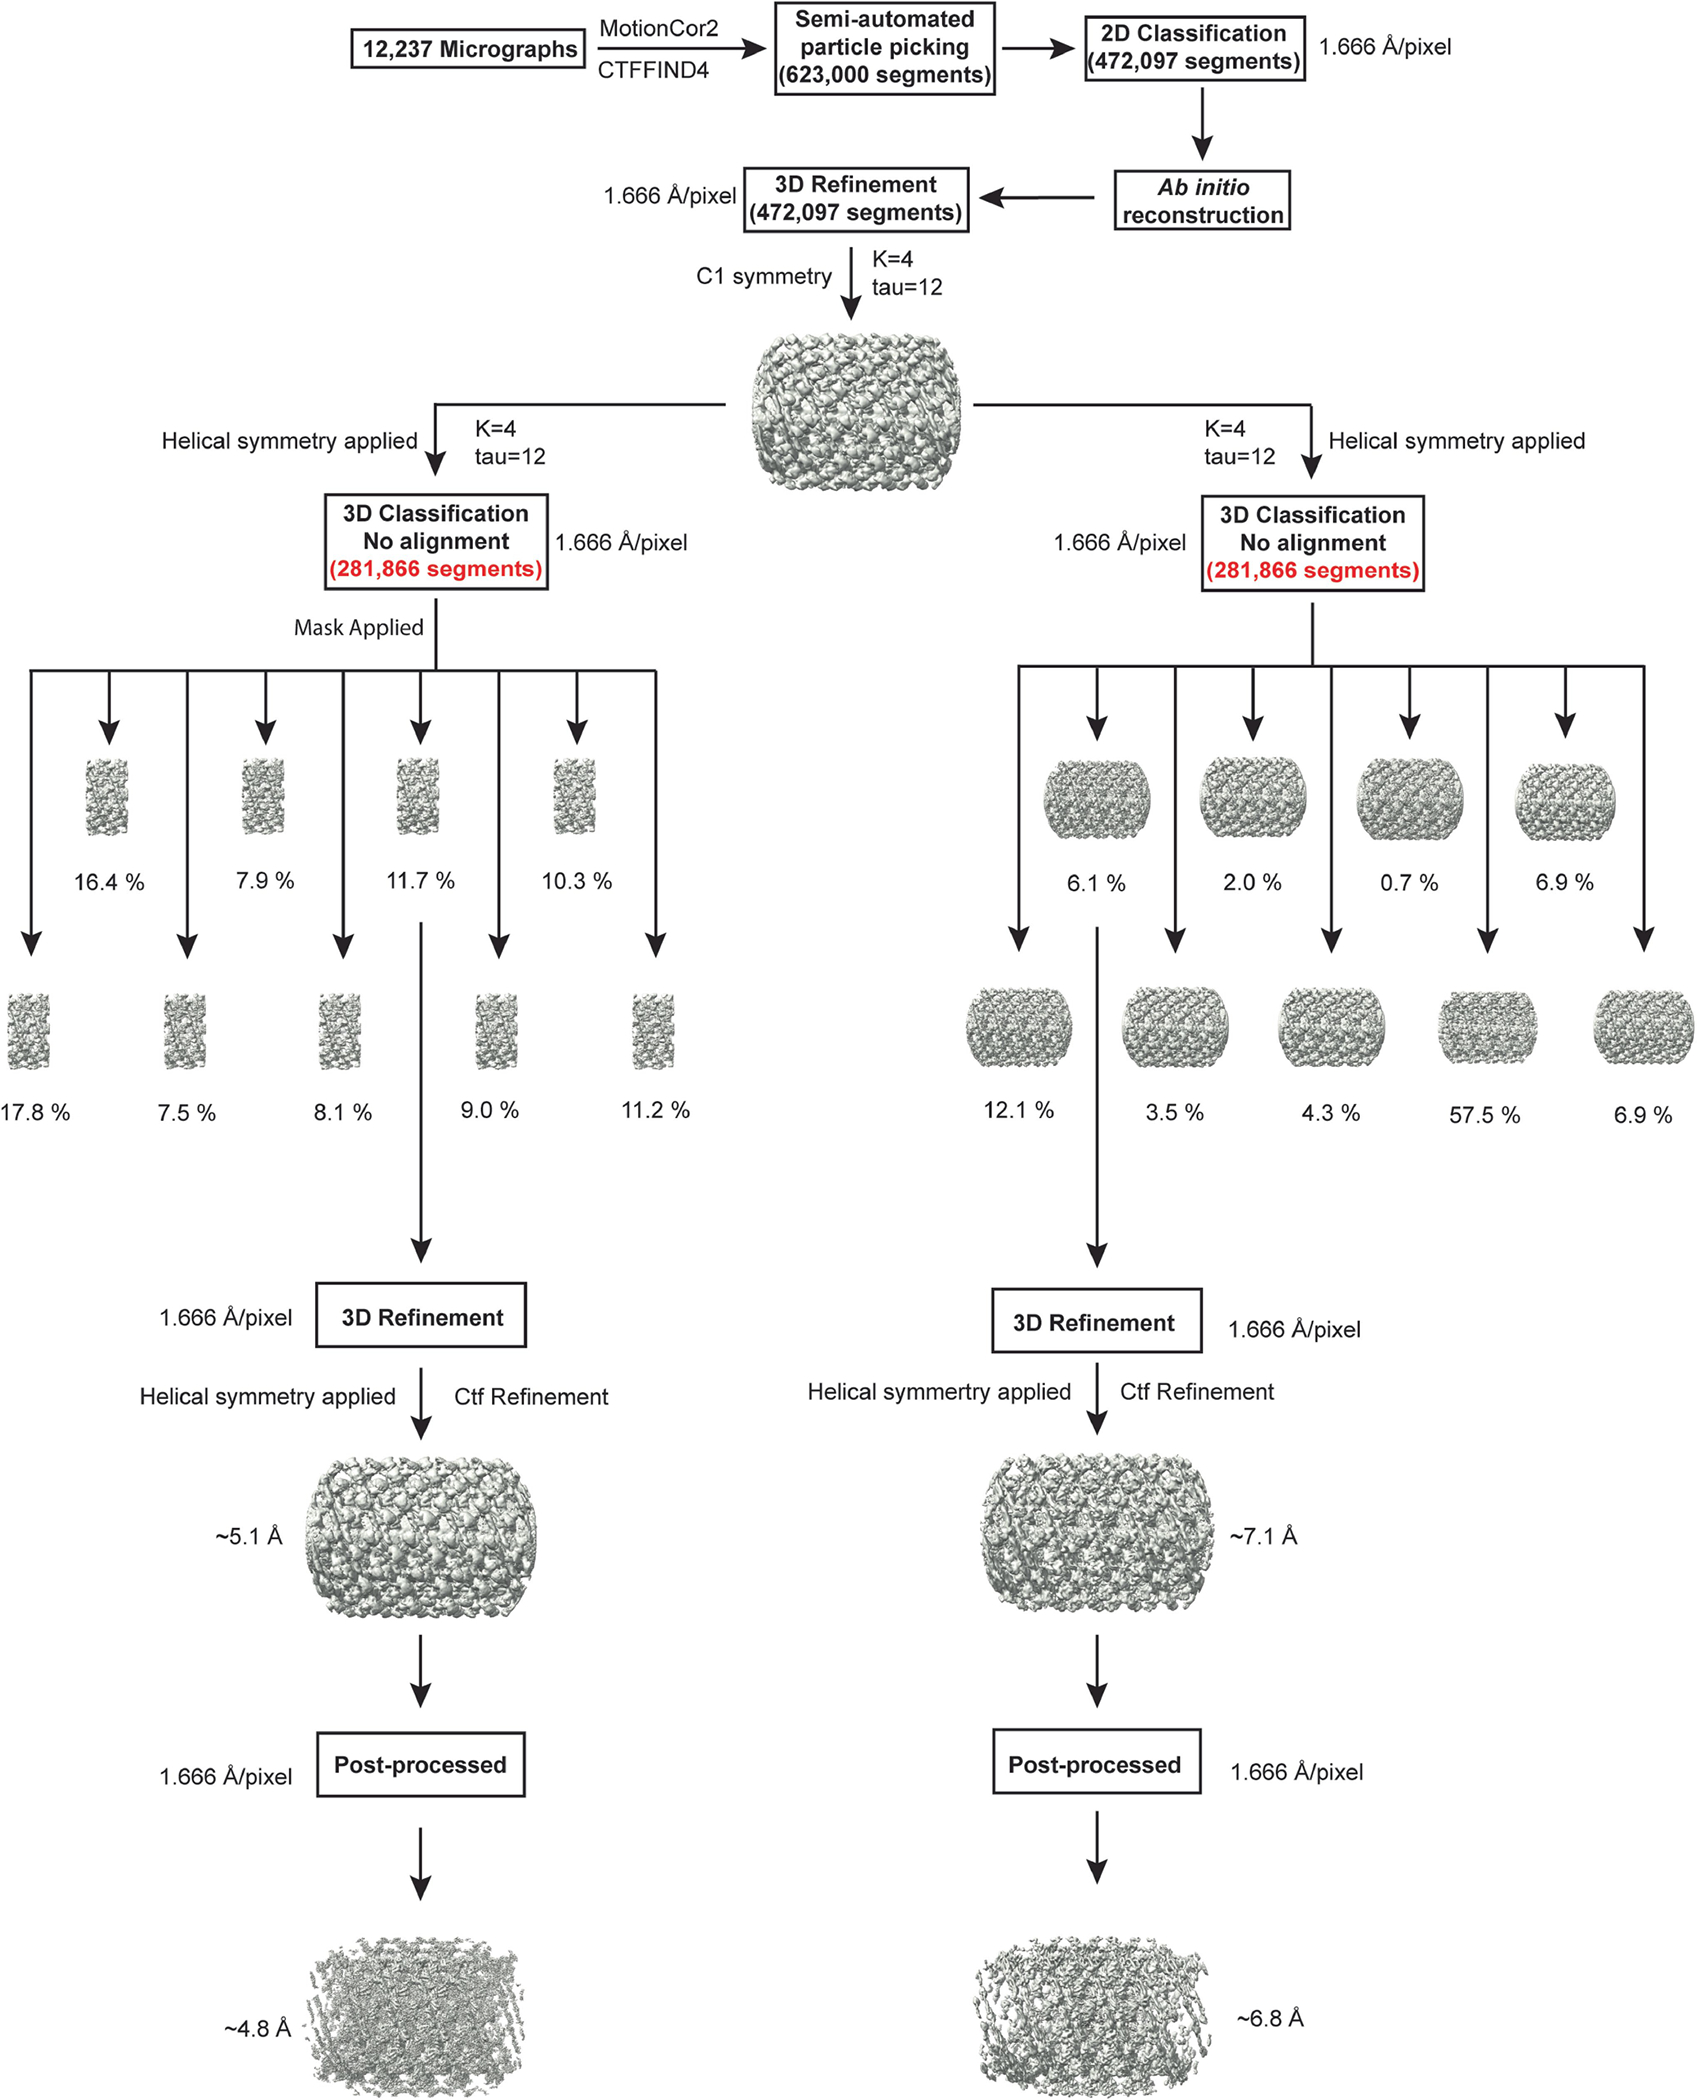
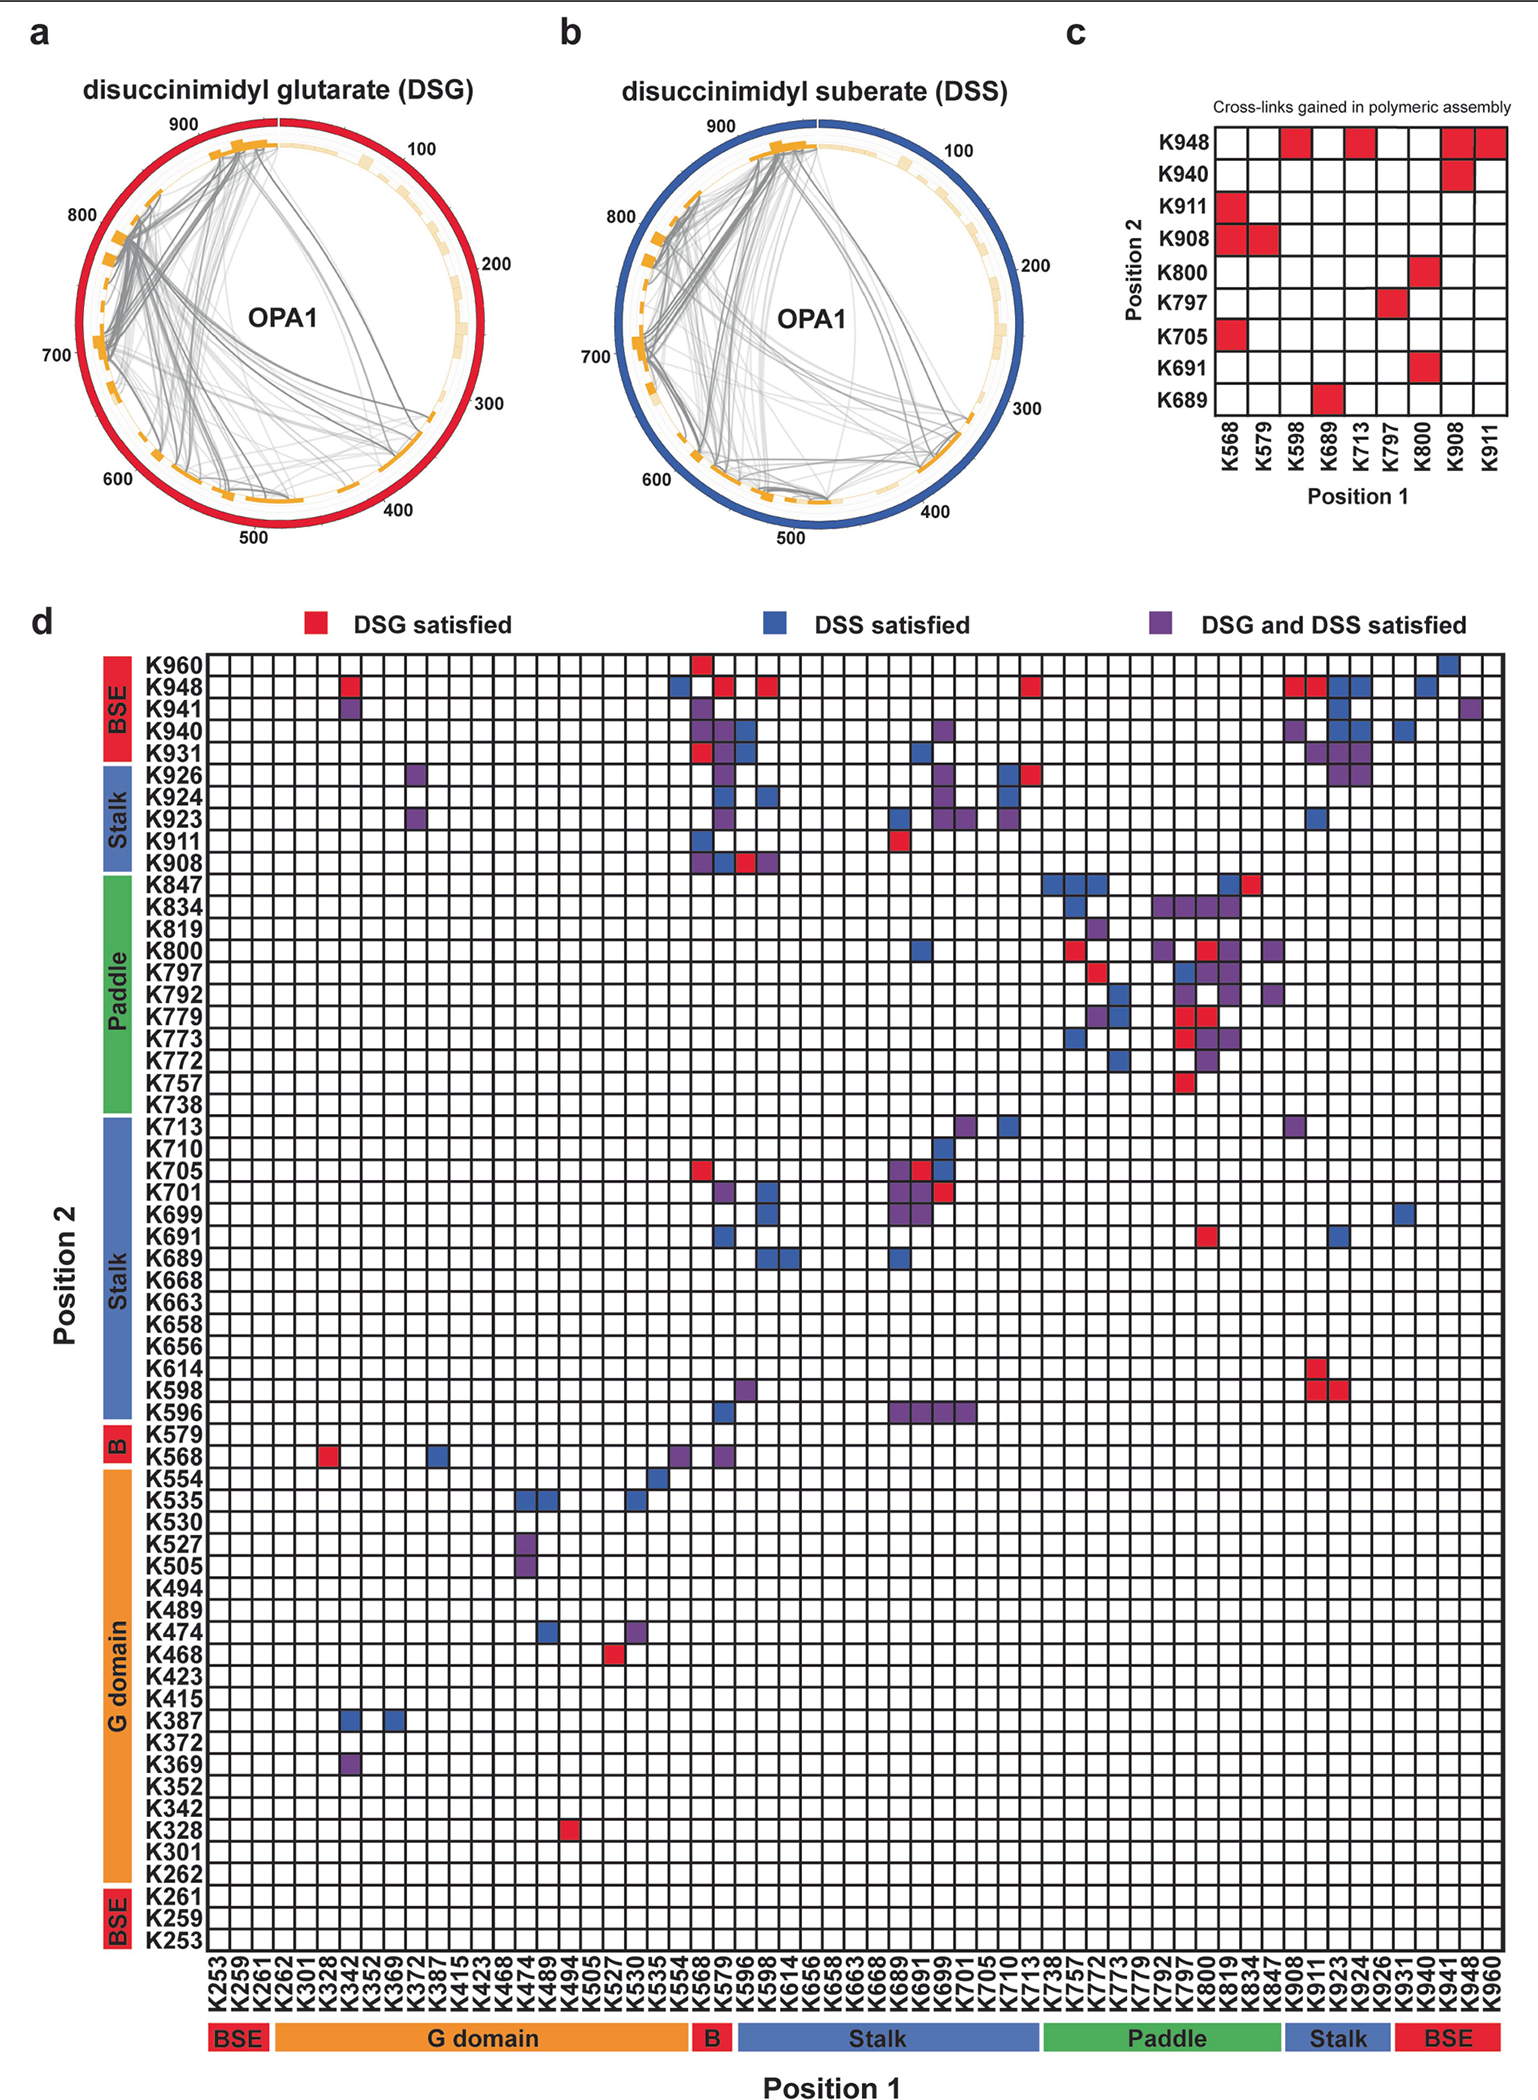
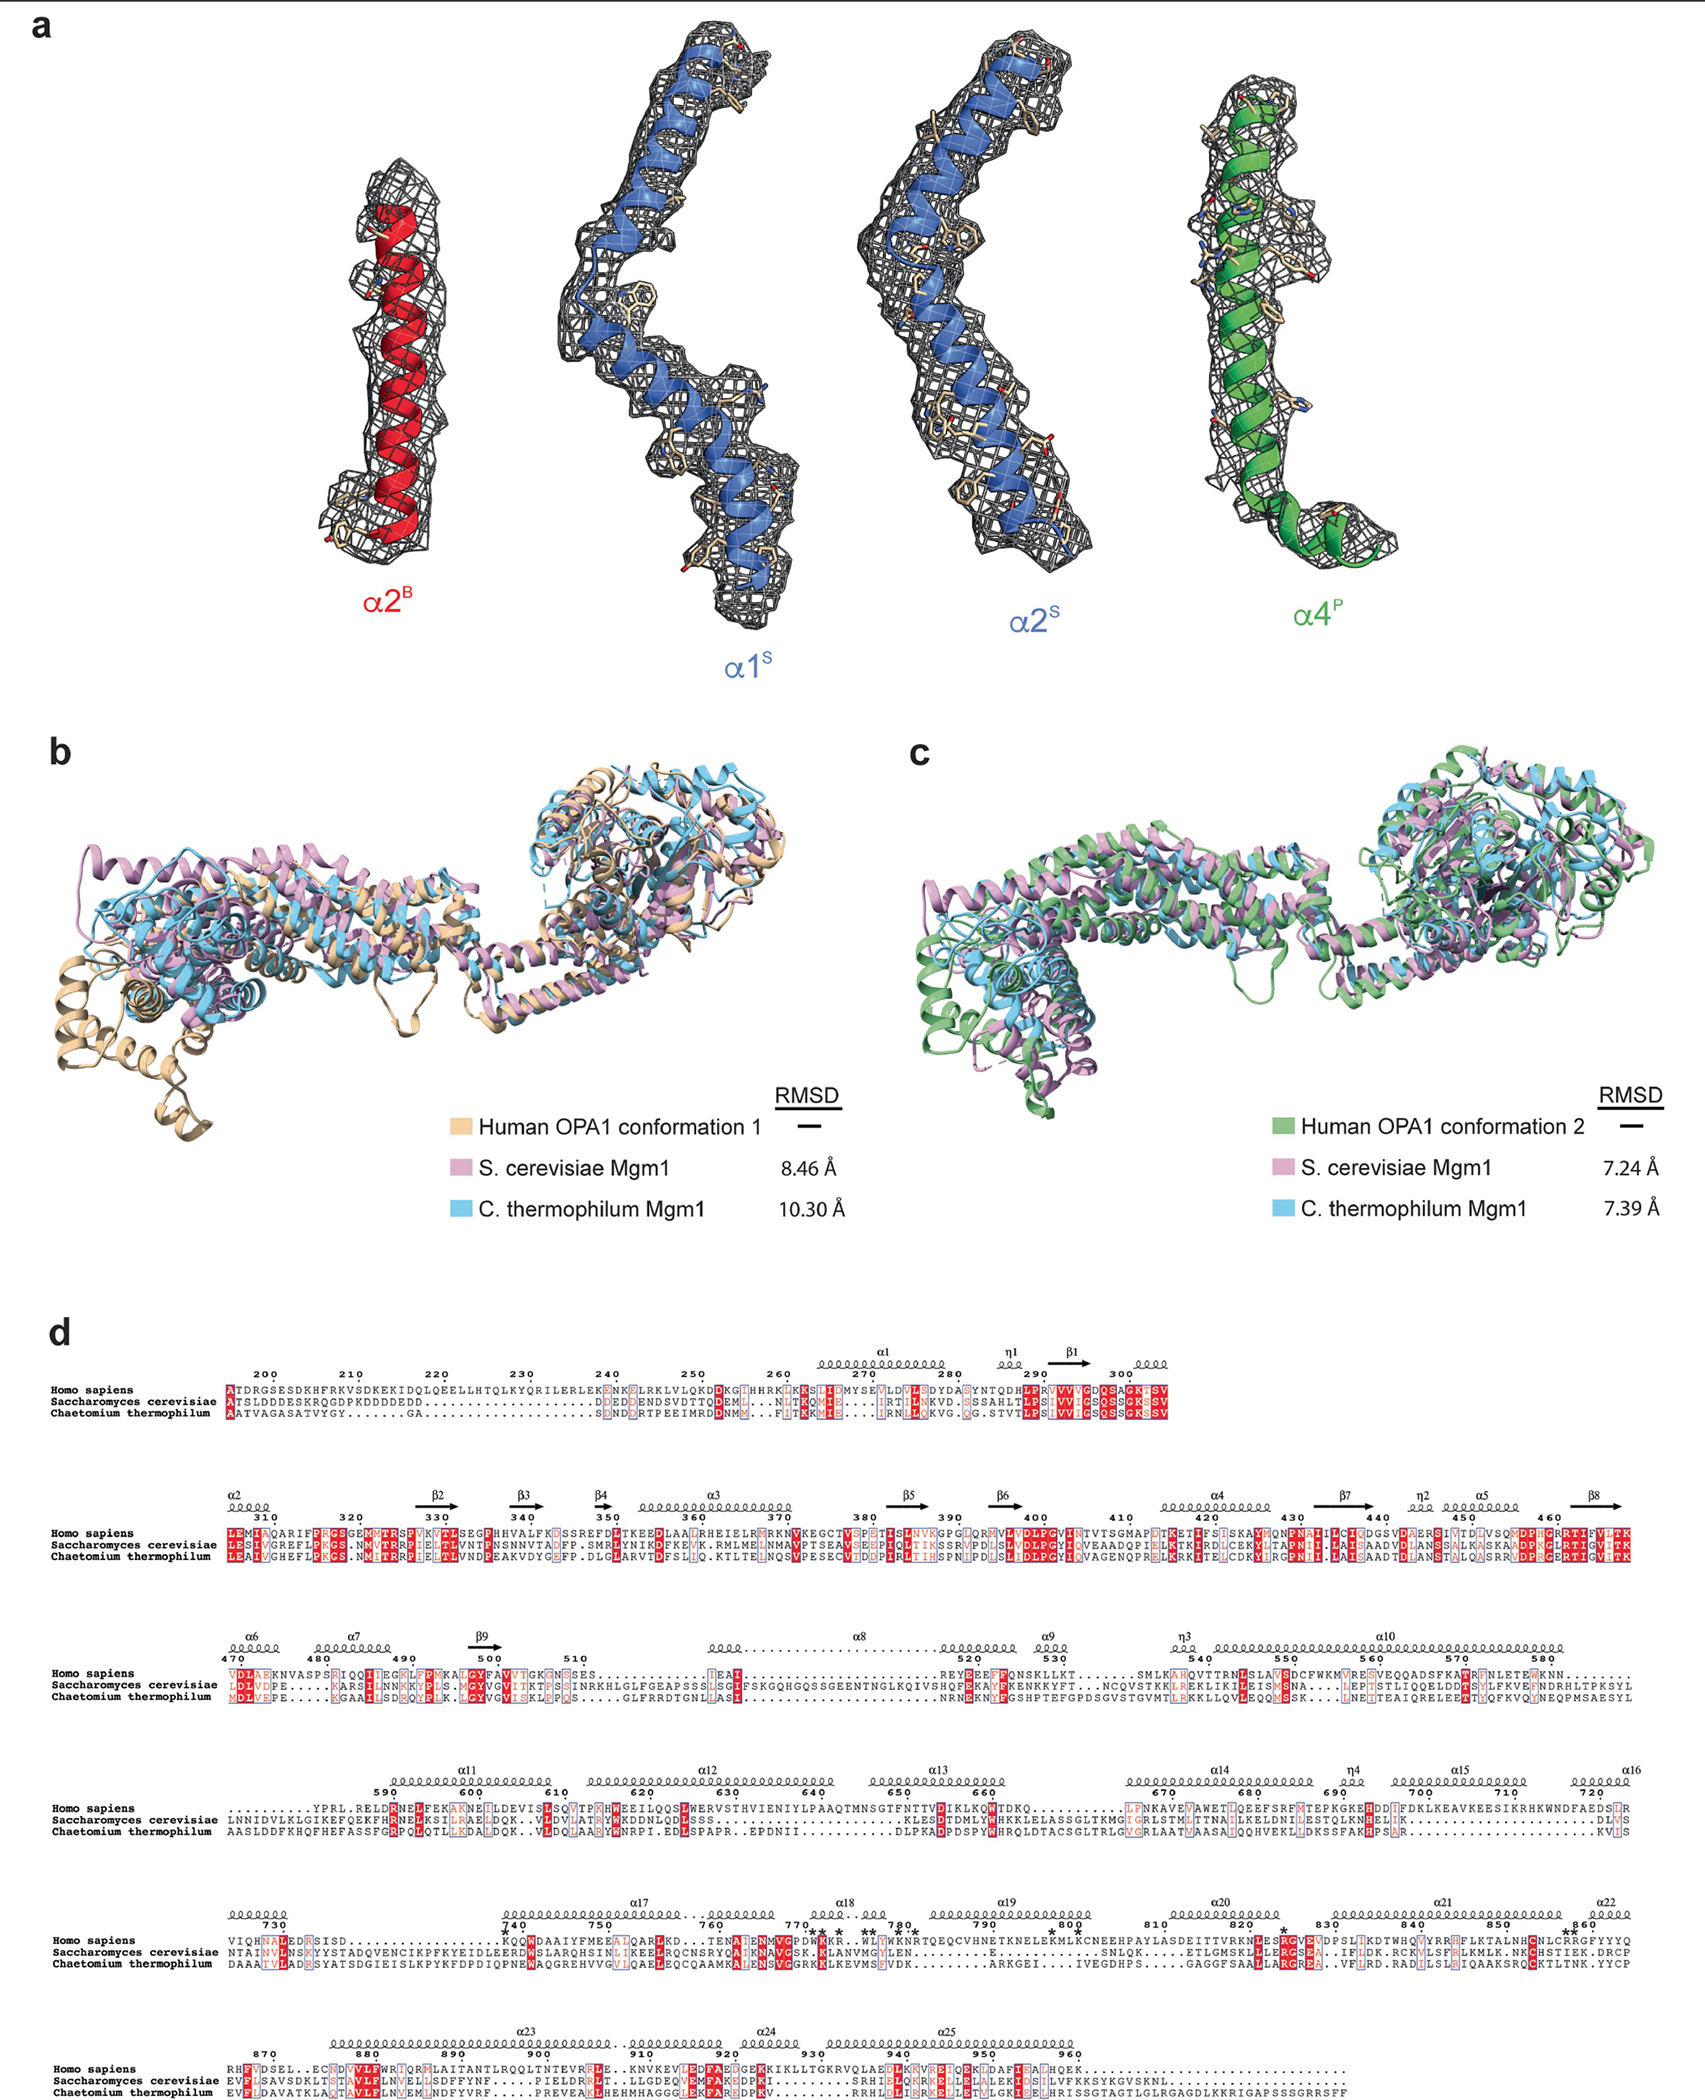
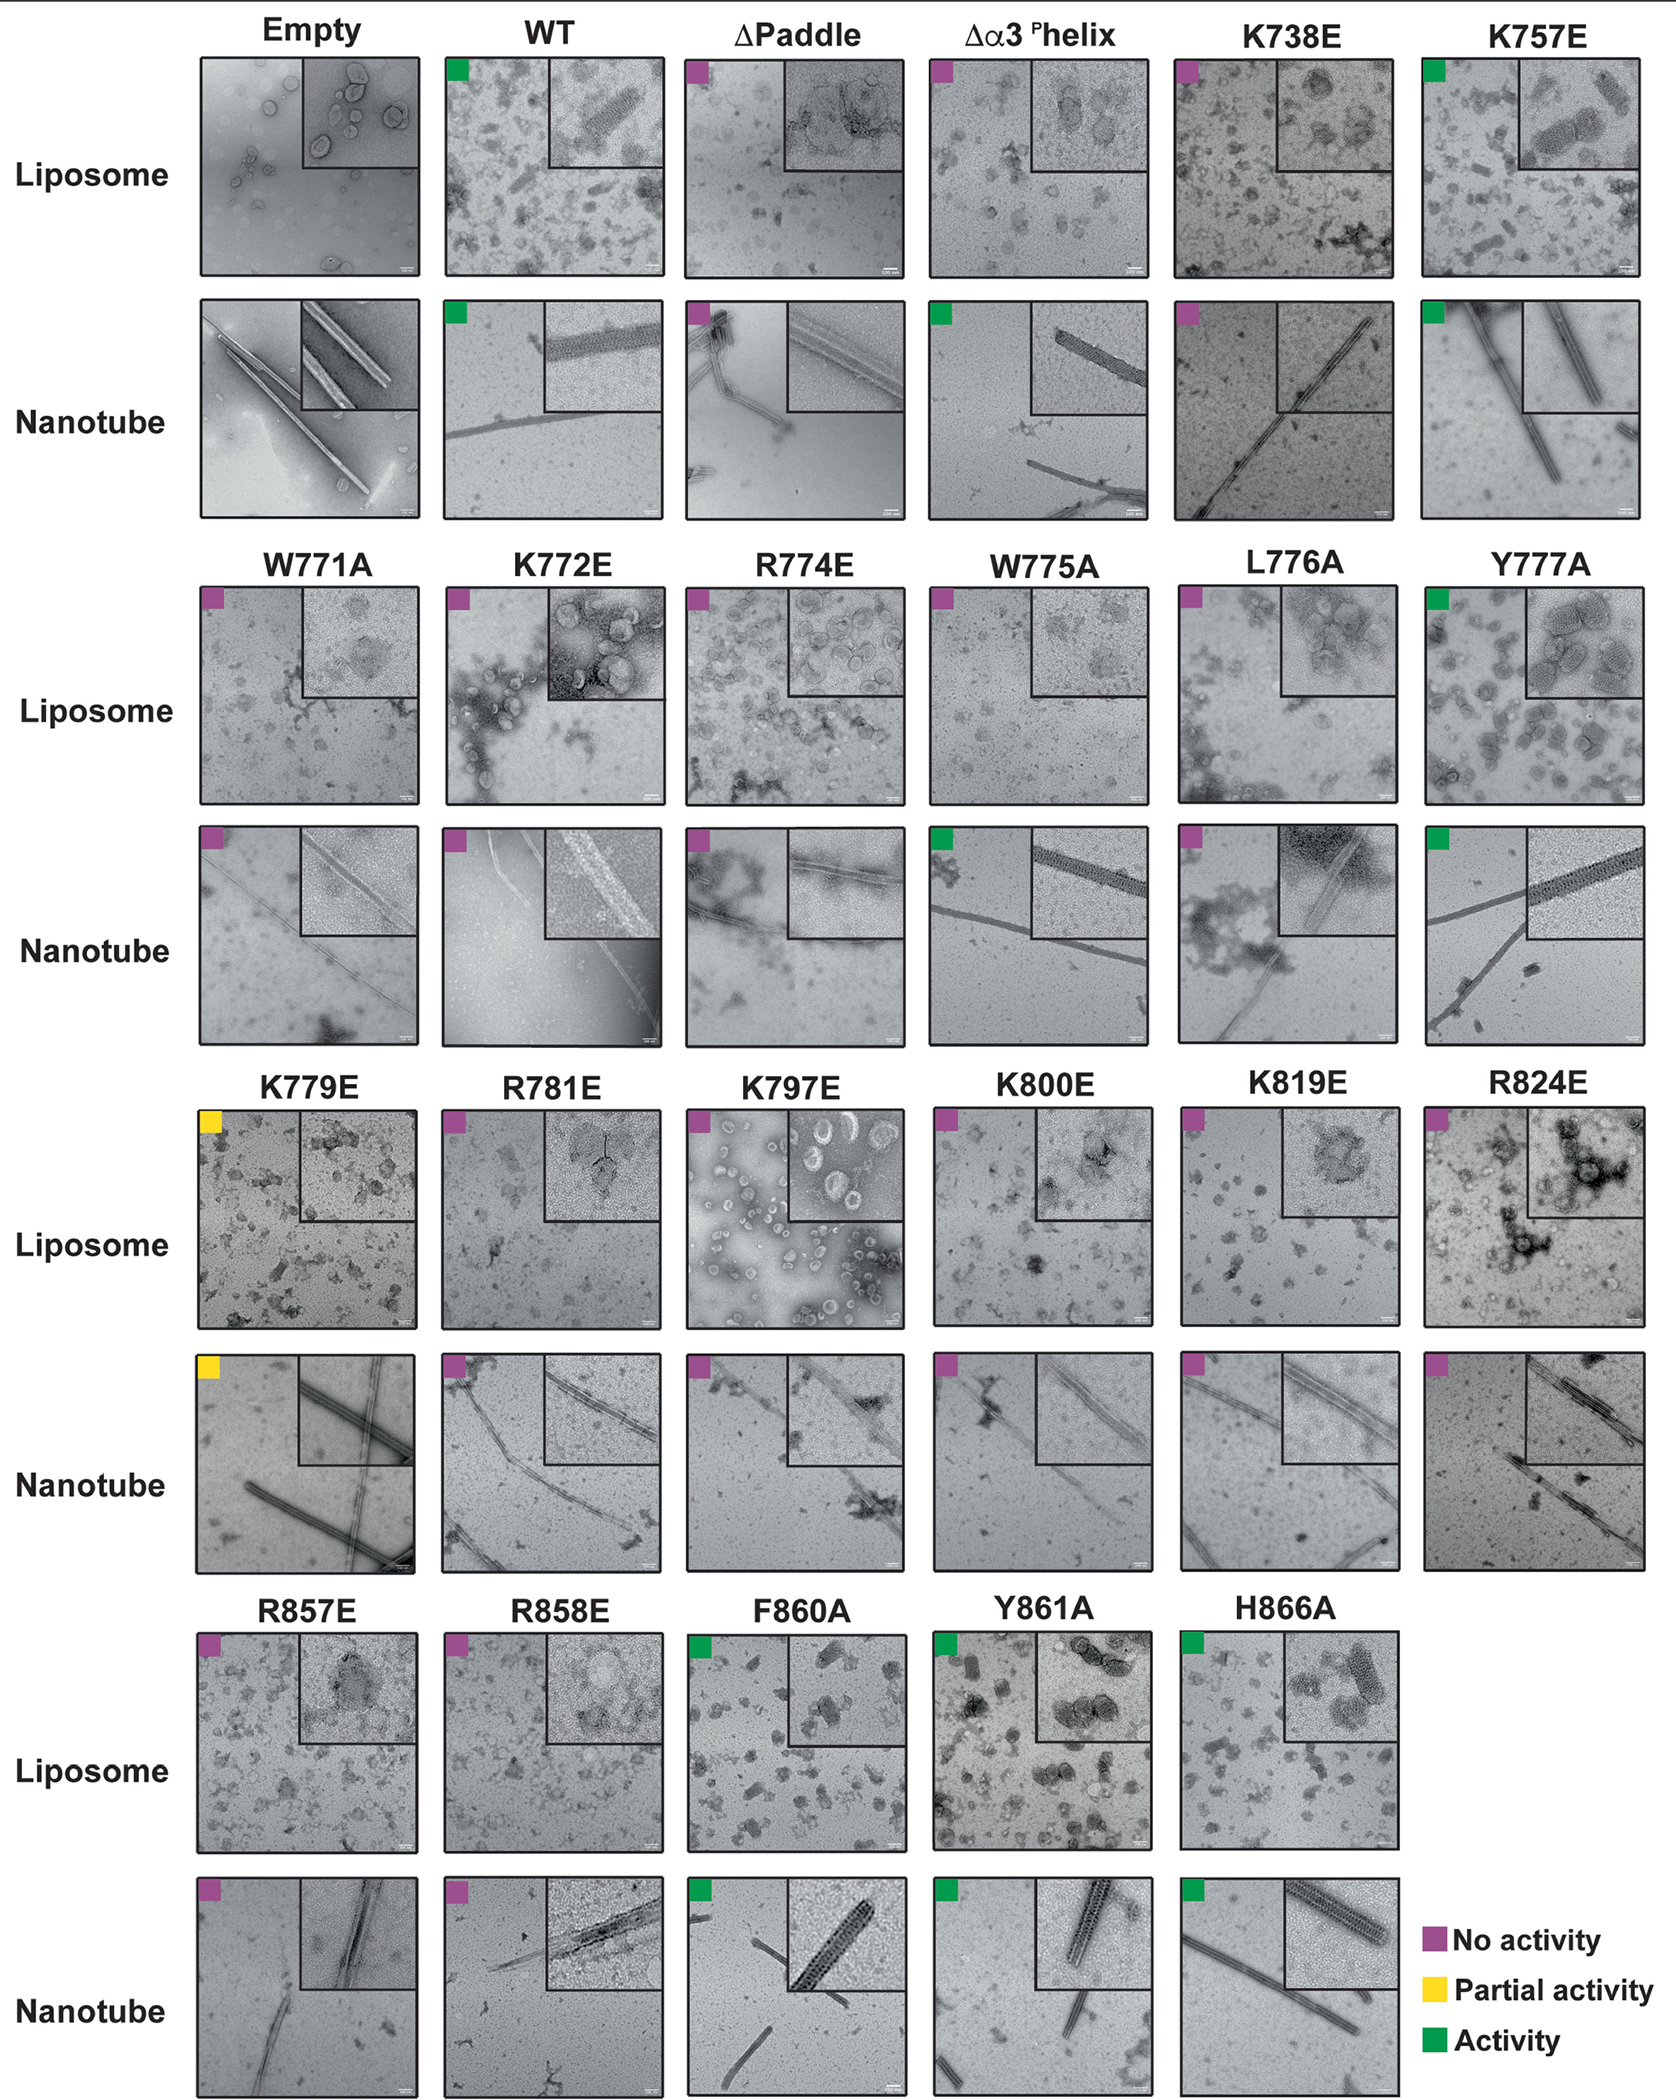
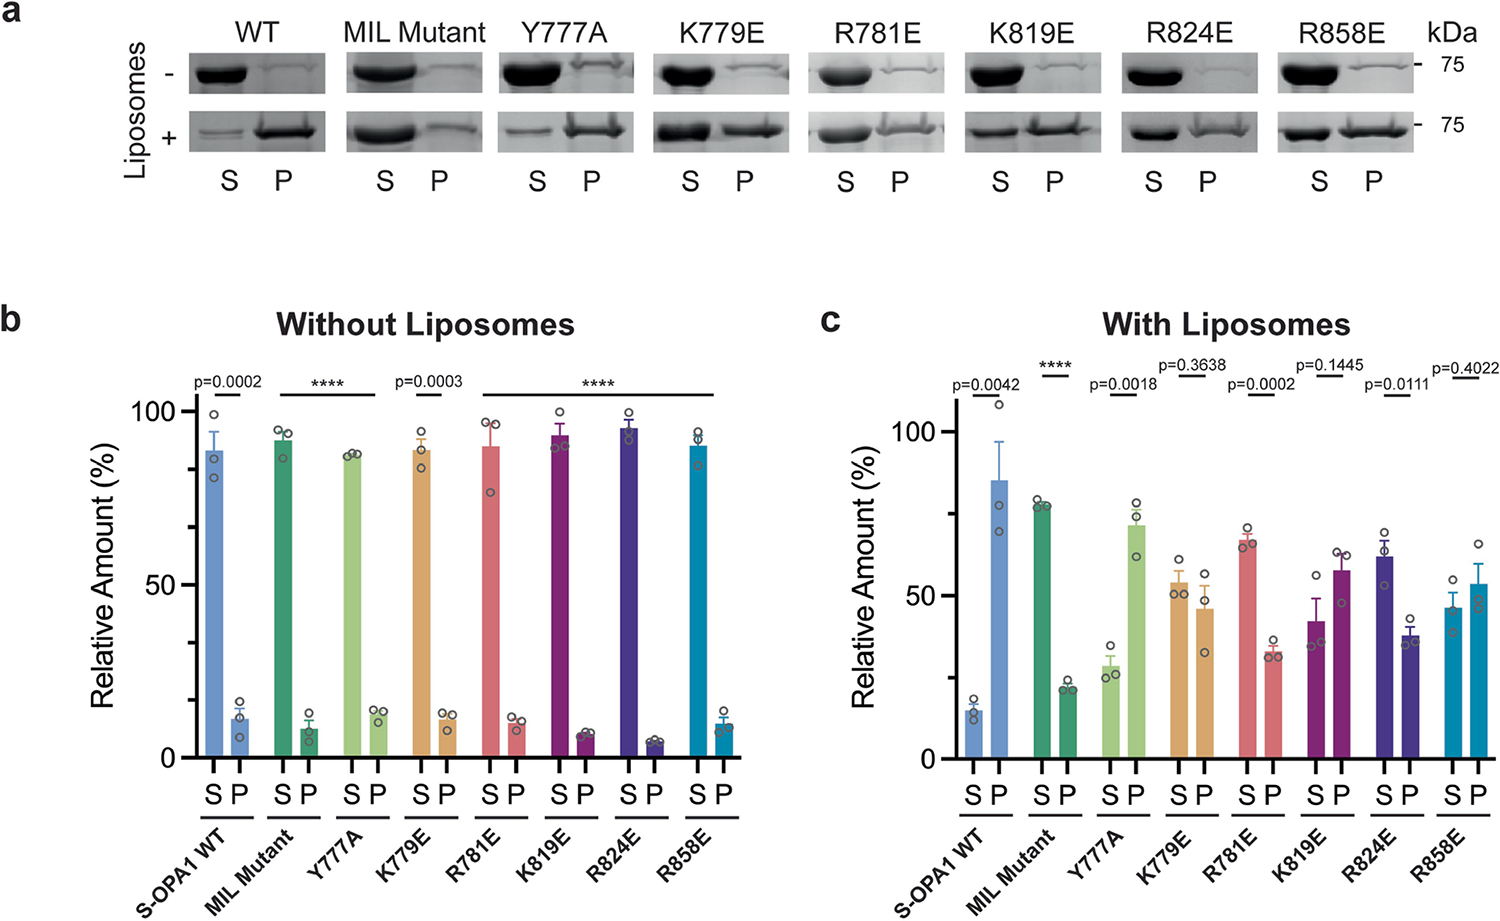
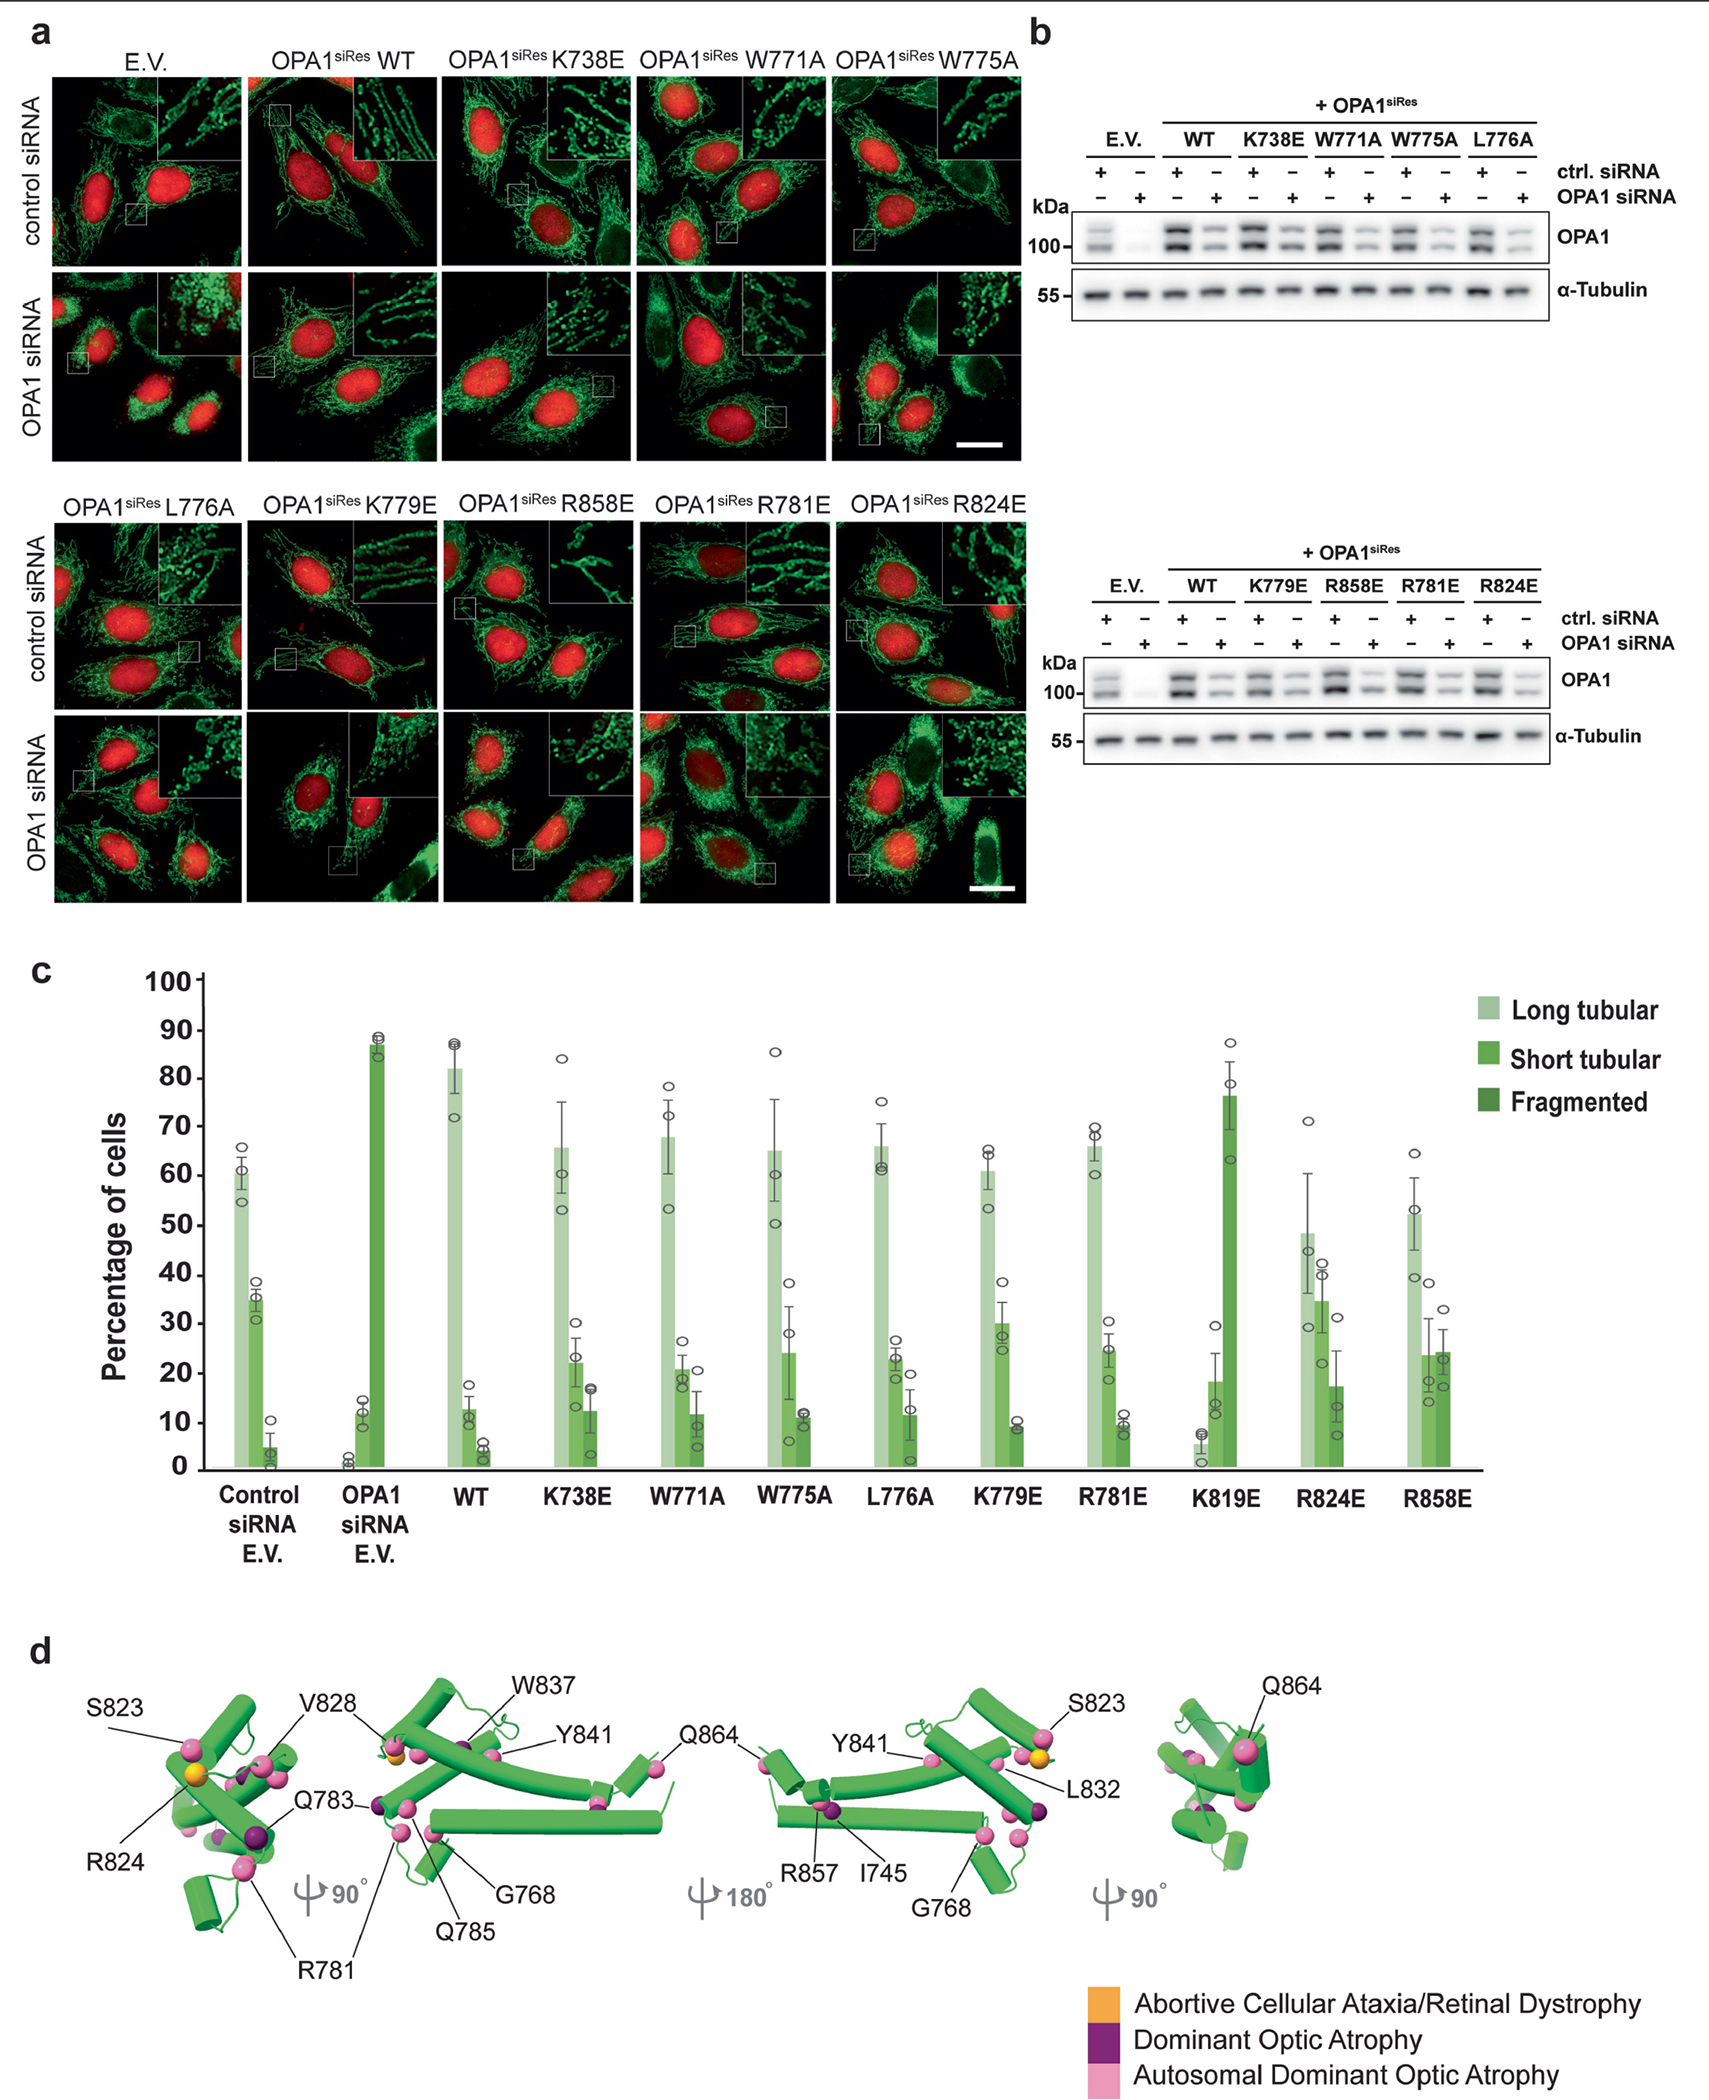
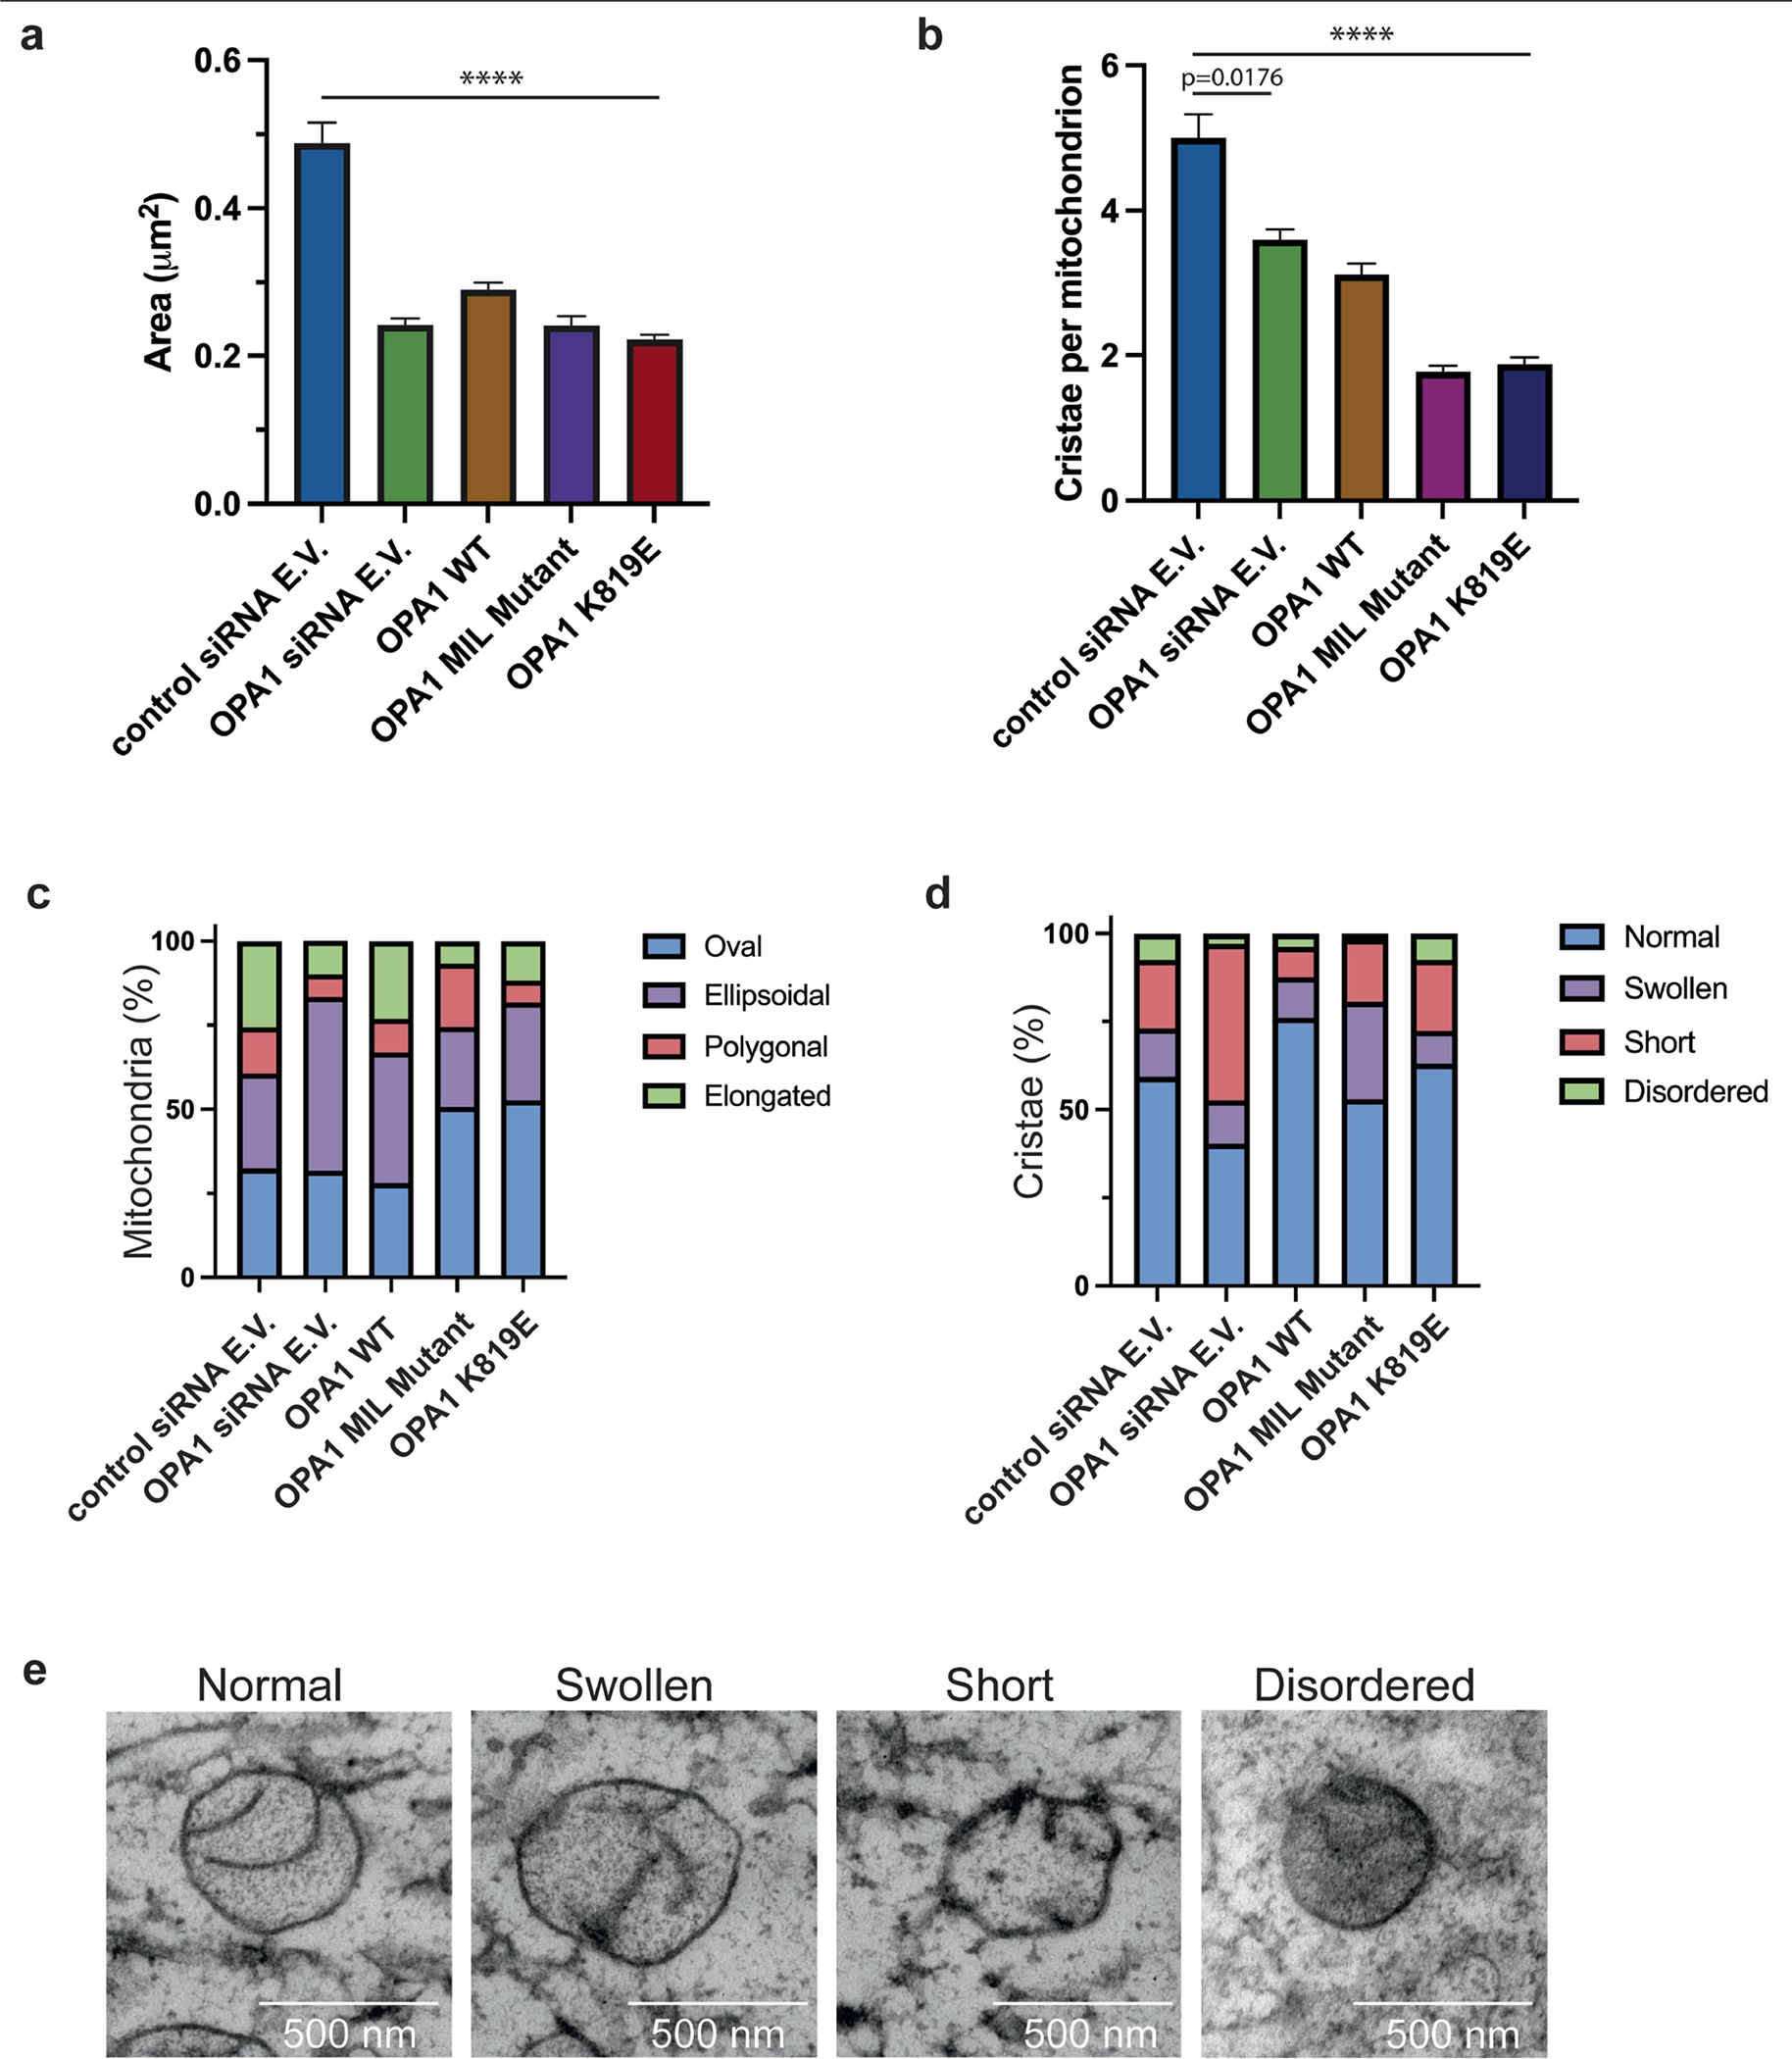
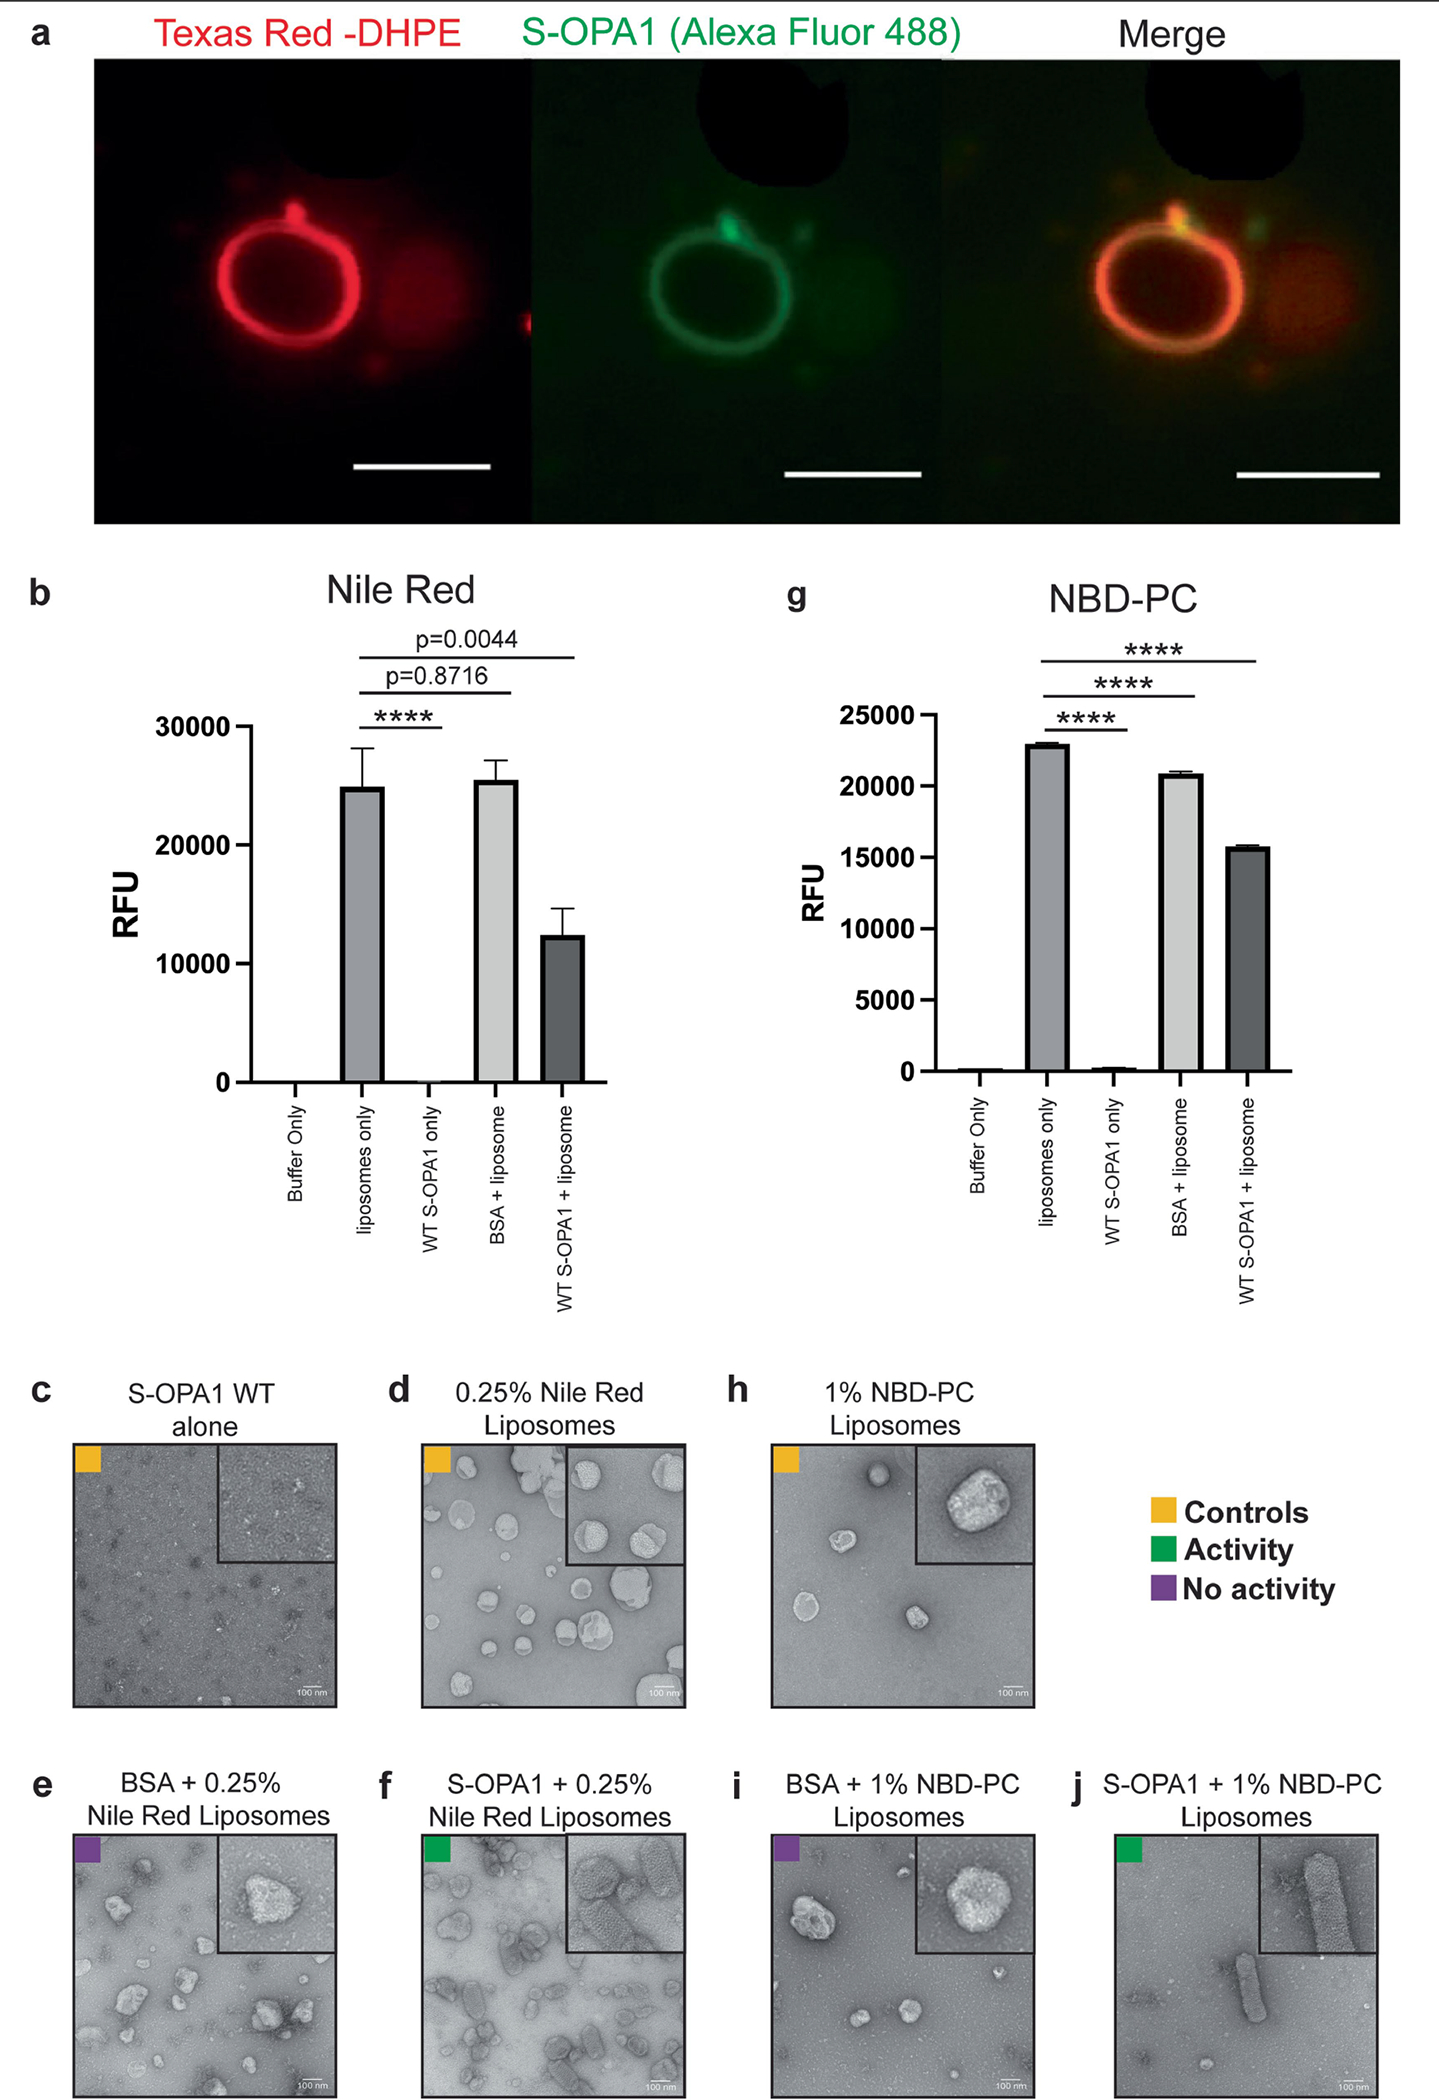
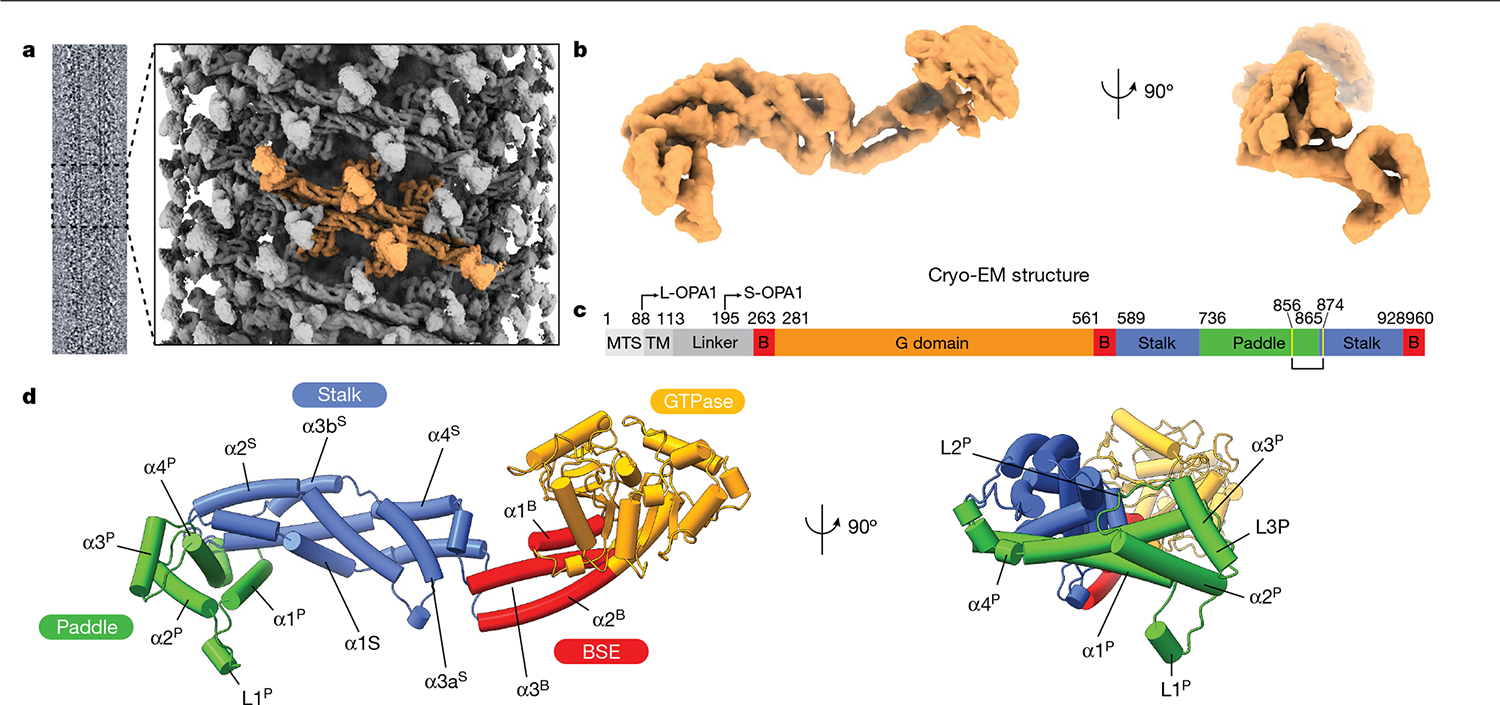
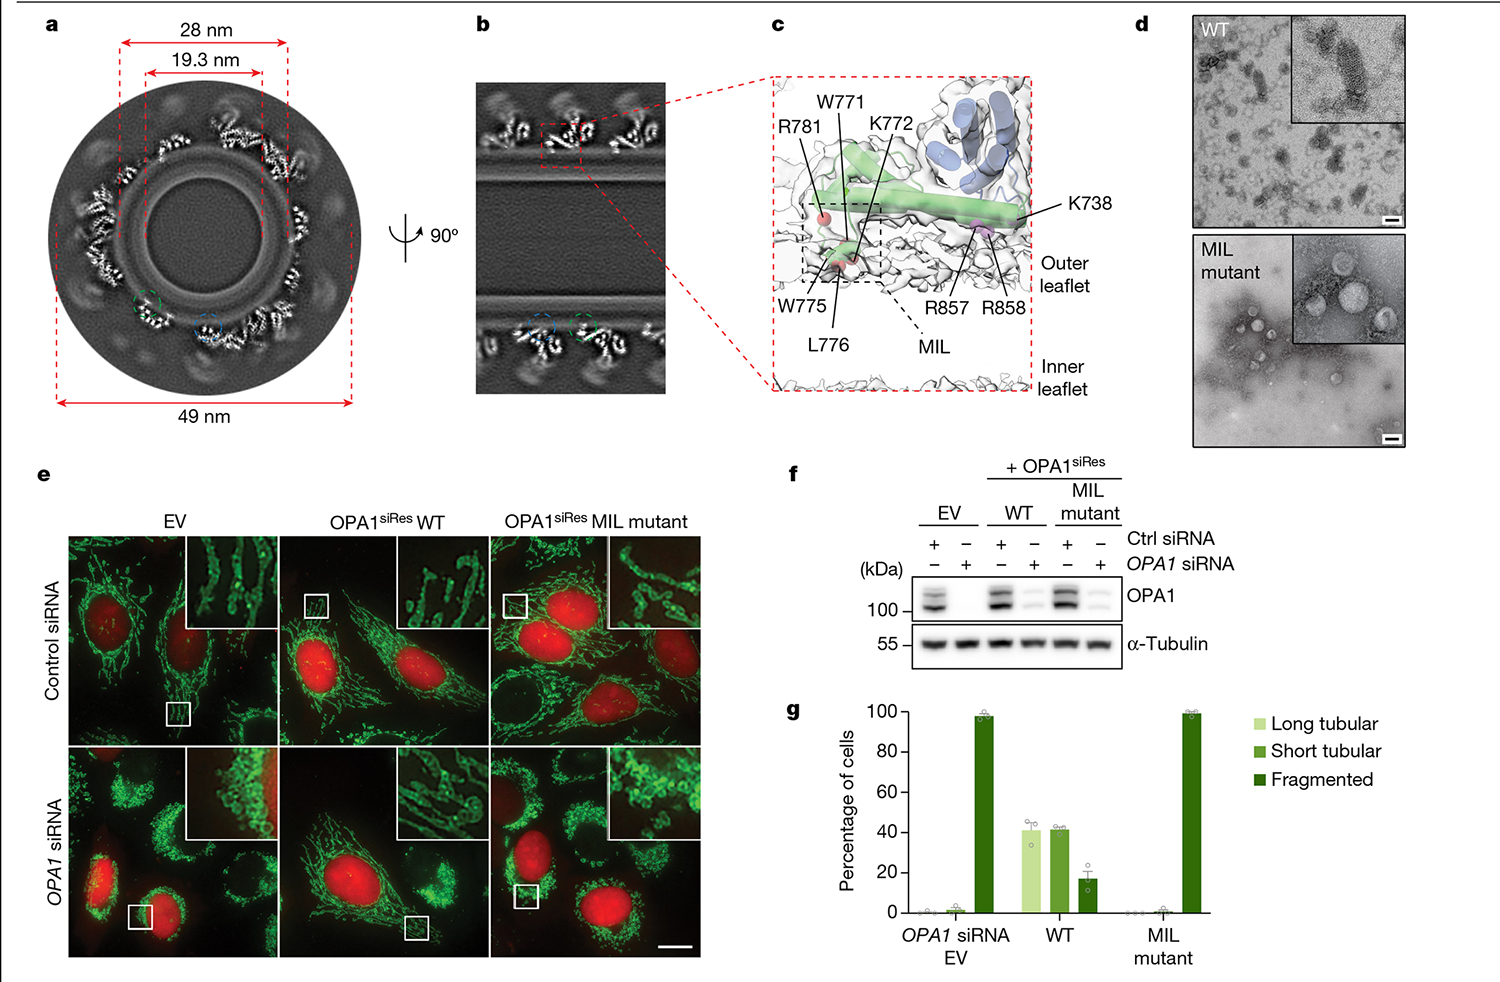
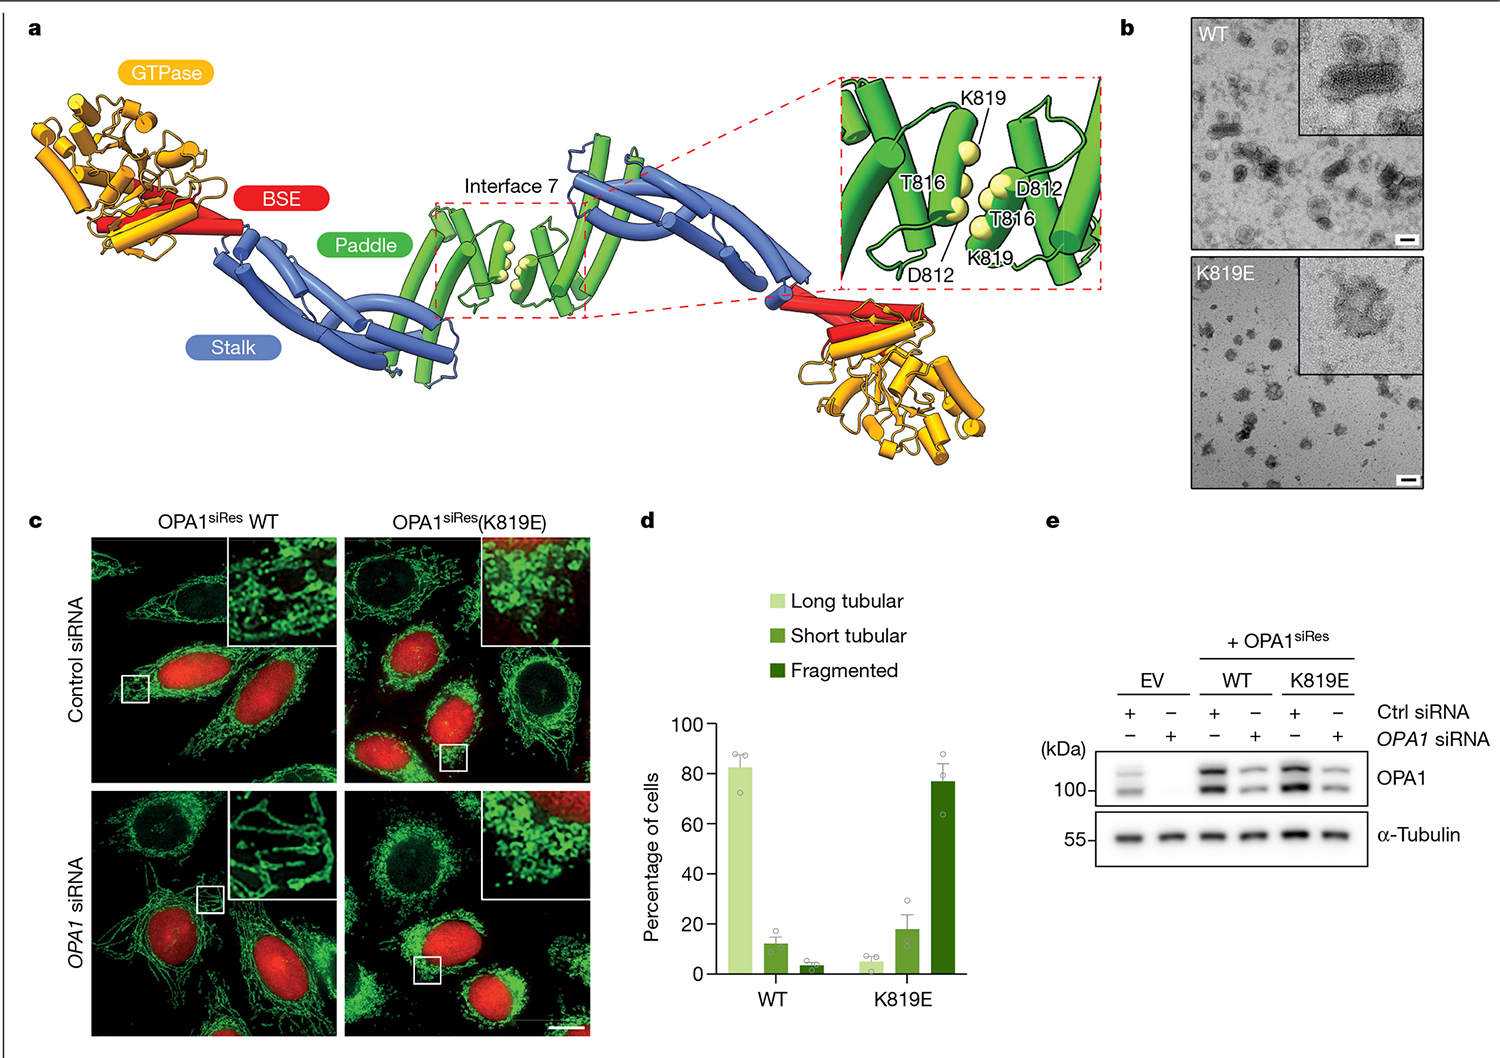
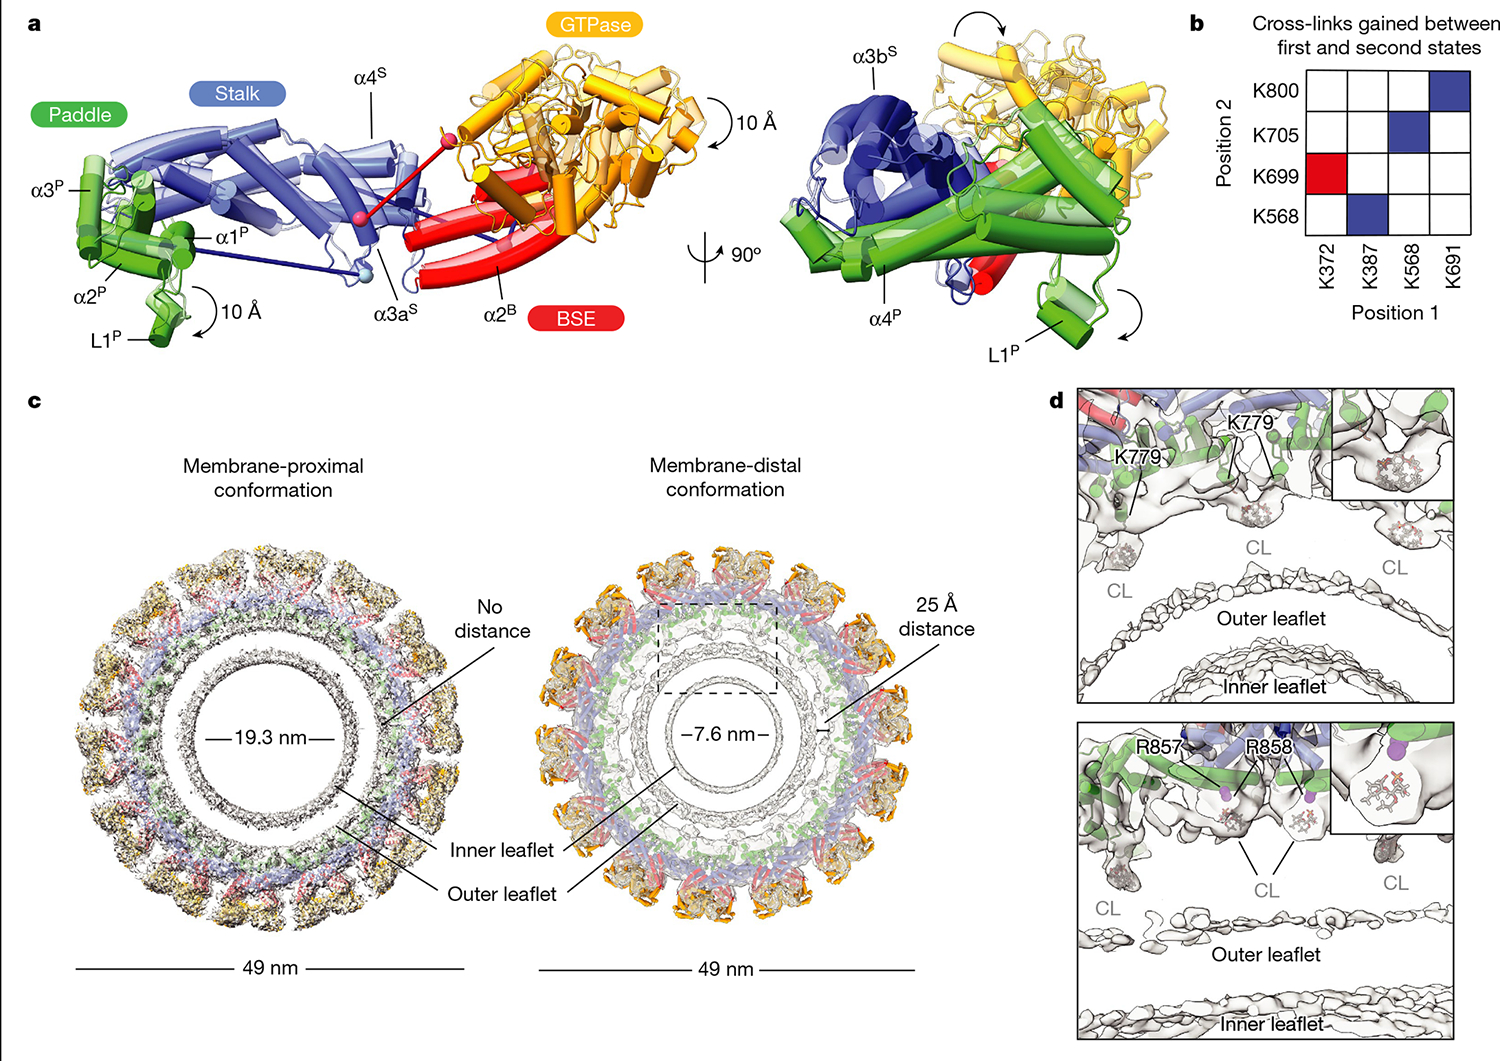
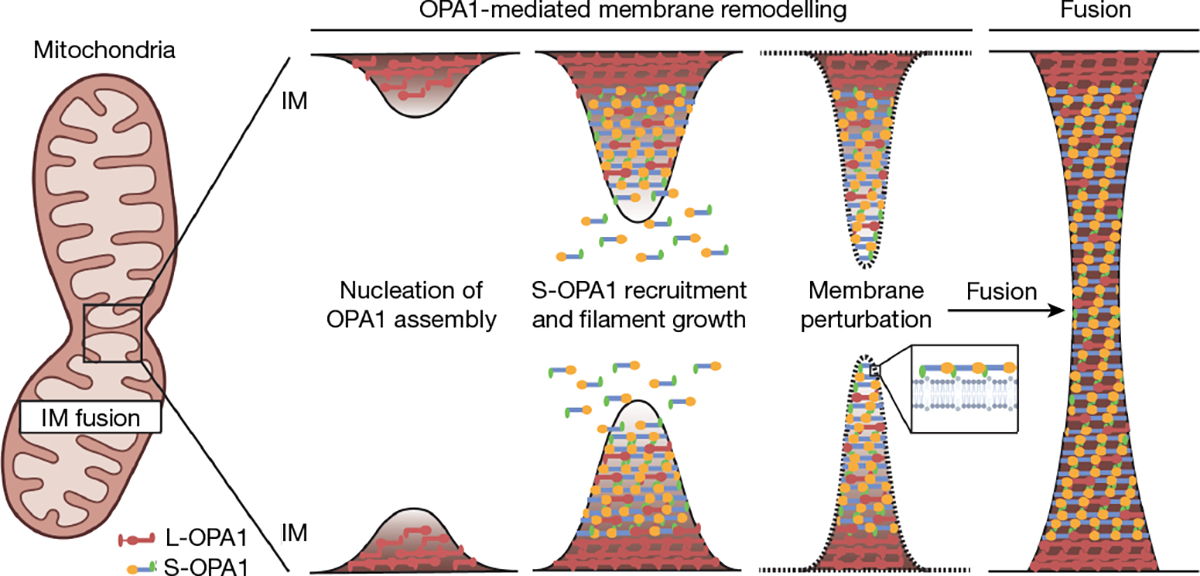
Distinct morphologies of the mitochondrial network support divergent metabolic and regulatory processes that determine cell function and fate1-3. The mechanochemical GTPase optic atrophy 1 (OPA1) influences the architecture of cristae and catalyses the fusion of the mitochondrial inner membrane4,5. Despite its fundamental importance, the molecular mechanisms by which OPA1 modulates mitochondrial morphology are unclear. Here, using a combination of cellular and structural analyses, we illuminate the molecular mechanisms that are key to OPA1-dependent membrane remodelling and fusion. Human OPA1 embeds itself into cardiolipin-containing membranes through a lipid-binding paddle domain. A conserved loop within the paddle domain inserts deeply into the bilayer, further stabilizing the interactions with cardiolipin-enriched membranes. OPA1 dimerization through the paddle domain promotes the helical assembly of a flexible OPA1 lattice on the membrane, which drives mitochondrial fusion in cells. Moreover, the membrane-bending OPA1 oligomer undergoes conformational changes that pull the membrane-inserting loop out of the outer leaflet and contribute to the mechanics of membrane remodelling. Our findings provide a structural framework for understanding how human OPA1 shapes mitochondrial morphology and show us how human disease mutations compromise OPA1 functions.


Conflict of interest statement

Competing interests A.F. is a shareholder and employee of Altos Labs and a shareholder and consultant for Relay Therapeutics. The other authors declare no competing interests.

Figures

Extended Data Fig. 1 |
Extended Data Fig. 1 |. Purification and functional characterization of the human S-OPA1 construct.
Using a recombinant Escherichia coli expression system, we expressed and purified human S-OPA1 (residues 252–960) in the presence of detergents by Ni2+-affinity and gel filtration chromatography. a, A representative size exclusion chromatogram of the human S-OPA1. b, Purified S-OPA1 constructs on an SDS-PAGE gel stained with Coomassie blue. Performed in technical triplicate. c, Mass photometry profile of nucleotide-free human S-OPA1 reveals an apparent molecular mass of 82 σ 9.8 kDa, which corresponds to a monomeric state. d, Kyte and Doolittle hydropathy plot of full-length human OPA1 isoform 1. Hydrophobic regions corresponding to the transmembrane (TM) region and fusion loop are highlighted in blue and red, respectively. The red line indicates the zero baseline on the hydropathy scale. e, To assess the proper folding and nucleotide-dependent dimerization of recombinant S-OPA1, we incubated the sample with the non-hydrolysable analogue GMPPCP, Mg2+, and K+. Then, using negative-stain transmission electron microscopy (TEM), we observed that S-OPA1 forms dimers via GTPase domain interactions. Representative negative-stain EM 2D class averages of human S-OPA1 from the negative-stain data collected on Tecnai T12 microscope equipped with CCD camera showing that particles have well-defined shapes with modular domain architecture. Monomeric human S-OPA1 forms G domain dimers in the presence of non-hydrolysable GTP analogue GMPPCP.
Extended Data Fig. 2 |
Extended Data Fig. 2 |. Reconstitution of human S-OPA1 assemblies and analysis by cryo-EM.
a, Representative motion-corrected electron micrograph of membrane nanotube-bound S-OPA1 filaments. b, Gallery of 2D class averages calculated from the cryo-EM data showing the S-OPA1 monomers assembled on the surface of cardiolipin-enriched lipid nanotubes. c, g, Slices through the unsharpened density map at distinct levels are shown in the top view. d, h, Angular distribution of the membrane-bound S-OPA1 filament for all particle images included in the calculation of the final 3D reconstruction of the membrane-proximal (d) and the membrane-distal conformations (h). e, i, Fourier shell coefficient (FSC) curves (threshold of 0.143) between two independently refined half maps before and after post-processing. f, j, Final 3D electron density maps of both structures are coloured according to local resolution and are shown in horizontal and vertical slices through cryo-EM densities. Local resolution was calculated by ResMap.
Extended Data Fig. 3 |
Extended Data Fig. 3 |. Flowchart for cryo-EM data processing of membrane-bound S-OPA1 assembly.
Details can be found in the image analysis and 3D reconstruction section of the Methods.
Extended Data Fig. 4 |
Extended Data Fig. 4 |. Crosslinks between all OPA1 subunits in membrane-bound conformation.
a, b, Chemical cross-linking and mass spectrometry reveals protein-protein interaction (PPI) maps of the human S-OPA1 polymers. Circular plot showing the distribution of DSG (a) and DSS (b) chemical crosslinks mapped to human OPA1 represented as coloured circles with amino acid positions labelled. Orange bars indicate the positions of lysine residues, and crosslinks connecting the lysine residues are represented by black lines between the corresponding amino acid pairs. c, Crosslinks that are gained (red) in the S-OPA1 polymer upon membrane binding. Identified inter-molecular crosslinks are mapped on the S-OPA1 subunits. CX-MS reveals a cluster of contacts between S-OPA1 paddle domains, indicating strong interactions in membrane-bound conformation. d, Crosslinks between all OPA1 domains. Domains are arranged based on sequence (coloured blocks). The DSG (red) and DSS (blue) crosslinks that satisfy the distance restraint (30 Å) are mapped onto the membrane-bound cryo-EM structure of human S-OPA1. Crosslinks identified in both DSG and DSS datasets are shown in purple.
Extended Data Fig. 5 |
Extended Data Fig. 5 |. Human S-OPA1 map quality, model building, and structural comparison with the yeast Mgm1.
a, Isolated S-OPA1 monomer EM density from post-processed maps showing the quality of the map, build and fit. A single view of the cryo-EM density is depicted as a semi-transparent mesh and superimposed upon the model. Examples of model fit within B-factor sharpened cryo-EM density for the alpha-helices of S-OPA1 BSE (red), stalk (blue), paddle (green) are shown in the context of the atomic model with side chains are shown as sticks and the backbone as ribbons. b, A comparative analysis of the human S-OPA1 to yeast structures deposited in the PDB using topology independent comparison server CLICK revealed that the S-OPA1 structure displays a similar topology for the GTPase, BSE, and stalk domains; however, the paddle domain adopts a novel architecture with the addition of α3P helix, which facilitates the formation of interface 7. Structural comparison of membrane-proximal conformation of human S-OPA1 (beige) to S. cerevisiae (Pink, PDB ID: 6JSJ) and C. thermophilum (Light blue, PDB ID: 6QL4) Mgm1 crystal structures. Overall, the membrane-proximal conformation of human S-OPA1 and S. cerevisiae Mgm1 align with an r.m.s.d. of 8.46 Å, and human S-OPA1 and C. thermophilum Mgm1 align with an r.m.s.d. of 10.30 Å over all Cα atoms. c, Superimposition of membrane-distal conformation of human S-OPA1 (beige), S. cerevisiae (Pink), and C. thermophilum (Light blue) Mgm1 structures. Overall, the membrane-distal conformation of human S-OPA1 superimposes with S. cerevisiae Mgm1 and C. thermophilum Mgm1 with a rmsd of ~7.3 Å over all Cα atoms. d, Multiple sequence alignment of human S-OPA1, S. cerevisiae S-Mgm1, and C. thermophilum S-Mgm1. There is ~21% sequence conservation between human and yeast proteins. Most of the residues involved in binding to membranes are not conserved (highlighted with an asterisk).
Extended Data Fig. 6 |
Extended Data Fig. 6 |. Oligomerization and liposome deformation activity of wild-type S-OPA1 and mutants visualized with EM.
To gain further insights into the molecular mechanism of OPA1-mediated membrane remodelling, we reconstituted the human S-OPA1 polymer assembly in the presence of GMPPCP and CL-enriched membranes. Negative-stain electron micrographs showing the liposome binding and remodelling activity of wild-type and mutant S-OPA1 on cardiolipin-enriched liposomes and membrane nanotubes. S-OPA1 forms well-ordered filaments that wrapped around membrane tubules. Wild-type and mutant proteins were incubated with liposomes and membrane nanotubes for four hours at room temperature prior to grid preparation. Mutations to positively charged and hydrophobic residues within the membrane docking region, membrane-inserting loop (MIL), membrane-facing surface, and interface 7 resulted in severe defects in membrane binding and remodelling activity of human S-OPA1. Inset, close-up views of selected liposomes and membrane nanotubes. Images were taken in technical triplicate. Scale bars, 100 nm.
Extended Data Fig. 7 |
Extended Data Fig. 7 |. Liposome co-sedimentation experiments.
a, Representative SDS-PAGE gels showing the sedimentation of S-OPA1 WT and mutants in the presence and absence of CL-enriched liposomes. The samples were derived from the same experiment and analysed using multiple gels in parallel. P, pellet; S, supernatant; WT, wild type; MIL, membrane-inserting loop. b, c, Gel quantification depicting the relative amount of S-OPA1 (%) for pellet and supernatant fractions without liposomes (b) and with liposomes (c) in the co-sedimentation assays. The bar graphs represent the quantification of the Coomassie-stained protein bands from three biological replicates and expressed as mean ± s.e.m. Two-tailed unpaired t-tests were performed on each S-OPA1 variant comparing pellet verse supernatant. P < 0.0001 (****); P = 0.0002(***) or P = 0.0003(***); P = 0.001 (**); P = 0.01 (*); ns, not significant.
Extended Data Fig. 8 |
Extended Data Fig. 8 |. Mitochondrial morphology analyses for the WT, fusion loop, and disease mutants of OPA1.
a, Fluorescence microscopy images of wild-type (WT), membrane docking (K738E, R858E), membrane-inserting loop (W771A, W775A, L776A, K779E), and disease (R781E, R824E) mutants in mitochondrial morphology analyses. HeLa cells were transfected with empty vector (E.V.) or the indicated siRNA-resistant OPA1 constructs for 24h and then subjected to RNA interference using the indicated siRNAs for 72h. The mitochondrial network was visualized by staining for the outer membrane protein TOMM22 (green), and co-transfected mCherry-NLS (red) was used to identify transfected cells. Performed in biological triplicate. Scale bar, 20 μm. b, Expression and stability of the siRNA-resistant OPA1 proteins were assessed by immunoblot analysis of Triton X-100 extracts derived from HeLa cells transfected with either empty vector (E.V.) or the indicated siRNA-resistant OPA1 constructs 24h before treatment with the indicated siRNAs for 72h. 20 μg per lane (n = 3 independent experiments). c, Quantification of microscopy images of wild-type, empty vector (E.V.), and mutants. Mitochondrial phenotypes observed in HeLa cells transiently expressing human OPA1 variants as described in a. Cells expressing the control siRNA E.V. (n = 280), OPA1 siRNA E.V. (n = 269 cells), wild-type OPA1 (n = 238 cells), OPA1 K738E (n = 235 cells), OPA1 W771A (n = 281 cells), OPA1 W775A (n = 264 cells), OPA1 W776A (n = 255 cells), OPA1 K779E (n = 282 cells), OPA1 R858E (n = 245 cells), OPA1 R781E (n = 262 cells), and OPA1 R824E (n = 283 cells) over three experimental replicates. Data points represent the average percentage of cells across three experimental replicates. Error bars indicate s.e.m. d, Human OPA1 mutations associated with optic atrophy, cerebellar ataxia, and other diseases mapped onto the paddle domain of OPA1 as solid spheres and numbered. Back and side views of the molecular structure of human S-OPA1 LBD (coloured in green).
Extended Data Fig. 9 |
Extended Data Fig. 9 |. OPA1 Mutations disrupt cristae architecture and overall mitochondrial morphology as compared to the WT.
a, Mitochondrial surface area (μm2) was calculated from ultrathin sections of cells transfected with control siRNA empty vector (E.V.) (n = 312), OPA1 siRNA E.V. (n = 444), OPA1 WT (n = 543), OPA1 membrane-inserting loop (MIL) mutant (n = 523), and OPA1 K819E (n = 516). The standard error of the mean is reported with the mean of each dataset (n = 3 technical triplicates). Due to the variation in numbers for each dataset, two-tailed Mann-Whitney statistical test was utilized to calculate the statistical significance between control siRNA E.V. to each other sample. P < 0.0001 (****). b, Quantification of the number of cristae per mitochondrion. The mean number of cristae was calculated and reported with the standard error of the mean for each sample (n = 3 technical triplicates). The control siRNA E.V. and other samples were subjected to a two-tailed Mann-Whitney test to determine the statistical significance. P = 0.0176 (*); P < 0.0001 (****). c, Quantification of the mitochondrial morphology in WT and mutant OPA1 cells. The mitochondrial shape was assigned to four different classes, oval, ellipsoidal, polygonal, or elongated, and the relative distribution of each shape was reported as a bar graph. The percentage of each shape is reported for each sample. d, Quantification of cristae morphology in WT and mutant OPA1 cells. A bar graph representing the distribution of four different cristae morphology (normal, swollen, short, or disordered) observed in respective samples as percentages. e, Representative TEM images of the mitochondrion showing different types of cristae morphology assigned to four classes: normal, swollen, short, and disordered. Images were taken in technical triplicate. Scale bar, 500 nm.
Extended Data Fig. 10 |
Extended Data Fig. 10 |. S-OPA1 membrane binding and remodelling activities cause lipid bilayer deformations.
a, Representative fluorescent microscopy images show the co-localization of Alexa Fluor 488 labelled WT S-OPA1 onto the Texas Red-DHPE-containing liposomes after approximately 30min. Experiments performed in technical triplicate. Scale bar, 0.5 μm. b, Membrane deformation assays with WT S-OPA1 and liposomes containing 0.25% Nile Red; n = 5 biologically independent experiments and expressed as mean, error bars as ± s.e.m. Statistical analysis was performed using an unpaired two-tailed Student t-test (P = <0.0001, ****), and the Grubbs test removed one outlier from each dataset. c-f, Negative stain TEM analysis of membrane reconstitution assays with c, S-OPA1 alone; d, liposomes with 0.25% Nile Red alone; e, BSA with liposomes containing 0.25% Nile Red; and f, WT S-OPA1 with liposomes containing 0.25% Nile Red. g, Membrane deformation assay with WT S-OPA1 and liposomes containing 1% NBD-PC; n = 5 biologically independent experiments and expressed as mean error bars as ± s.e.m. An unpaired two-tailed Student t-test was performed on the NBD-PC dataset (P = <0.0001, ****). h, liposomes with 1% NBD-PC alone; i, BSA with liposomes containing 1% NBD-PC; and j, WT S-OPA1 with liposomes containing 1% NBD-PC. Inset, close-up view of selected liposomes from negative-stain TEM images. Scale bar, 100 nm. It has been proposed that the outer leaflet perturbations of CL-containing large unilamellar vesicles (LUV) result in vesicle fusion. Atomic force microscopy (AFM) and fluorescence microscopy, moreover, have revealed that the incubation of yeast S-Mgm1 with labelled liposomes results in increased membrane “roughness” on the surface of liposomes. These observations indicate that the yeast ortholog Mgm1 may utilize a similar mechanism to perturb membrane properties. Together, our structural and functional analyses suggest that OPA1-mediated leaflet perturbations support the membrane remodelling activity of the protein. We note that these conclusions are based on our current structural knowledge and are limited to lipids in synthetic membranes and reconstitution assays in vitro. To what extent these findings apply to mitochondrial membrane remodelling in human cells remains elusive. Our work provides the foundation to further study the complex mechanisms that regulate mitochondrial morphology and function.
Fig. 1 |
Fig. 1 |. Model of the human S-OPA1 bound to membranes.
Lipid-binding triggers the formation of higher-order OPA1 assemblies. a, Cryo-EM image of the S-OPA1–membrane assembly and a side view of the cryo-EM density map of the membrane-bound S-OPA1 assembled in the presence of GMPPCP. Four S-OPA1 subunits forming a tetrameric assembly are coloured in orange. b, Side and back views of the molecular structure of the isolated S-OPA1 subunit. c, Schematic of the domain organization of full-length human OPA1. TM, transmembrane domain; B, BSE. L- and S-OPA1 describe the transmembrane-anchored long-form and proteolytically processed short form. Cysteine residues that form a disulfide bond are highlighted in yellow. d, Corresponding views of the structural model of the membrane-bound S-OPA1. Domains are coloured individually here and in all of the subsequent figures as in c. The GTPase, BSE and stalk domains are a conserved hallmark of the dynamin-related protein family. The GTPase domain consists of a central β-sheet surrounded by α-helices. The BSE was built of an extended three-helical bundle (α1B–α3B) that displays an amphipathic character, whereby the hydrophobic residues pack into a core and charged residues are accessible to the solvent. At the N terminus, the GTPase domain is connected to the stalk domain by the α1B of the BSE. The stalk domain of OPA1 consists of four antiparallel α-helices forming an extended bundle (α1S–α4S). The conformational changes in these domains are transmitted to the lipid-binding PD to reinforce its ability to remodel membranes.
Fig. 2 |
Fig. 2 |. Cryo-EM reconstruction of membrane-bound S-OPA1 polymer showing protein–lipid interactions.
a, A grayscale top-down view of the central slices of the reconstruction. b, Side view of the central slices of the cryo-EM density map. Dashed circles indicate the MIL (green) and membrane-docking region (blue) of S-OPA1. c, Magnified view showing the membrane-docking and MIL regions of S-OPA1 inserted in the membrane. The area indicated by a box shows the position of the MIL. d, Negative-stain TEM analyses of the WT and polyalanine MIL mutant in the presence of CL-enriched liposomes. Inset: magnified views of selected liposomes. The experiment was performed in technical triplicate. Scale bars, 100 nm. e, Fluorescence microscopy images of the WT and MIL mutant in mitochondrial morphology analyses. HeLa cells were transfected with empty vector (EV) or the indicated short interfering RNA (siRNA)-resistant (siRes) OPA1 constructs and then processed for RNA interference using the indicated siRNAs. The mitochondrial network was visualized by staining for the outer-membrane protein TOMM22 (green), and co-transfected mCherry-NLS (red) to identify transfected cells. The experiment was performed in biological triplicate. Scale bar, 20 μm. f, The expression and stability of the siRNA-resistant OPA1 proteins were assessed by immunoblot analysis of lysates derived from transfected HeLa cells. n = 3 independent experiments. Mitochondrial phenotypes observed in HeLa cells transiently expressing human OPA1 variants as described in e. g, Quantification of microscopy images is reported as the average percentage of three biological replicates for three morphological phenotypes: WT (n = 238 cells), EV (n = 238 cells) and MIL mutant (n = 238 cells). The morphological phenotypes were categorized as long tubular morphology, showing elongated and connected phenotype; fragmented phenotype, showing the mitochondrial network being completely broken apart into small network pieces; and short tubular/intermediate phenotype, showing a few elongated pieces and not as fragmented. Data are the mean ± s.e.m. percentage of cells across three experimental replicates.
Fig. 3 |
Fig. 3 |. Interface 7 of the OPA1 assembly is essential for the regulation of mitochondrial morphology.
a, Top view of the structural model of the membrane-bound S-OPA1, revealing the dimerization of PDs. Top right, magnified view of the area indicated by the dashed box showing interface 7 between two PDs. α3P helix residues involved in interface 7 formation are shown as solid spheres (yellow) and numbered. b, Negative-stain TEM analyses of WT OPA1 and the OPA1(K819E) mutant in the presence of CL-enriched liposomes. Negative-stain electron micrographs show impaired liposome binding and remodelling activity of the OPA1(K819E) mutant compared with the WT. Inset, magnified views of selected liposomes. Scale bars, 100 nm. c, Fluorescence microscopy images of WT and interface-7-mutant OPA1(K819E) in mitochondrial morphology analyses. HeLa cells were transfected with the indicated siRNA-resistant OPA1 constructs and then subjected to RNA interference using the indicated siRNAs. The mitochondrial network was visualized by staining for the outer membrane protein TOMM22 (green), and co-transfected mCherry-NLS (red) was used to identify transfected cells. The experiment was performed in biological triplicate. Scale bar, 20 μm. d, Quantification of microscopy images of OPA1 WT and the K819E mutant. Mitochondrial phenotypes observed in HeLa cells transiently expressing human OPA1 variants as described in c. The average percentage of cells belonging to each of three morphological classifications across three experimental replicates. n = 238 cells expressing WT OPA1 over three experimental replicates and n = 283 cells expressing OPA1(K819E) over three experimental replicates. Data are the mean ± s.e.m. percentage of cells across three experimental replicates. e, Expression and stability of the siRNA-resistant OPA1 proteins were assessed by immunoblot analysis of lysates derived from HeLa cells transfected with either empty vector or the indicated siRNA-resistant OPA1 constructs before treatment with the indicated siRNAs. n = 3 independent experiments.
Fig. 4 |
Fig. 4 |. Conformational changes in membrane-bound S-OPA1 result in the dissociation of the membrane-embedded fusion loop from the outer leaflet.
a, A comparison of membrane-proximal (transparent) and membrane-distal conformations (opaque) of S-OPA1 shows an approximately 20 Å shift in the GTPase domain towards a neighbouring GTPase domain density and an approximately 10 Å rotation of the PD L1P MIL towards the membrane. Additional conformational changes are also apparent for BSE and stalk domains. b, Cross-links that are only satisfied in membrane-proximal (blue) and membrane-distal (red) conformations of membrane-bound S-OPA1. Identified cross-link pairs are mapped on the S-OPA1 subunits and described as positions 1 and 2. c, Structural comparison of the membrane-proximal and membrane-distal conformations of the S-OPA1 polymer. The cryo-EM structures have the models placed in the density. In membrane-distal conformation, the PD is moved away from the outer leaflet creating a gap of about 25 Å between the membrane-facing surface of the PD and the lipid bilayer. The area indicated by a box is a magnified in d. d, Magnified views of the PD–membrane interface in membrane-distal conformation. The top view of the central slices indicates the positions of lipid-binding sites. Bound lipids at the protein–membrane contact sites are identified as CL, and the acyl tails are truncated according to the map density. CL molecules flanking PDs are shown in grey. The PD residues associated with lipids include two arginine residues (Arg857, Arg858) and one lysine residue (Lys779) and are numbered accordingly.
Fig. 5 |
Fig. 5 |. Proposed mechanism of OPA1-mediated mitochondrial IM fusion.
Human L-OPA1 molecules embedded on the surface of the mitochondrial IM may nucleate helical polymerization of MIL-embedded S-OPA1 to drive IM tubulation. Subsequent conformational changes within the OPA1 lattice extract the PD, further constricting the IM and introducing lipid-packing defects to lower the energy barrier to fusion. The diagram was created using BioRender.

References

    1. Wai T & Langer T Mitochondrial dynamics and metabolic regulation. Trends Endocrinol. Metab. 27, 105–117 (2016). - PubMed
    1. Quintana-Cabrera R & Scorrano L Determinants and outcomes of mitochondrial dynamics. Mol. Cell 83, 857–876 (2023). - PubMed
    1. Eisner V, Picard M & Hajnóczky G Mitochondrial dynamics in adaptive and maladaptive cellular stress responses. Nat. Cell Biol. 20, 755–765 (2018). - PMC - PubMed
    1. Olichon A et al. Loss of OPA1 perturbates the mitochondrial inner membrane structure and integrity, leading to cytochrome c release and apoptosis. J. Biol. Chem. 278, 7743–7746 (2003). - PubMed
    1. Griparic L, van der Wel NN, Orozco IJ, Peters PJ & van der Bliek AM Loss of the intermembrane space protein Mgm1/OPA1 induces swelling and localized constrictions along the lengths of mitochondria. J. Biol. Chem. 279, 18792–18798 (2004). - PubMed

Publication types

LinkOut - more resources