. 2023 Aug;620(7976):1080-1088.
doi: 10.1038/s41586-023-06464-z. Epub 2023 Aug 23.

Non-cell-autonomous cancer progression from chromosomal instability

Affiliations

Non-cell-autonomous cancer progression from chromosomal instability

Jun Li et al. Nature. 2023 Aug.

Abstract

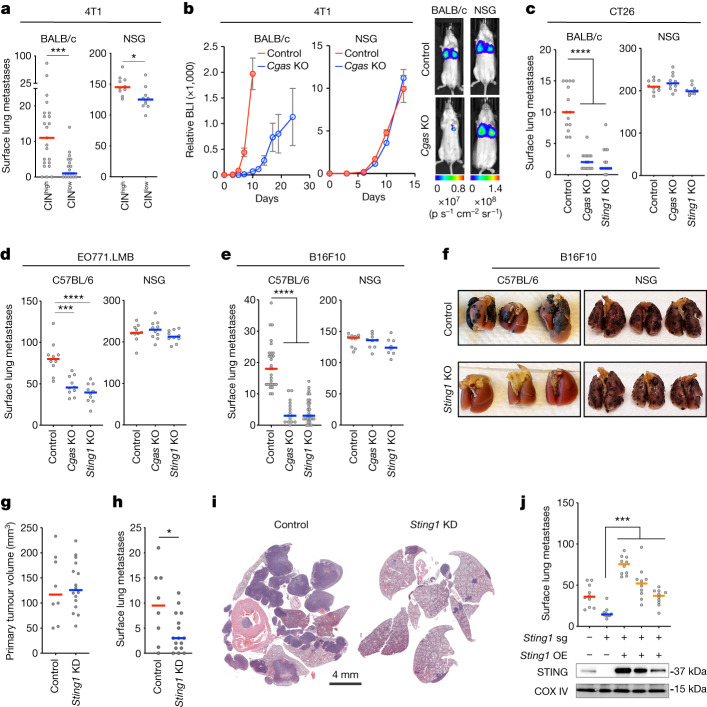
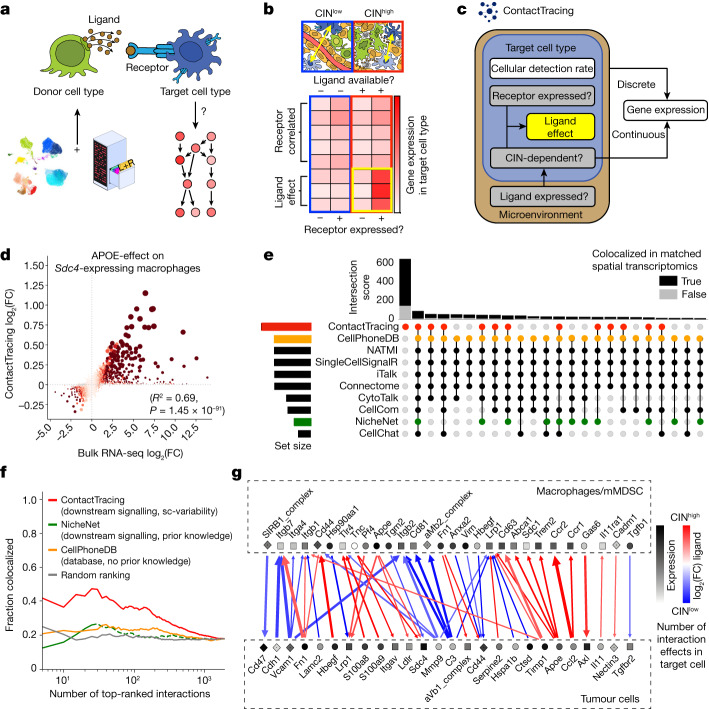
Chromosomal instability (CIN) is a driver of cancer metastasis1-4, yet the extent to which this effect depends on the immune system remains unknown. Using ContactTracing-a newly developed, validated and benchmarked tool to infer the nature and conditional dependence of cell-cell interactions from single-cell transcriptomic data-we show that CIN-induced chronic activation of the cGAS-STING pathway promotes downstream signal re-wiring in cancer cells, leading to a pro-metastatic tumour microenvironment. This re-wiring is manifested by type I interferon tachyphylaxis selectively downstream of STING and a corresponding increase in cancer cell-derived endoplasmic reticulum (ER) stress response. Reversal of CIN, depletion of cancer cell STING or inhibition of ER stress response signalling abrogates CIN-dependent effects on the tumour microenvironment and suppresses metastasis in immune competent, but not severely immune compromised, settings. Treatment with STING inhibitors reduces CIN-driven metastasis in melanoma, breast and colorectal cancers in a manner dependent on tumour cell-intrinsic STING. Finally, we show that CIN and pervasive cGAS activation in micronuclei are associated with ER stress signalling, immune suppression and metastasis in human triple-negative breast cancer, highlighting a viable strategy to identify and therapeutically intervene in tumours spurred by CIN-induced inflammation.


Conflict of interest statement

S.F.B. holds a patent related to some of the work described targeting CIN and the cGAS–STING pathway in advanced cancer. He owns equity in, receives compensation from, serves as a consultant for, and serves on the Scientific Advisory Board (SAB) and Board of Directors (BOD) of Volastra Therapeutics Inc., and serves on the SAB of Meliora Therapeutics. E.E.P. has served as a consultant for Boehringer Ingleheim. B.I. is a consultant for or received honoraria from Volastra Therapeutics, Johnson & Johnson/Janssen, Novartis, Eisai, AstraZeneca and Merck. H.W. is an advisor for AstraZeneca and received honoraria from Roche. J.S.R.-F. consults for Goldman Sachs, Bain Capital, Repare Therapeutics, Personalis, Saga Diagnostics and Paige.AI; serves on the SAB of Repare Therapeutics, VolitionRx, Paige.AI, AstraZeneca, MSD, Personalis and Daiichi Sankyo; and serves on the BOD of Grupo Oncoclínicas. S.B., J.J.H. and B.T. are employees of and own equity in Volastra Therapeutics Inc. C.G. consults for Cellino Biotech and Gardian Bio. The remaining authors declare no competing interests.

Figures

Fig. 1
Fig. 1. CIN drives cancer progression through tumour cell non-autonomous mechanisms.
a, Number of surface lung metastases arising from orthotopically transplanted and resected CINhigh or CINlow 4T1 tumours in BALB/c hosts (n = 19 and 23 animals for CINlow and CINhigh, respectively) or from tail-vein-injected CINhigh or CINlow 4T1 cells in NSG hosts (n = 10); bars represent the median; ***P < 0.001, *P < 0.05, two-sided Mann–Whitney test. b, Normalized bioluminescence (BLI) signal from BALB/c or NSG mice tail-vein injected with 4T1 control and Cgas-KO cells (n = 10 animals per condition) and representative bioluminescence images on days 5 and 8 for BALB/c and NSG mice, respectively; mean ± s.e.m. ce, Number of surface lung metastases upon tail-vein injection of control, Cgas-KO or Sting1-KO CT26 (c), EO771.LMB (d) or B16F10 cells (e) into immune competent hosts (BALB/c for CT26, C57BL/6 for EO771.LMB and B16F10) or NSG hosts; ****P < 0.0001, ***< 0.001, two-sided-Mann–Whitney test; n = 8–29 mice per group. f, Representative lung images from C57BL/6 or NSG animals tail-vein-injected with control or Sting1-KO B16F10 cells. g, Volume of resected orthotopically transplanted control and Sting1-depleted primary 4T1 tumours; n = 8–16 mice per condition. h, Number of surface lung metastases in animals arising after tumour resection; lines in the plot represent the median; *P < 0.05, two-sided t-test after testing for normality. i, Representative haematoxylin and eosin (H&E)-stained lungs 3 weeks after resection of control or Sting1-depleted orthotopically transplanted 4T1 tumours. j, Number of surface lung metastases arising from tail-vein injection of 4T1 control, Sting1-KO and Sting1-KO cells with exogenous overexpression (OE) of STING and immunoblot for STING and CoxIV of the cells; lines in the plot represent the median; ***P < 0.001, two-sided Mann–Whitney test. KD, knockdown; p s−1 cm−2 sr−1, photon second–1 centimeter–2 steradian–1; sg, single guide. Source Data
Fig. 2
Fig. 2. CIN-induced STING signalling engenders an immune-suppressive tumour microenvironment.
a, Uniform manifold approximation and projection (UMAP) of all single cells coloured by cell subtype assignment; includes carcinoma, as well as immune and other stromal cell types within the TME (n = 39,234 cells). Macro cell-type assignments are capitalized. Inset, schematic showing that tumour cell rates of CIN were genetically dialled-up or dialled-down. b, Strip plot showing CIN-dependent effects on differential abundance, log2(fold change (FC)), at the neighbourhood level grouped by cell subtype and ranked by mean log2(FC) within each cell subtype. Node opacity is scaled by P value, such that more significant neighbourhoods are more opaque and P ≤ 0.1 neighbourhoods are completely opaque. cDC, classical dendritic cells; pDC, plasmacytoid dendritic cells; Treg, regulatory T cells.
Fig. 3
Fig. 3. ContactTracing infers conditionally dependent ligand effects in vivo from single-cell variability.
a, ContactTracing infers the effect of ligand–receptor-mediated interactions on target (receptor-expressing) cells. (b) Inferences are based on intrinsic biological variability in receptor expression on target cells and ligand abundance in the TME; we focus on CIN- and STING-dependent ligand effects. c, Plate diagram of the ContactTracing Hurdle model. Plates represent the conditional dependence of variables within the TME and within a target cell population. Hurdle models are fitted using MAST, which splits models into discrete and continuous components. White boxes depict variables predicted by MAST, and grey boxes indicate variables that ContactTracing calculates to identify CIN-dependent ligand effects (yellow box). d, Correlation between APOE effect on macrophages inferred from single-cell variability (ContactTracing) and defined through bulk RNA-seq comparison of ligand-treated versus untreated macrophages. Each node represents a gene; log(FC) expression in bulk RNA-seq (x axis) as compared with that inferred from scRNA-seq (y axis) for APOE receptor, Sdc4. Node size is proportional to −log10(FDR) of scRNA-seq target test, and node colour is proportional to −log10(FDR) of bulk RNA-seq test for differential expression. R2 is Pearson’s correlation coefficient; P value is two-sided and testing for correlation. e, UpSet plot showing intersection between top 1,000 interactions (each defined by a unique receptor and target cell type) predicted by ContactTracing and other cell–cell interaction methods in human TNBC samples, for which there exist matched single-cell and spatial transcriptomics data. Histogram shows fraction of significantly colocalized interactions in a 200-μm radius on matched spatial transcriptomics data (Methods) for each set. f, Colocalization of non-secreted interactions within a 50-μm visium spot, reported as a function of number of top-ranked interactions. Each interaction is defined by [ligand, receptor, target cell type], and is designated as colocalized by a nominal one-sided permutation-based P < 0.05; fraction colocalized was assessed for ContactTracing (considers downstream signalling, no prior knowledge), CellPhoneDB (no downstream signalling), NicheNet (prioritizes interactions exhibiting downstream signalling based on prior knowledge) and for randomly ranked interactions as a function of number of top interactions. Lines represent the average fraction of colocalized interactions across four patient tumours with matched spatial transcriptomics data. Dotted lines represent interactions that did not pass prefiltering steps of NicheNet or CellPhoneDB; these interactions were sorted randomly and assigned the lowest score. g, CIN- and STING-dependent interactions between tumour cells and macrophages, predicted by ContactTracing. Significant interactions are defined by receptor-expressing target cells that exhibit at least 10 significant interaction effects (FDR < 0.25) when the cognate ligand is conditionally available in the TME, ligand abs(log2(FC)) > 0.12 at FDR < 0.05, with log2(FC) having the same sign for both the CIN and STING comparisons. abs, absolute; mMDSC, myeloid-derived suppressor cell; sc-variability, single cell-variability.
Fig. 4
Fig. 4. ContactTracing identifies ER stress as a central mediator of CIN-induced immune suppression.
a, ContactTracing Circos plot highlighting all CIN- and STING-dependent interactions. Each segment represents a cell type, and cell types are further divided into ligands and receptors, which are ordered according to the first diffusion component (DC1) computed on differentially expressed genes (DEGs) in each cell type conditioned on ligand/receptor expression. Outer rings encode CIN-dependent interactions, which include target (receptor-expressing) cells distinguished by ≥10 CIN-dependent interaction effects (two-sided P value, FDR Q value < 0.25), as well as CIN-dependent ligands complementing those receptors (FDR Q value < 0.05 and abs(log2(ligand expression FC) > 0.12)). The outer circle represents cell type. The next circle shows the DC1 score for ligand/receptor represented at that coordinate; for example, macrophage response states were organized from pro-inflammatory to anti-inflammatory polarization states. The next circle shows the correlation between the log-normalized expression of that ligand/receptor and its CIN-dependent differential abundance (log2(FC) as computed by Milo in local neighbourhoods and mapped to single cells as the described in the Methods). The histogram in the next inner circle shows the number of significant CIN-dependent interaction effects (FDR Q value < 0.25). Ribbons in the middle link interacting [ligand, donor cell type] and [receptor, target cell type] pairs; ribbon thickness is proportional to the number of genes exhibiting a CIN- and STING-dependent interaction effect (whichever is greater) and colour represents CIN- and STING-dependent log2(FC) of its complementary ligand measured in the donor cell type (whichever is greater). Links are only shown if they exhibit (1) CIN- and STING-dependent expression of ligand in donor cells (in the same direction with FDR Q value < 0.05 and abs(log2(expression FC) > 0.12)) and (2) at least 10 CIN-dependent and 10 STING-dependent interaction effects in the target cell type. Ligands/receptors are labelled at ribbon ends; ligands are in black and receptors in grey. The data encoded in the ContactTracing Circos plot are provided in Supplementary Table 9 and may be explored interactively at http://contacttracing.laughneylab.com/circos. b, Differentially expressed pathways associated with CIN- and STING-dependent, tumour-derived ligands that effect the TME with nominal P < 0.05. The y axis is scaled by −log10(P values) times the sign of the odds ratio and colour indicates the pathway odds ratio. c, Bar plot highlighting CIN- and STING-dependent tumour-derived ligands that affect the TME, as described in a. d, Schematic illustrating the impact of chronic STING activation on functions associated with ligand effects.
Fig. 5
Fig. 5. Chronic STING activation promotes IFN tachyphylaxis and ER stress-dependent transcription.
a, Immunoblots for BiP, CHOP, phosphorylated PERK, total PERK, phosphorylated eIF2α, total eIF2α and ATF4 of 4T1 WT and Sting1-KO cells at indicated time points post TM treatment with α-tubulin as loading control. b, Number of surface lung metastases in BALB/c or NSG mice that were tail-vein-injected with control 4T1 cells or cells lacking key mediators of the ER stress response; bars represent the median; ****P < 0.0001, two-sided Mann–Whitney test; n = 12–24 and 10 animals per group for the BALB/c and NSG injected hosts, respectively. c, Survival of C57BL/6 mice upon tail-vein inoculation of WT or Sting1-KO B16F10 cells with C-176 or a corresponding vehicle control, log-rank test; ***P < 0.001; n = 15 animals per arm. d, Relative expression levels of ISGs and ER stress/NF-κB target genes at indicated time points after the first (blue) and the fifth (red) cGAMP stimulations of IMR90 human lung fibroblasts. e, Representative images from the same TNBC tumour stained using DAPI (DNA), anti-cGAS and anti-STING antibodies, illustrating the inverse correlation between the frequency of cGAS+ micronuclei and STING expression in cancer cells. f, DMFS of patients with TNBC stratified based on tumour cGAS and STING expression intensity, log-rank test; n = 159 patients. g, Schematic illustrating the functional consequences of acute and chronic STING signalling. Source Data
Extended Data Fig. 1
Extended Data Fig. 1. CIN-induced cGAS–STING activation drives metastasis in immunocompetent models.
a, Representative images of 4T1 TNBC cells undergoing anaphase with various chromosome segregation defects stained using DAPI (DNA) and anti-centromere antibody (ACA), scale bar 5 μm. b, Frequency of anaphase cells with chromosome segregation defects in poorly metastatic (B16F0 and B16F1) and highly metastatic (B16F10, 4T1, EO771.LMB and CT26) cells; bars represent average ± SD, **** p < 0.0001, two-sided t-test, n = 3 independent counting per cell line, ~ 150 division events per counting. c, Percentage of micronuclei in the various cell lines; bars represent median, **** p < 0.0001, two-sided Mann-Whitney test, n = 5–17. d, cGAMP levels in cell lysates; bars represent median values, * p < 0.05, ** p < 0.01, two-sided Mann-Whitney test, n = 5–12. e, Immunoblots for cGAS and STING of control, Cgas-KO, and Sting1-KO B16F10, 4T1, and CT26 cells with β-Actin as a loading control. f, Representative images of B16F10, CT26, 4T1 and EO771.LMB cells with micronuclei stained using DAPI (DNA) and anti-cGAS antibody, scale bar 5 μm. g, Percentage of 4T1 cells undergoing anaphase with evidence for chromosome missegregation, bars represent mean ± SD, n = 150 cells in 3 biological replicates, **** p < 0.0001, two-sided t-test. h, Experimental schema for metastasis experiments. i, The number of surface lung metastasis metastases arising after 4T1 tumor resection in BALB/c hosts (n = 14–25) or arising from tail-vein injection of 4T1 cells into NSG hosts (n = 10); lines in the plot represent the median, * p < 0.05, **** p < 0.0001, two-sided Mann-Whitney test. j, Volume of resected orthotopically transplanted primary 4T1 tumors; bars represent median values, ** p < 0.01, two-sided Mann-Whitney test, n = 14–15 animals per group. k, Immunoblots of cGAS and STING of control and Sting1-depleted 4T1 cells with β-actin as a loading control. l, Violin plot showing the distribution of tumor cell CNV diversity (Methods) in CINlow (n = 4) and CINhigh (n = 9) murine tumor samples (one-sided t-test p-value <0.05). Overlaid box plots denote the minima, maxima, median, and 1st and 3rd quartiles. Source Data
Extended Data Fig. 2
Extended Data Fig. 2. CIN and STING dependent effects on the tumor myeloid landscape.
a, Percentage of M2 macrophage among total infiltrating CD45+ cells in CINlow and CINhigh 4T1 primary tumors resected on day 14; bars represent mean ± s.e.m., two-sided Mann-Whitney test, n = 5 independent biological replicates. b, Percentage of GR-MDSC among total infiltrating CD45+ cells in CINlow and CINhigh 4T1 primary tumors resected on day 14; bars represent mean ± s.e.m., two-sided Mann-Whitney test, n = 5 independent biological replicates. c, Myeloid population strip plot showing conserved CIN- and STING-dependent differential abundance effects (mean enrichment must be both positive or both negative) at the neighborhood level grouped by cell subtype and ranked by mean CIN-dependent log2(fold change) of neighborhoods within each cell subtype. Node size is scaled by p-value, so that more significant differential abundance neighborhoods are larger. Bar plots show the mean log2(fold change) of neighborhoods with significant scores (p-value <= 0.1); if fewer than two significant neighborhoods are detected, all neighborhoods are used in computing the mean. d, Force-directed layout with transition vectors of all macrophages (n = 9,800 cells) colored by CIN-dependent differential abundance computed in local neighborhoods using Milo and mapped to single cells for visualization (Supplementary Information, top) and cell subtype (bottom). The overlayed directed partitioned-based graph abstraction (PAGA) shows the inferred transitions between subtype clusters based on Palantir pseudotime with nodes scaled by relative subtype size and arrows scaled by transition confidence. The overlaid black nodes show cells with Monocyte probability >=95%, computed by CellAssign; the green node highlights the initial seed cell for Palantir pseudotime. e, Scaled imputed expression of transition genes (Supplementary Information) for all macrophages (n = 9,800 cells) ranked along pseudotime. For each gene, expression was modeled using a generalized additive model (GAM) along the M2-like macrophage lineage. Ranked color bars above heatmap show CIN- and STING-dependent differential abundance, log2(fold change), computed in local neighborhoods using Milo and mapped to single cells for visualization (Supplementary Information). Additional ranked color bars below the heatmap show CellRank terminal state probability and initial state probability along macrophage pseudotime. The bar plot shows top two most enriched gene signatures enriched along macrophage pseudotime (FDR < 0.005). The x-axis shows the −log10(FDR q-value) times the sign of the pathway normalized enrichment score (NES) and color indicates the pathway NES. Complete list of genes and gene set enrichment analysis (GSEA) results for cells ranked along macrophage pseudotime, including nominal and corrected p-values, are provided in Supplementary Table 8. f, Relative expression of Arg-1 in macrophages cultured for 24 h with conditioned medium from 4T1 tumor cells; bars represent mean ± s.e.m., two-sided t-test, n = 4 independent biological replicates. g, Scaled imputed expression of transition genes (Supplementary Information) for all ISG-Neutrophils and GR-MDSCs (n = 12,593 cells) ranked along CellRank ISG-Neutrophil macrostate probability. For each gene, expression was modeled using a generalized additive model (GAM) as in (e). Ranked color bars above heatmap show CIN- and STING-dependent differential abundance, log2(fold change), computed in local neighborhoods using Milo and mapped to single cells for visualization (Supplementary Information). Additional ranked color bars below the heatmap show CellRank ISG-Neutrophil macrostate and GR-MDSC(a) macrostate probabilities ranked by ISG-Neutrophil macrostate probability. The bar plot shows top gene signatures enriched along ISG-Neutrophil macrostate probability with FDR < 0.05 and abs(NES) > 2.5. The x-axis shows the −log10(FDR q-value) times the sign of the pathway normalized enrichment score (NES) and color indicates the pathway NES. Complete list of genes and gene set enrichment analysis (GSEA) results for cells ranked along macrophage pseudotime, including nominal and corrected p-values, are provided in Supplementary Table 8. h, UMAP projection for the dendritic cell subset (n = 1,075 cells) colored by DC subtype (top) and imputed IL12b expression (bottom). i, Left, dot plot showing relative frequency of dendritic cells expressing canonical lineage markers (any counts detected) and the average log-transformed expression of each gene per dendritic cell subtype. Genes are clustered using the average cosine distance and subtypes are ordered according to (middle) average CIN-dependent differential abundance of local neighborhoods mapped to dendritic cell subtypes (Supplementary Information). Complete DEG and GSEA results per dendritic cell subtype (relative to all other dendritic cells), including nominal and corrected p-values, are provided in Supplementary Table 8. Right, Example of IFN-promoting feedback loop between antigen presenting cells (APCs) and T cells. Source Data
Extended Data Fig. 3
Extended Data Fig. 3. CIN and STING dependent effects on the tumor lymphoid landscape.
a, Force-directed layout with transition vectors of all CD8+ T cells color by subtype (n = 4,797 cells). The overlaid, directed PAGA shows inferred transition between subtype clusters based on Palantir pseudotime with nodes scaled by subtype size and arrows scaled by transition confidence. b, Activated (top) and dysfunctional (bottom) gene trends along CD8+ T cell pseudotime using scaled imputed expression modeled by a GAM. Complete list of correlation-ranked genes and GSEA results along CD8+ T cell pseudotime, including nominal and corrected p-values, are provided in Supplementary Table 8. c, Strip plot showing CIN- (circular nodes) and STING- (triangle nodes) dependent differential abundance at the neighborhood level grouped by cell subtype. Node size is scaled by p-value, so that more significant differential abundance neighborhoods are larger. Bar plots show the mean log2(fold change) of neighborhoods with significant (p-value <= 0.1) differential abundance scores; if fewer than two significant neighborhoods detected, all neighborhoods are used in computing the mean. d, Radar plot showing relative expression of key marker genes per condition in CD8+ T cells. Gene expression is normalized by 1 or the max average marker expression across all conditions, whichever is higher. e, Percentage of 4T1 cells killed after co-cultured with T cells, CD8+ T cells, and natural killer cells, number of immune cells migrating from the upper compartment to the bottom compartment where 4T1 tumor cells seeded; bars represent mean ± s.e.m., two-sided t-test, n = 4 (T cells), 3 (NK cells), 2 (CD8+, no error bar), or 3 (migration). f, Clustered heatmap showing the normalized enrichment score (NES) of relevant gene signatures differentially expressed within B cell subtypes (relative to all other B cells) with an FDR q-value < 0.05 in at least one subtype. Signatures not meeting the FDR q-value threshold are opaque. Complete DEG and GSEA results per B cell subtype (relative to all other B cells), including nominal and corrected p-values, are provided in Supplementary Table 8. g, Same as (c), but for B cell subtypes and ordered by mean CIN-dependent log2(fold change).
Extended Data Fig. 4
Extended Data Fig. 4. ContactTracing inference of cell-cell interactions from single cell data.
a, Illustrative histogram showing log-transformed expression of the Mrc1 receptor in Macrophages (target cell type) for the receptor-null (white) and receptor-expressing (gray) subsets. b, Volcano plot showing genes differentially expressed in Mrc1-expressing vs. Mrc1-null macrophages (target cell type). Nodes are scaled by the absolute value of the transcriptional response score; top up- and down-regulated genes are labeled. c, Visual summary of MAST results from the CIN-dependent interaction test (see Methods); shown here for Mrc1 receptor expression in macrophage target cells. Each node represents a highly variable gene. The x-axis shows the log2-fold change estimate in receptor-expressing vs. receptor-null target cells in the CINlow condition. The y-axis shows the same parameter estimate, but computed in the CINhigh condition. Node size is proportional to the significance of the interaction effect, and the node color represents the magnitude of the interaction effect, which here shows CIN-dependent amplification of the transcriptional response. d, Each node represents a receptor/cell type combination, on the x-axis is the number of genes with significant transcriptional response (FDR < 0.05) in the CINhigh/CINlow dataset; on the y-axis is the same value for the CINhigh Sting1WT/Sting1KD data set. e, As in d, except the number of genes with significant conditionally-dependent interaction effect (FDR < 0.05) is shown. f, UMAP projection based on STING-dependent interaction effects in CINhigh tumors. The effect matrix has a row for each receptor/cell-type combination with at least one significant interaction effect (FDR q-value < 0.05), and a column for every gene. Each entry in the matrix is −log10(p-value)*interaction_coef. Node color reflects the cell type in which the ligand effect is measured and node size reflects the number of significant condition-specific interaction effects in target cells expressing the receptor. g, Transcriptional response states are mapped to individual cell clusters by taking the dot-product between the transcriptional response score for a given gene (given by x-axis) and its log2(expression fold change), here shown for one tumor subcluster vs. all other tumor cells (y-axis) and visualized using a clustered heatmap based on the average Euclidean distance metric. Red: positive dot-product, blue: negative dot-product, white: any value with abs(dot product) < 0.5. The log2(expression fold change) was set to zero if it was not significant (FDR q-value > 0.15) prior to computing the dot product. h, ContactTracing network plot corresponding to data in Fig. 4a. Here, nodes represent cell subtypes; node size is scaled by their relative fraction in the TME, and color reflects their average CIN-dependent differential abundance. Directed arrows represent interactions between cell subtypes (emanating from ligand-producing, donor cell subtype to receptor-expressing, target cell subtype), with arrow thickness encoding the total number of CIN-dependent interactions predicted between each pair of subtypes, and arrow darkness reflecting the number of STING-dependent interactions.
Extended Data Fig. 5
Extended Data Fig. 5. ContactTracing validation.
a, ContactTracing-predicted ligand effect in CCR2-expressing macrophages ranked and scaled by observed log2(fold change). Known target genes are annotated in vivo if defined in, or in vitro if within the top or bottom 20 responses reported in the CytoSig databases (ranked based on log2(fold change) of cytokine-treated cell lines in culture). b, Illustration of connectivity score used to compare ligand effects inferred by ContactTracing to the those reported in the CytoSig database (tests whether up-regulated genes in one list are also up-regulated in another, Methods). c, Distribution of connectivity scores between all CIN-dependent interaction effects predicted by ContactTracing compared to gene responses reported by CytoSig for ligands matching the same set of receptors in cell types relevant to the breast cancer TME (Methods); the left box shows the distribution of connectivity scores across all comparisons (n = 558). The right box shows enrichment of connectivity scores for comparisons with matched receptors in similar macro cell types (n = 44, two-sided Mann-Whitney test, p = 0.003). The boxes span the 1st–3rd quartiles, with red line indicating the median, whereas whiskers denote the rest of distribution within 1.5x the interquartile range, other outliers indicated with an x d, Volcano plot showing differentially expressed genes induced by APOE treatment of macrophages in vitro (bulk sequencing of treated vs. untreated macrophages) e, As in Fig. 3d, compares the effect of APOE on macrophages inferred by ContactTracing as compared to ligand effect measured in bulk for two additional, expressed receptors that compliment APOE (Sdc1 and Ldlr). R2 is Pearson’s correlation coefficient, p-value is two-sided and testing for correlation.
Extended Data Fig. 6
Extended Data Fig. 6. ContactTracing benchmarking.
a, Clustered Heatmap of the overlap coefficient between top 1,000 CIN-dependent interactions predicted by ContactTracing and existing methods for inferring cell-cell interactions from single cell data. Alternate tools were run (Methods) using the same ligand-receptor database as ContactTracing with “differential” workflows when possible, and results were aggregated and ranked by using the best score for every receptor/cell type combination regardless of ligand source. b, Distributions of rank differences between the top CIN-dependent interactions predicted by ContactTracing and other methods for inferring cell-cell interactions from single cell data. Rank differences are included for top 1000 interactions (unless fewer detected, exceptions listed) predicted by the following methods: CellChat (n = 116 interactions), CellComm (n = 282 interactions), NicheNet (n = 746 interactions), Differential Connectome, NATMI, CytoTalk (n = 788 interactions), iTALK, CellPhoneDB, SingleCellSignalR, and Connectome. Boxes range from 1st to 3rd quartile, with median indicated, and whiskers extending to min/max of each distribution (there were no outliers). c, Co-localization was determined by summing the product of log10(ligand expression), probability(receptor cell type) and indicator(receptor expressed) per spot in each sample, and computing a one-sided p-value by comparing this value to 100 permutations in which ligand expression is permuted in the spatial data; co-localized interactions have p < 0.05.
Extended Data Fig. 7
Extended Data Fig. 7. ER stress signaling enriched in mesenchymal stem-like tumor cells.
a, Directed bar plot showing relevant tumor gene signatures (annotated in Supplementary Table 7) differentially expressed in a CIN-dependent manner (FDR < 0.25). The x-axis shows the -log10(FDR) and bar color is scaled by the normalized enrichment score (NES) of the gene signature. b, Force-directed layout of all tumor cells (n = 3,596 cells) colored by Louvain subtype. c, Dot plot showing relative frequency of tumor cells expressing canonical stem cell and lineage markers (any counts detected) and the average log-transformed expression of each gene per subtype. Hierarchical clustering of genes and subtypes is computed using the complete linkage of the Pearson correlation matrix. Average expression of Hallmark Unfolded Protein Response (annotated in Supplementary Table 7) for all cells per tumor subtype (right). d, Clustered heatmap showing the normalized enrichment score (NES) of gene signatures differentially expressed within at least one tumor subtype, having a positive NES with FDR < 0.001. Signatures not meeting the FDR threshold are opaque. Complete DEG and GSEA results per tumor cell subtype (relative to all other tumor cells), including nominal and corrected p-values, are provided in Supplementary Table 8. e, Force-directed layout with transition vectors of all tumor cells colored by average log-transformed expression of the Hallmark Unfolded Protein Response (UPR) gene signature. Overlayed arrows show two major branches from a more mesenchymal stem-like phenotype to a more luminal or basal state. f, Z-normalized average imputed expression of Unfolded Protein Response/ER stress related genes across tumor subclusters. Genes groups are organized according to transcriptional arms of the Unfolded Protein Response to ER stress and clustered within gene groups using the average cosine distance. Tumor subtypes are hierarchically clustered using the average Euclidean distance. Right, strip plots showing CIN- and STING-dependent differential abundance (two pairwise-comparisons), log2(fold change), of tumor subpopulations ranked along the subtype hierarchically clustering (left). Node opacity is scaled by p-value, so that more significant differential abundance neighborhoods are darker. Bar plots show the mean log2(fold change) of neighborhoods with significant (p-value <= 0.1) differential abundance scores; if fewer than two significant neighborhoods detected, all neighborhoods are used in computing the mean.
Extended Data Fig. 8
Extended Data Fig. 8. Tumor progression through STING-dependent ER stress response.
a, Relative expression levels of Ifnb1 and ISGs in mock, cGAMP, or Poly(I:C)-transfected 4T1 cells; bars represent mean ± SD, two-way ANOVA test, n = 3 independent experiments (n = 2 for Poly(I:C)-treated), each with two technical replicates. b-c, Immunoblots for BiP and STING of WT and Sting KO cells of B16F10, CT26 (b) and EO771.LMB (c) with β-actin (b) or COX-IV (c) as loading control. d, Cellular growth curves for of Control and IRE1α (Ern1), PERK (Eif2ak3), or ATF6 (Atf6)-KO 4T1 cells; data are presented as mean values ± SD., n = 3 per condition. e, Immunoblots of Control and IRE1α (Ern1), PERK (Eif2ak3), or ATF6 (Atf6)-KO 4T1 cells blotted for IRE1a, PERK, ATF6, and α-tubulin as a loading control. f, Relative expression levels of Ccl2, Cxcl1, and Il11 in tumor cells isolated from primary tumors resected on day 7; bars represent mean values ± SD, * p < 0.05, ** p < 0.01, two-sided t-test, n = 4 animals per group. g, Number of surface lung metastasis in mice inoculated with control 4T1 cells or cells lacking cytokines (left) or Sting1-depleted cells or Sting1-depleted cells overexpressing cytokines (right); bars represent the median, ** p < 0.01, two-sided Mann-Whitney test, n = 10 animals per group. Source Data
Extended Data Fig. 9
Extended Data Fig. 9. Pharmacological suppression of STING and ER stress attenuates tumor progression.
a–d, Abundance of Gr-MDSCs (a), NK-cells (b), CD8+ T-cells (c), and M2-like macrophages (d) in freshly resected CINhigh 4T1 14-day-old tumors treated with vehicle or AMG44 a PERK inhibitor; bars represent mean values ± s.e.m, * p < 0.05, ** p < 0.01, 2-sided t-test, n = 4 (vehicle) or 7 (AMG44). e, Immunoblots for CHOP and BiP in 4T1 cells with or without tunicamycin treatment in the presence STING inhibitor C-176 or vehicle with β-actin as loading control. f, Relative Ccl2 production levels in vehicle and H-151 treated 4T1 cells; bars represent mean ± SD, **** p < 0.0001, two-sided Welch’s t test, n = 8. g, Gene-set enrichment analysis (GSEA) results showing HALLMARK gene sets that are differentially enriched between vehicle and C-176-treated B16F10 cells, one-sided weighted Smirnov-Kolmogorov test corrected for multiple tests. h, Animal survival upon tail vein inoculation of CT26 or 4T1 cells in BALB/c hosts that were treated with C-176, H151 or a corresponding vehicle control, two-sided log-rank test, n = 15 animals per experimental arm. i, The number of surface lung metastases after tail vein inoculation of CT26 cells; bars represent median values, * p < 0.05, two-sided Mann-Whitney test, n = 12-13 animals per group. Source Data
Extended Data Fig. 10
Extended Data Fig. 10. Repetitive cGAMP stimulation reveals signal re-wiring downstream of STING.
a, Relative expression levels of Ifnb1 and ISGs in mock, cGAMP, or Pol(I:C)-transfected 4T1 cells; bars represent mean, n = 3 independent experiments (n = 2 for Poly(I:C)-treated), each with two technical replicates. b, Relative expression level of ER-stress genes in IMR90 cells after the fifth cGAMP stimulation in the presence of 4-Phenylbutyric Acid (4-BPA, orange) or vehicle (red). c, Relative expression level of interferon-stimulated genes (ISGs) after the first cGAMP stimulation and ER-stress/NF-κB target genes after the fifth cGAMP stimulation in IMR90 cells in the presence of STING inhibitor H-151 (blue) or vehicle control (red).
Extended Data Fig. 11
Extended Data Fig. 11. Chronic cGAS–STING activation forebodes poor prognosis in human TNBC.
a, Immunoblots for STING in IMR90 after the first and fifth cGAMP stimulation with β-actin as loading control. b, Normalized STING protein levels in control, Cgas KO, and Sting1 KO cells; bars represent mean ± SD, * p < 0.05, two-sided ratio-paired t-test, n = 3 independent experiments. c, Immunoblots for STING of 4T1 WT and Cgas KO cells treated with BafA1 or vehicle in the presence of translation inhibitor cycloheximide with β-Actin as loading control. d, Representative high-resolution image of human tumor sample stained with DAPI (DNA) and anti-cGAS antibody showing selective localization of cGAS at micronuclei, scale bar 5-μm. e, Bar graph depicting the relationship between tumor cGAS and STING protein levels in TNBC, two-sided Chi-Square χ2-test, n = 179 tumors. f-g, Distant metastasis-free survival (DMFS) of patients with TNBC stratified based tumor STING (f) and cGAS (g) expression intensity, log-rank test, n = 155 patients. h, Percentage of tumor infiltrating lymphocytes in TNBC tumors stratified based on protein expression of cGAS and STING, bars represent mean ± s.e.m, n = 16 and 57 patients in the cGASlowSTINGhigh and cGAShighSTINGlow tumors, respectively, two-sided t-test. Source Data
Extended Data Fig. 12
Extended Data Fig. 12. CIN is associated with immune suppression in human tumors.
a, Clustered heatmap (average Euclidean distance) showing min-max normalized average log-transformed expression of key pathways and tumor cell CNV Diversity (Methods) used to stratify the 8 human TNBC tumors into CINlow and CINhigh subsets. b, Violin plots for the significant (p < 0.05) within-sample Spearman correlations between the mean CIN signature and mean Type I IFN (left), non-canonical NF-kB (middle), and hallmark UPR (right) signatures computed using all tumor cells within each sample (n = 10,836 cells from 8 human tumors). Nodes are colored by sample condition (blue: CINlow, red: CINhigh) and the overlaid box plots denote the minima and maxima (within 1.5*IQR), median, and 1st and 3rd quartiles. c, Strip plot showing CIN-dependent differential abundance within human TNBC cohort. Same as Fig. 2b, but for all cell types in the human TNBC cohort. d, Strip plot showing conserved CIN-dependent differential abundance effects (mean enrichment must be both positive or both negative) of cell types in mouse and human TNBC data, ranked by the mean mouse CIN-dependent log2(fold change) within each cell subtype. Node size is scaled by p-value, so that more significant differential abundance neighborhoods are larger. Bar plots show the mean log2(fold change) of neighborhoods with significant (p-value <= 0.1) differential abundance scores; if fewer than two significant neighborhoods are detected, all neighborhoods are used in computing the mean. e, ContactTracing circos plot, as in Fig. 4a, intersected with CIN-dependent interactions detected in human TNBC; which are defined as exhibiting CIN-dependent differential expression of the ligand in human tumors (q < 0.05, log2FC must be in same direction as CIN- and STING- in mouse analysis), and we detection >= 10 CIN-dependent interaction effects in the target cell type. Data provided in Supplementary Table 9. f, Fraction of overlapping CIN-dependent interactions predicted in mouse and human TNBC samples as a function of the top ranked interactions per dataset; evaluated within the subset of interactions that can be mapped between the human and mouse. Each unique interaction (identified by receptor, target cell type, ligand) is ranked by the number of CIN-dependent interaction effects detected in the target cell type, multiplied by the identity function that expression of the ligand is also CIN-dependent in any cell type in the TME.

Comment in

References

    1. Li, J. et al. Metastasis and immune evasion from extracellular cGAMP hydrolysis. Cancer Discov.11, 1212–1227 (2021). - PMC - PubMed
    1. Bakhoum, S. F. et al. Chromosomal instability drives metastasis through a cytosolic DNA response. Nature553, 467–472 (2018). - PMC - PubMed
    1. Bakhoum SF, Cantley LC. The multifaceted role of chromosomal instability in cancer and its microenvironment. Cell. 2018;174:1347–1360. doi: 10.1016/j.cell.2018.08.027. - DOI - PMC - PubMed
    1. Wormann SM, et al. APOBEC3A drives deaminase domain-independent chromosomal instability to promote pancreatic cancer metastasis. Nat. Cancer. 2021;2:1338–1356. doi: 10.1038/s43018-021-00268-8. - DOI - PubMed
    1. Lengauer C, Kinzler KW, Vogelstein B. Genetic instability in colorectal cancers. Nature. 1997;386:623–627. doi: 10.1038/386623a0. - DOI - PubMed

Publication types

MeSH terms