. 2023 Sep;621(7978):355-364.
doi: 10.1038/s41586-023-06425-6. Epub 2023 Aug 23.

Assembly of 43 human Y chromosomes reveals extensive complexity and variation

Affiliations

Assembly of 43 human Y chromosomes reveals extensive complexity and variation

Pille Hallast et al. Nature. 2023 Sep.

Abstract

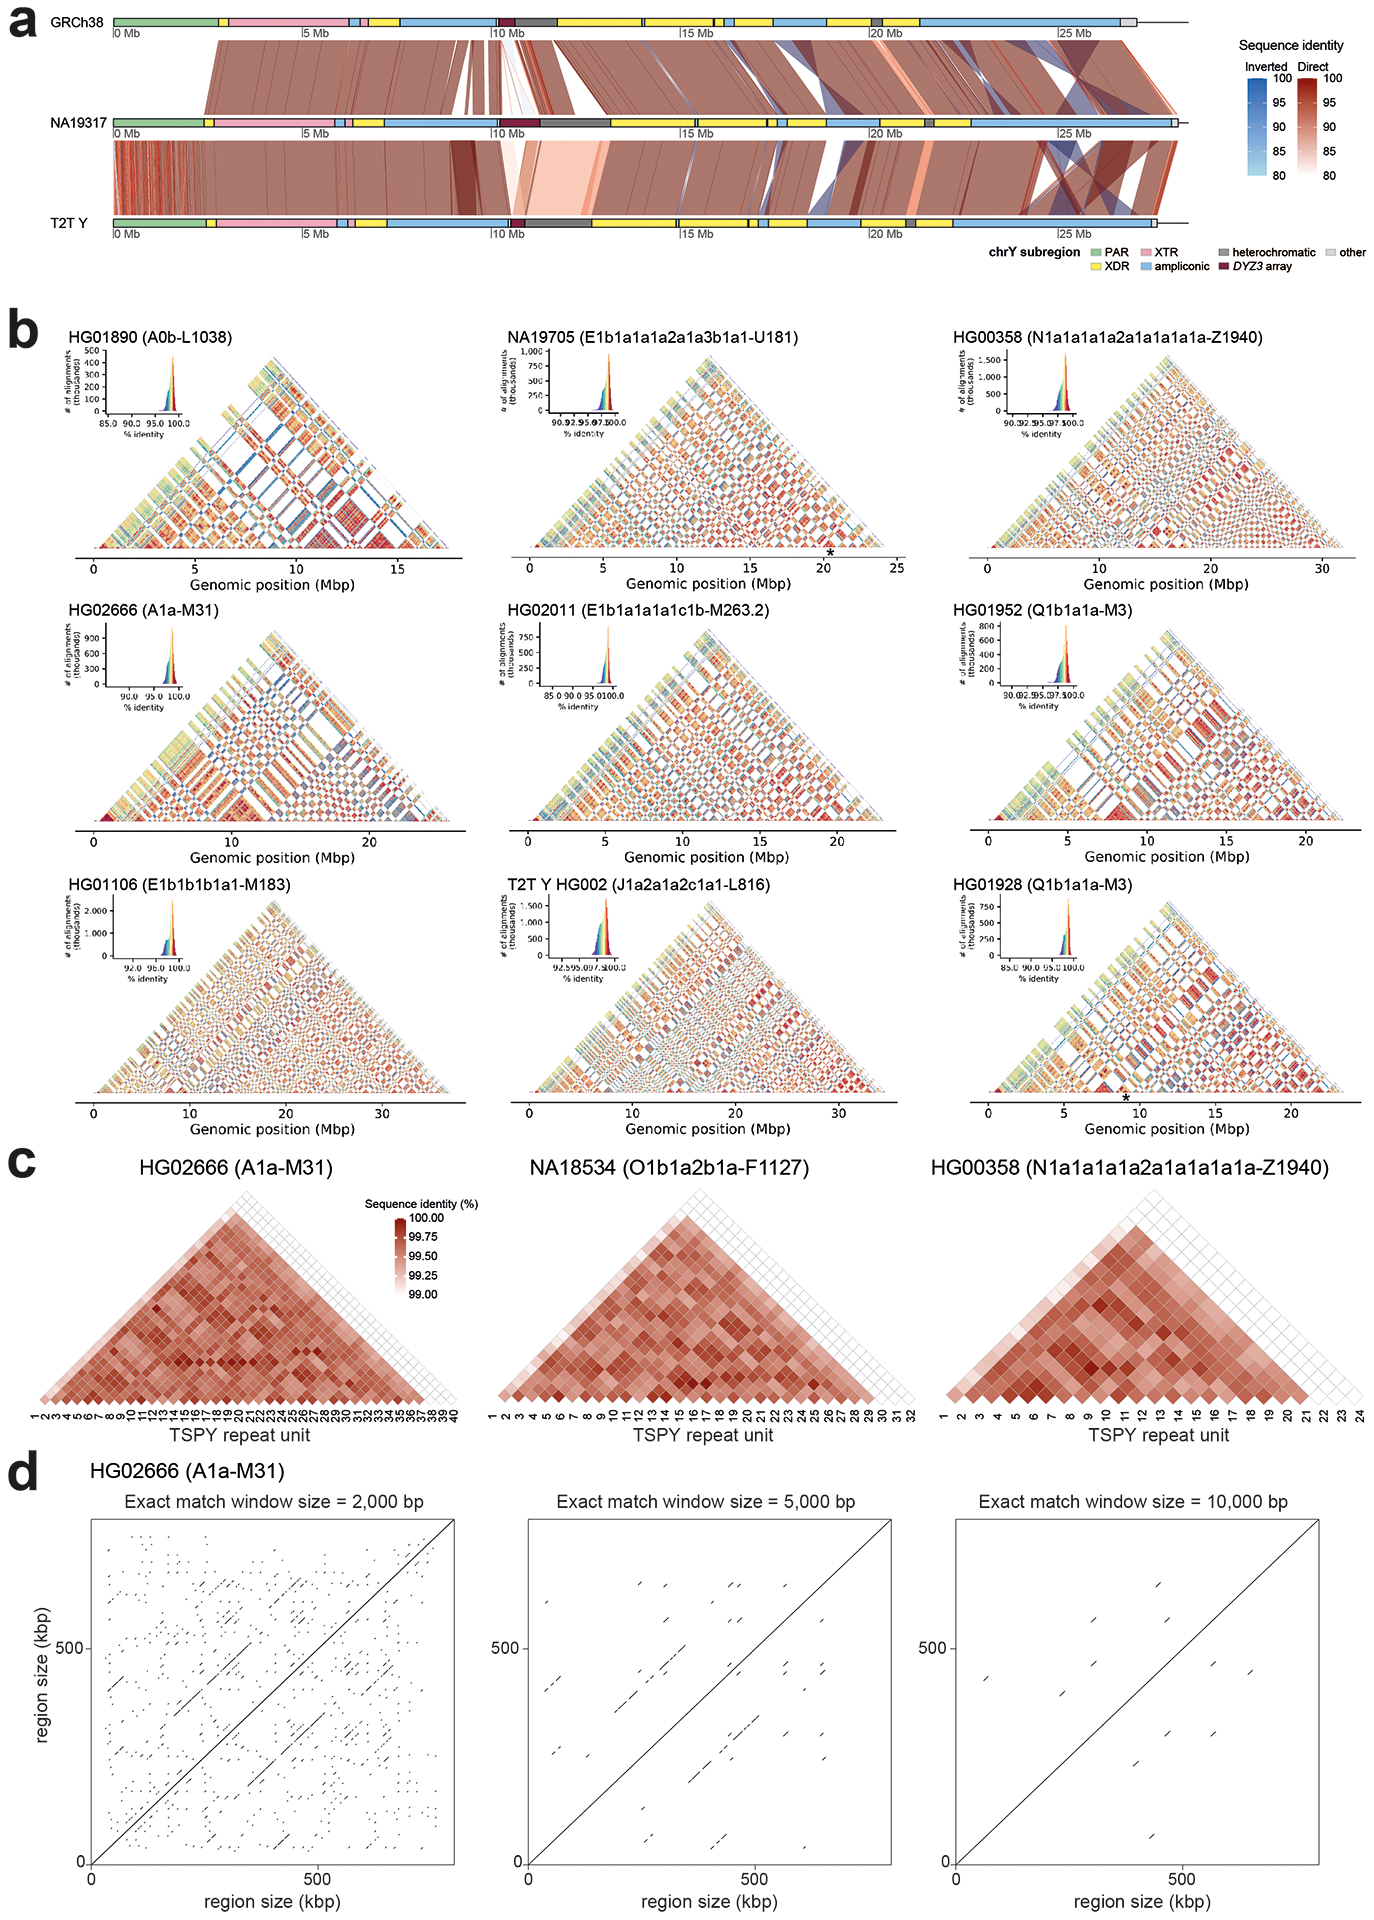
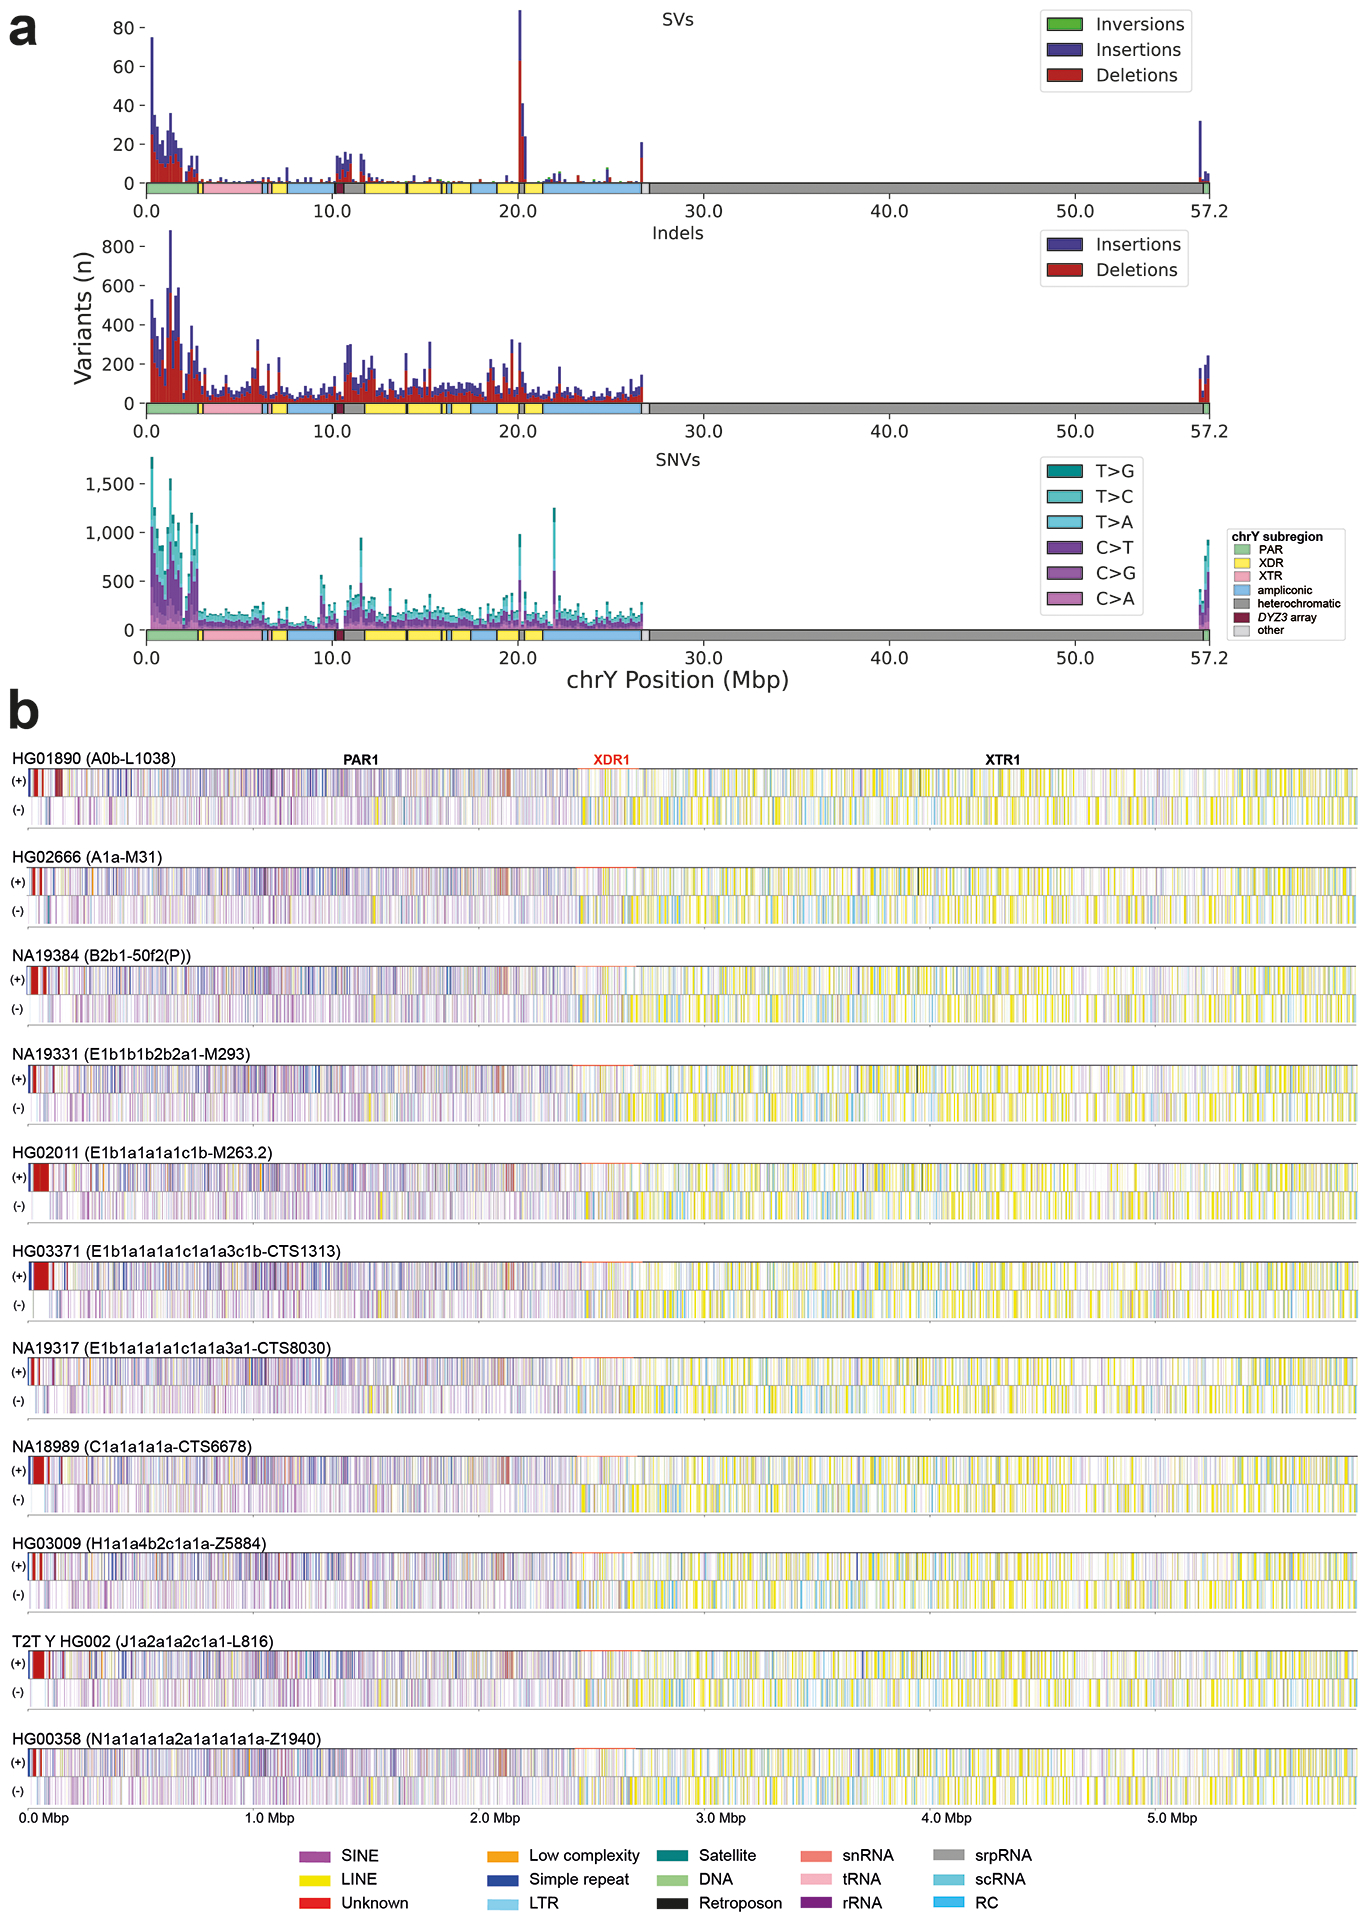
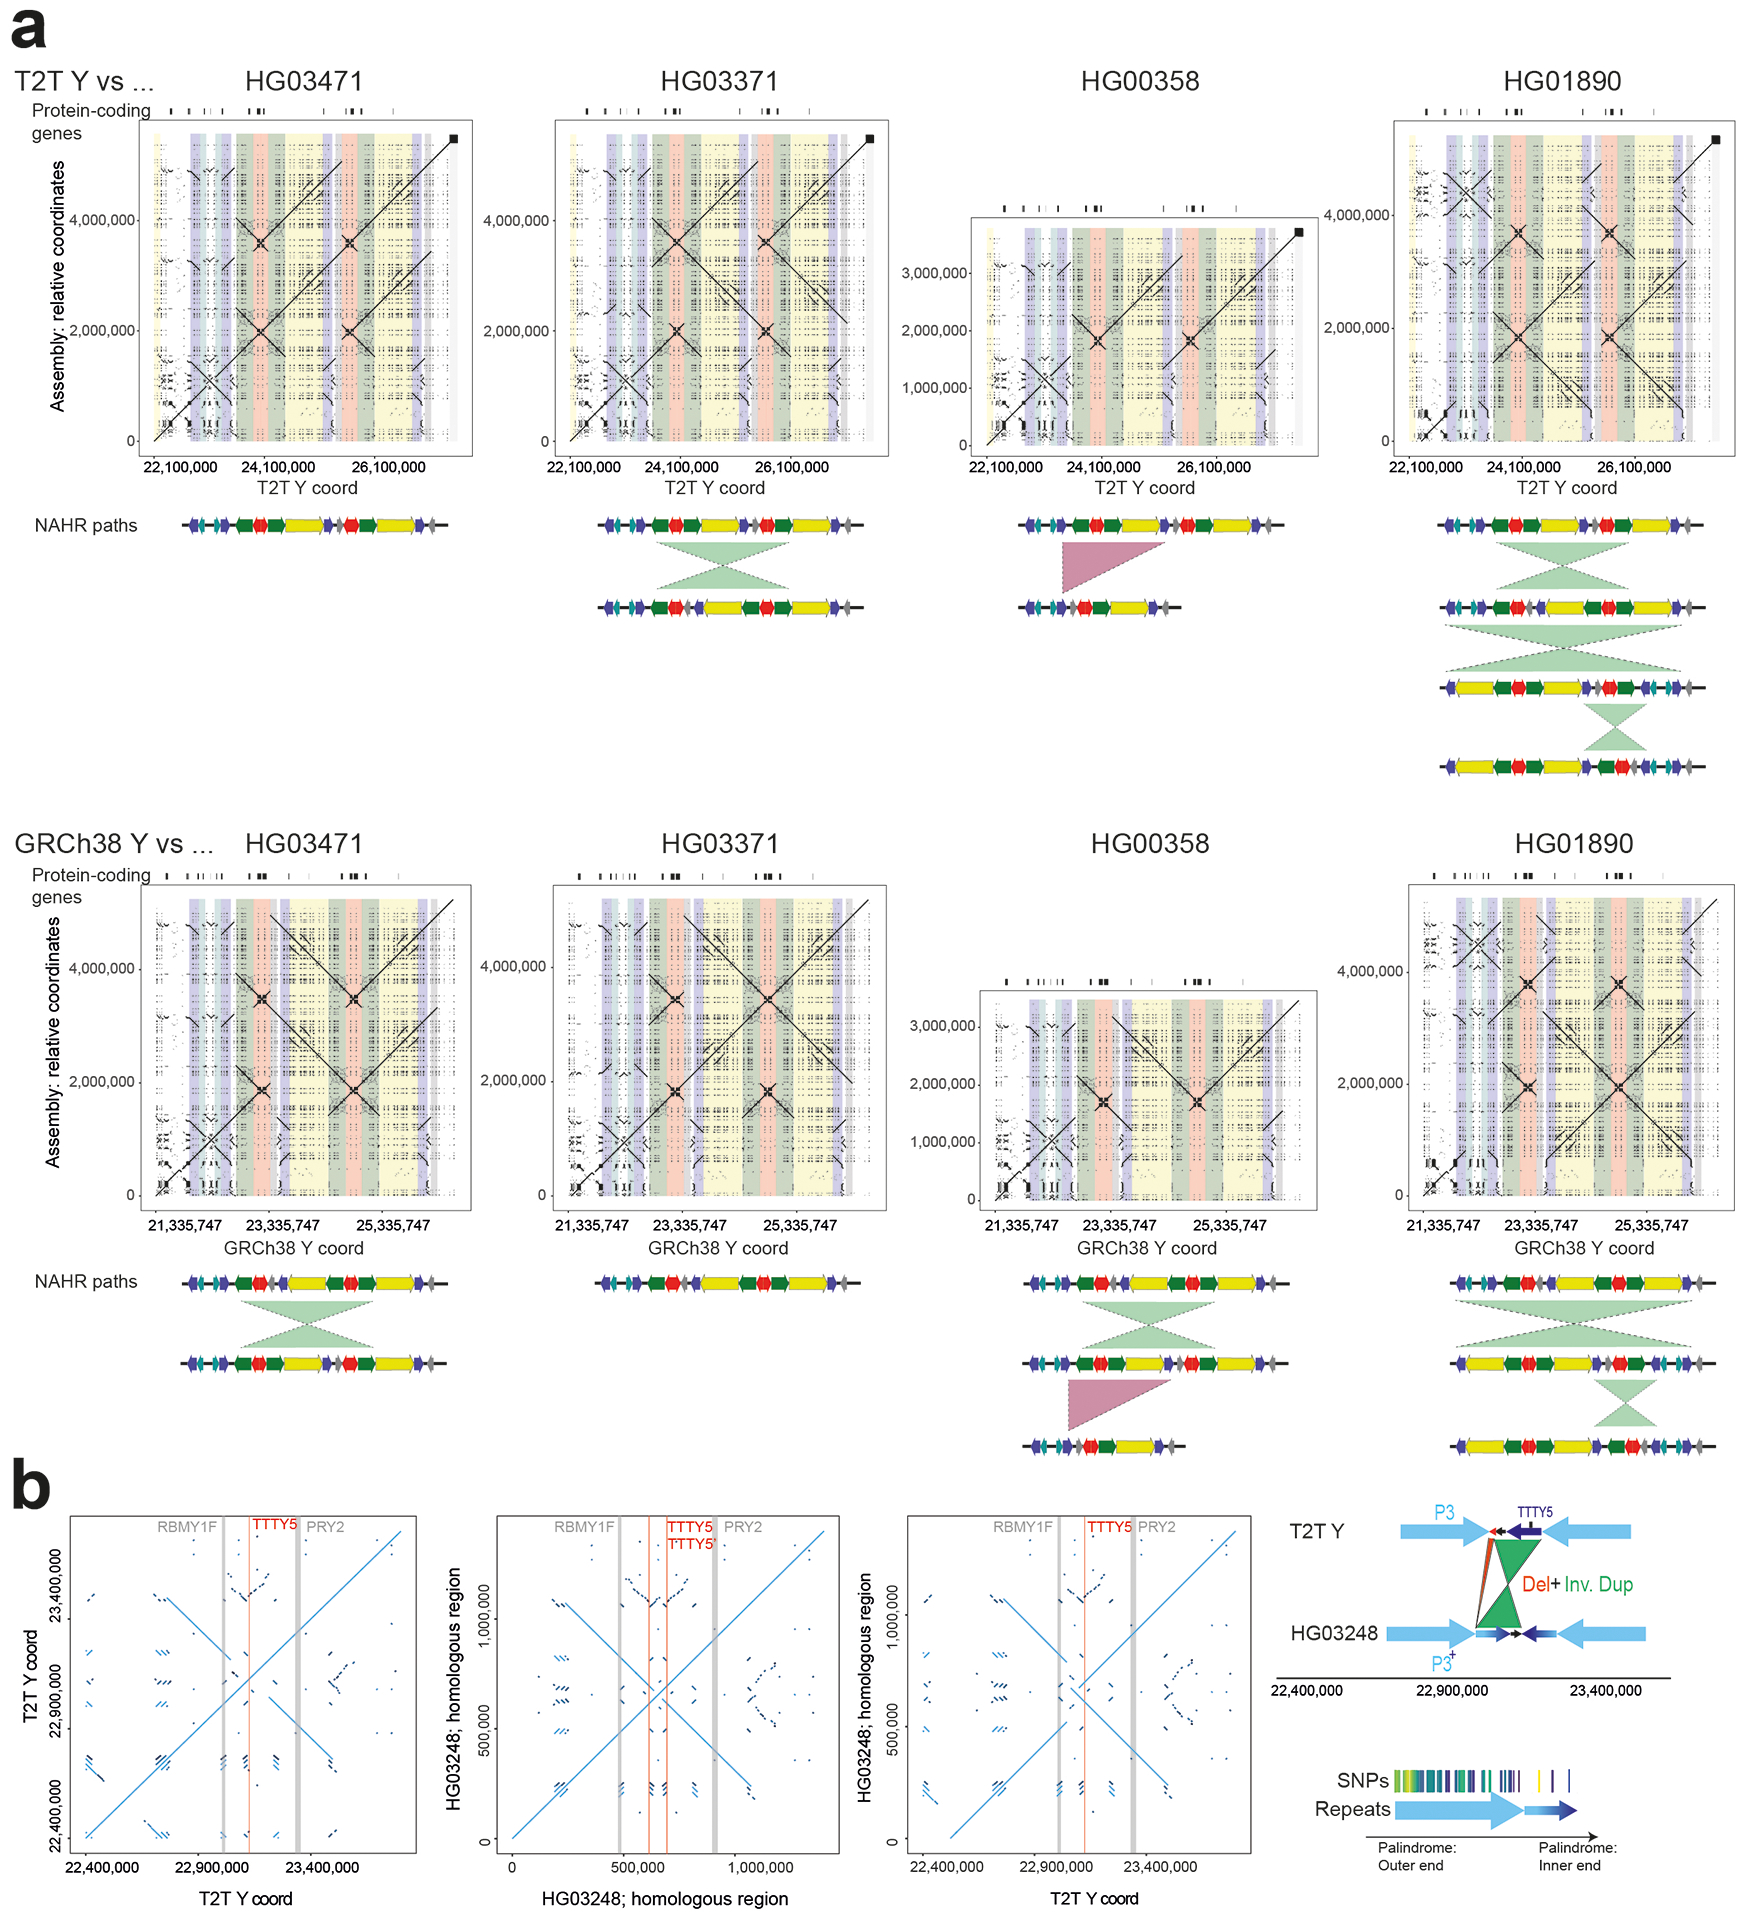
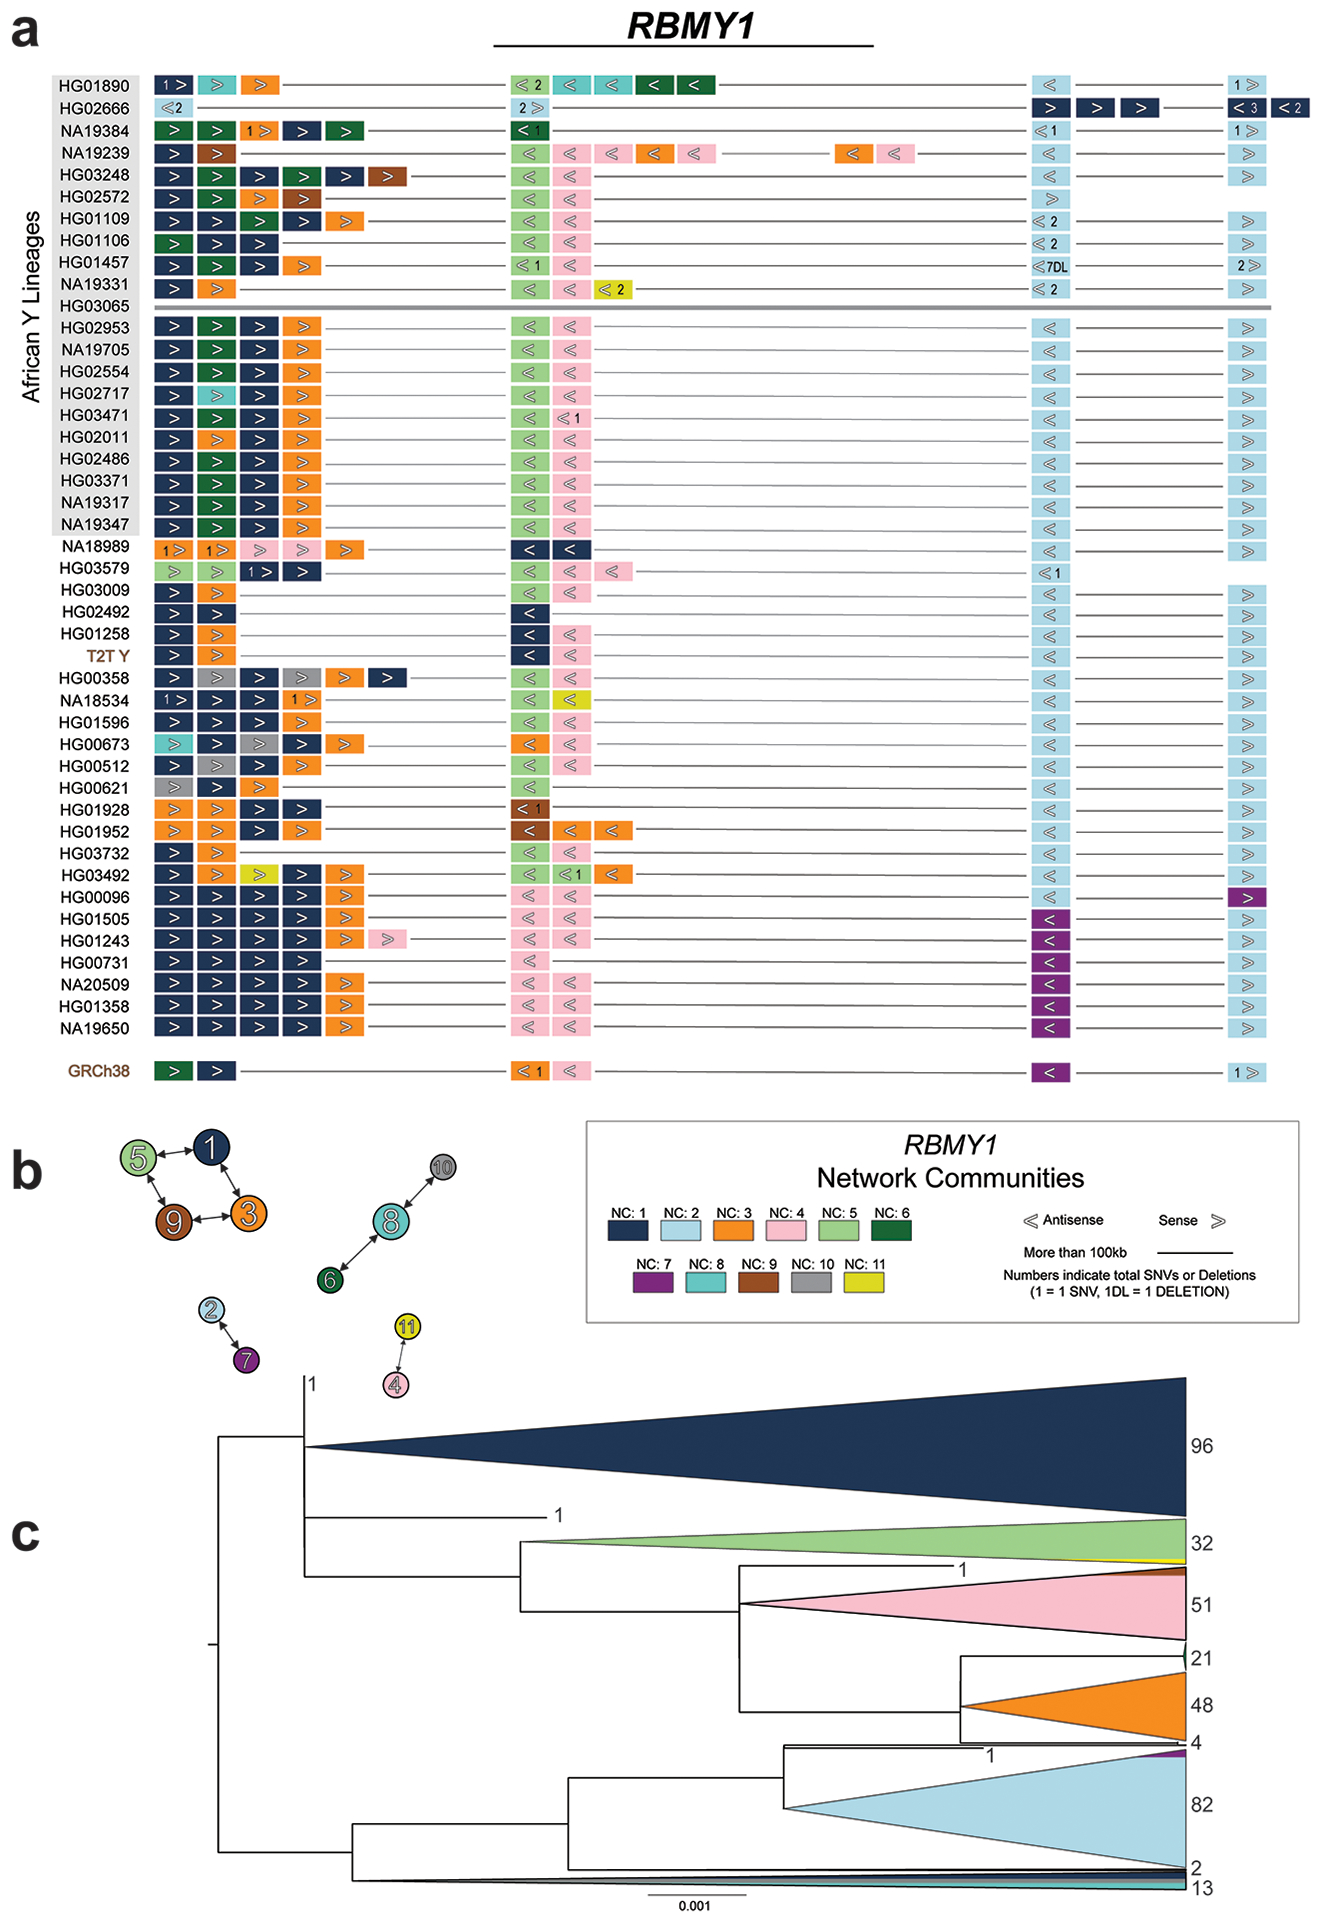
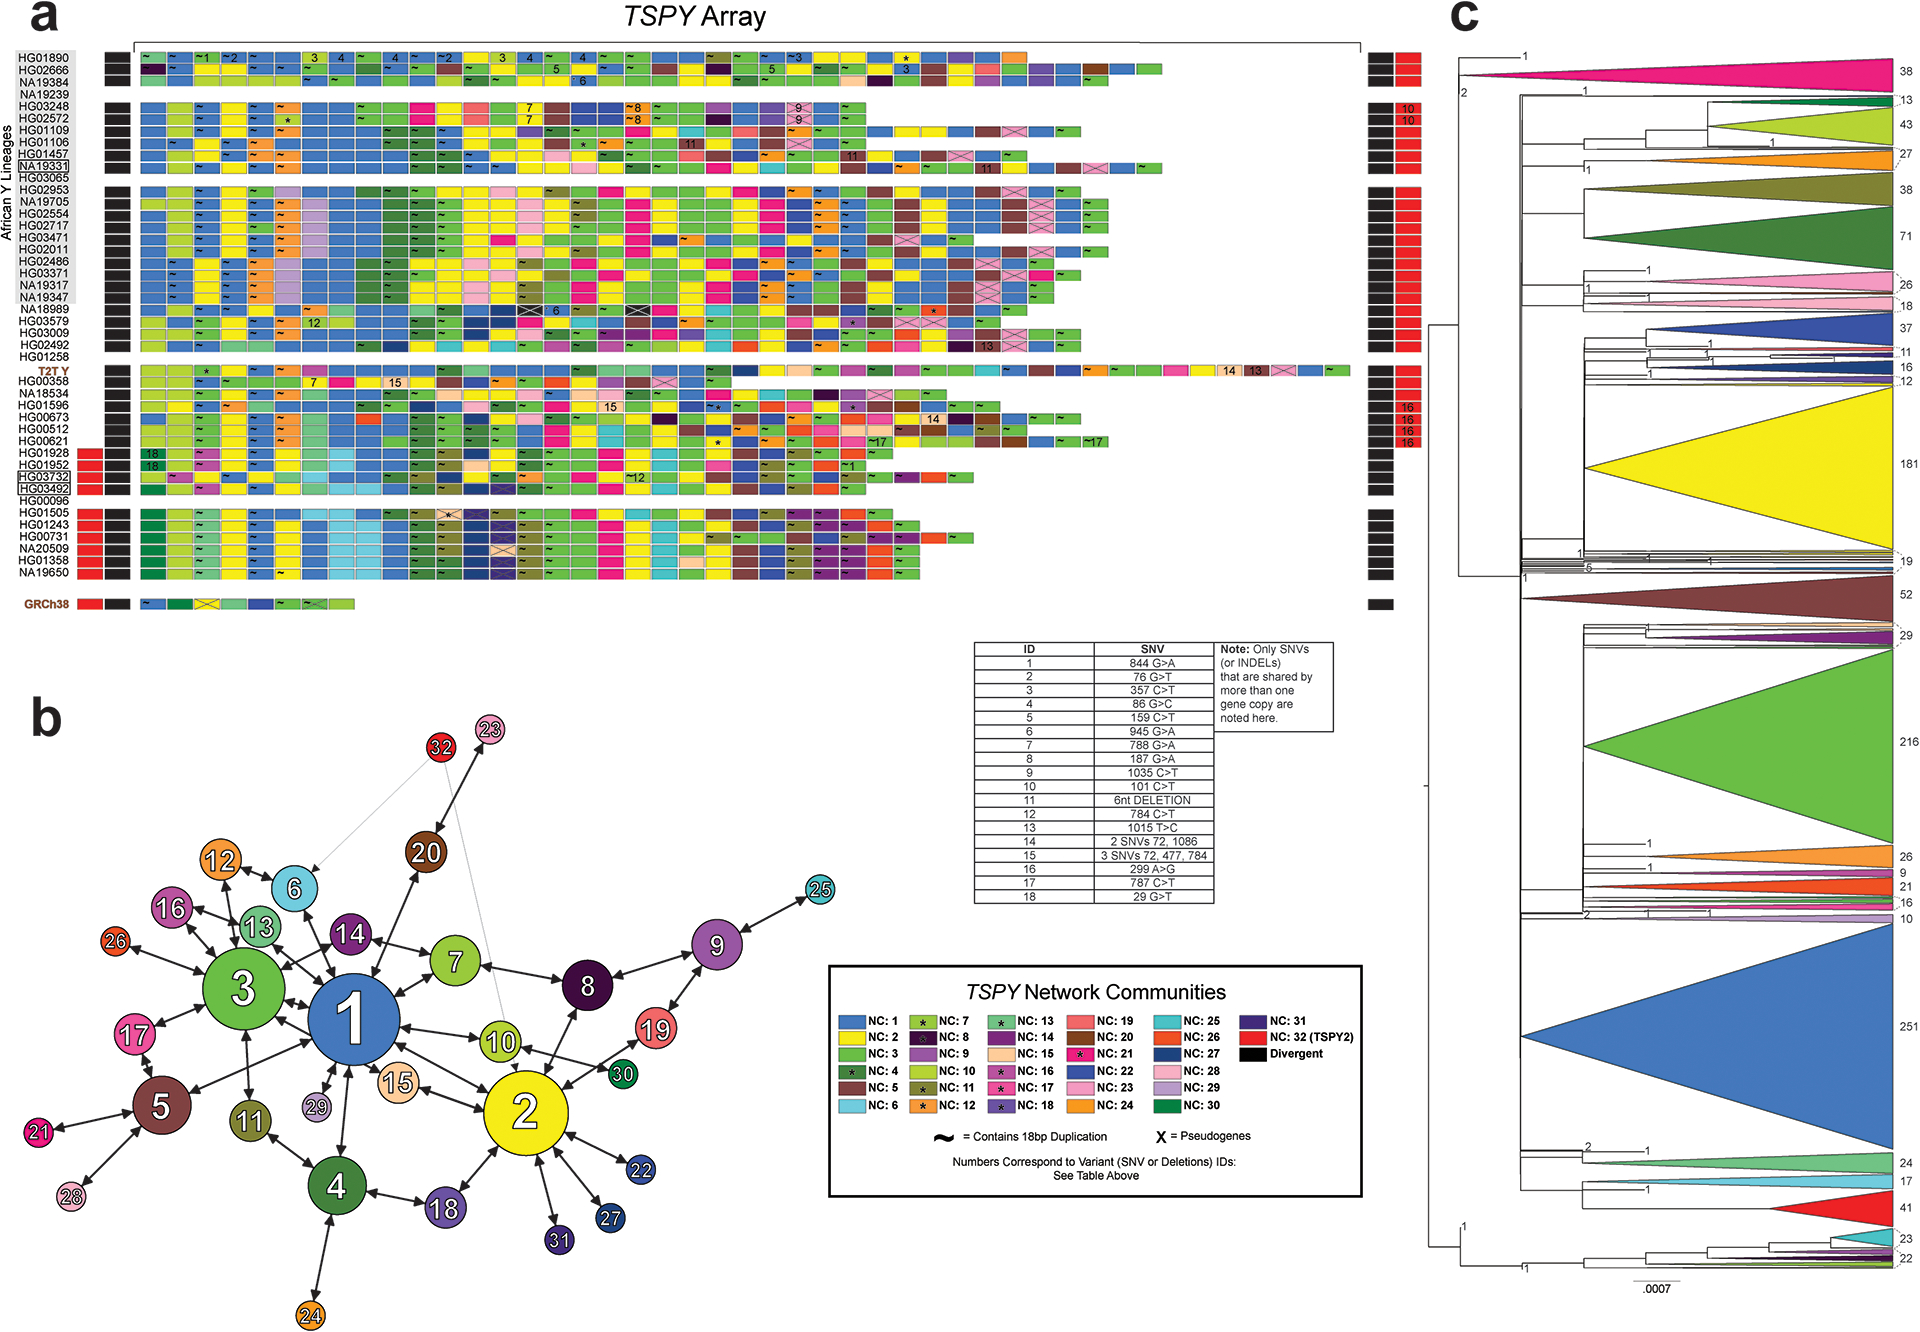
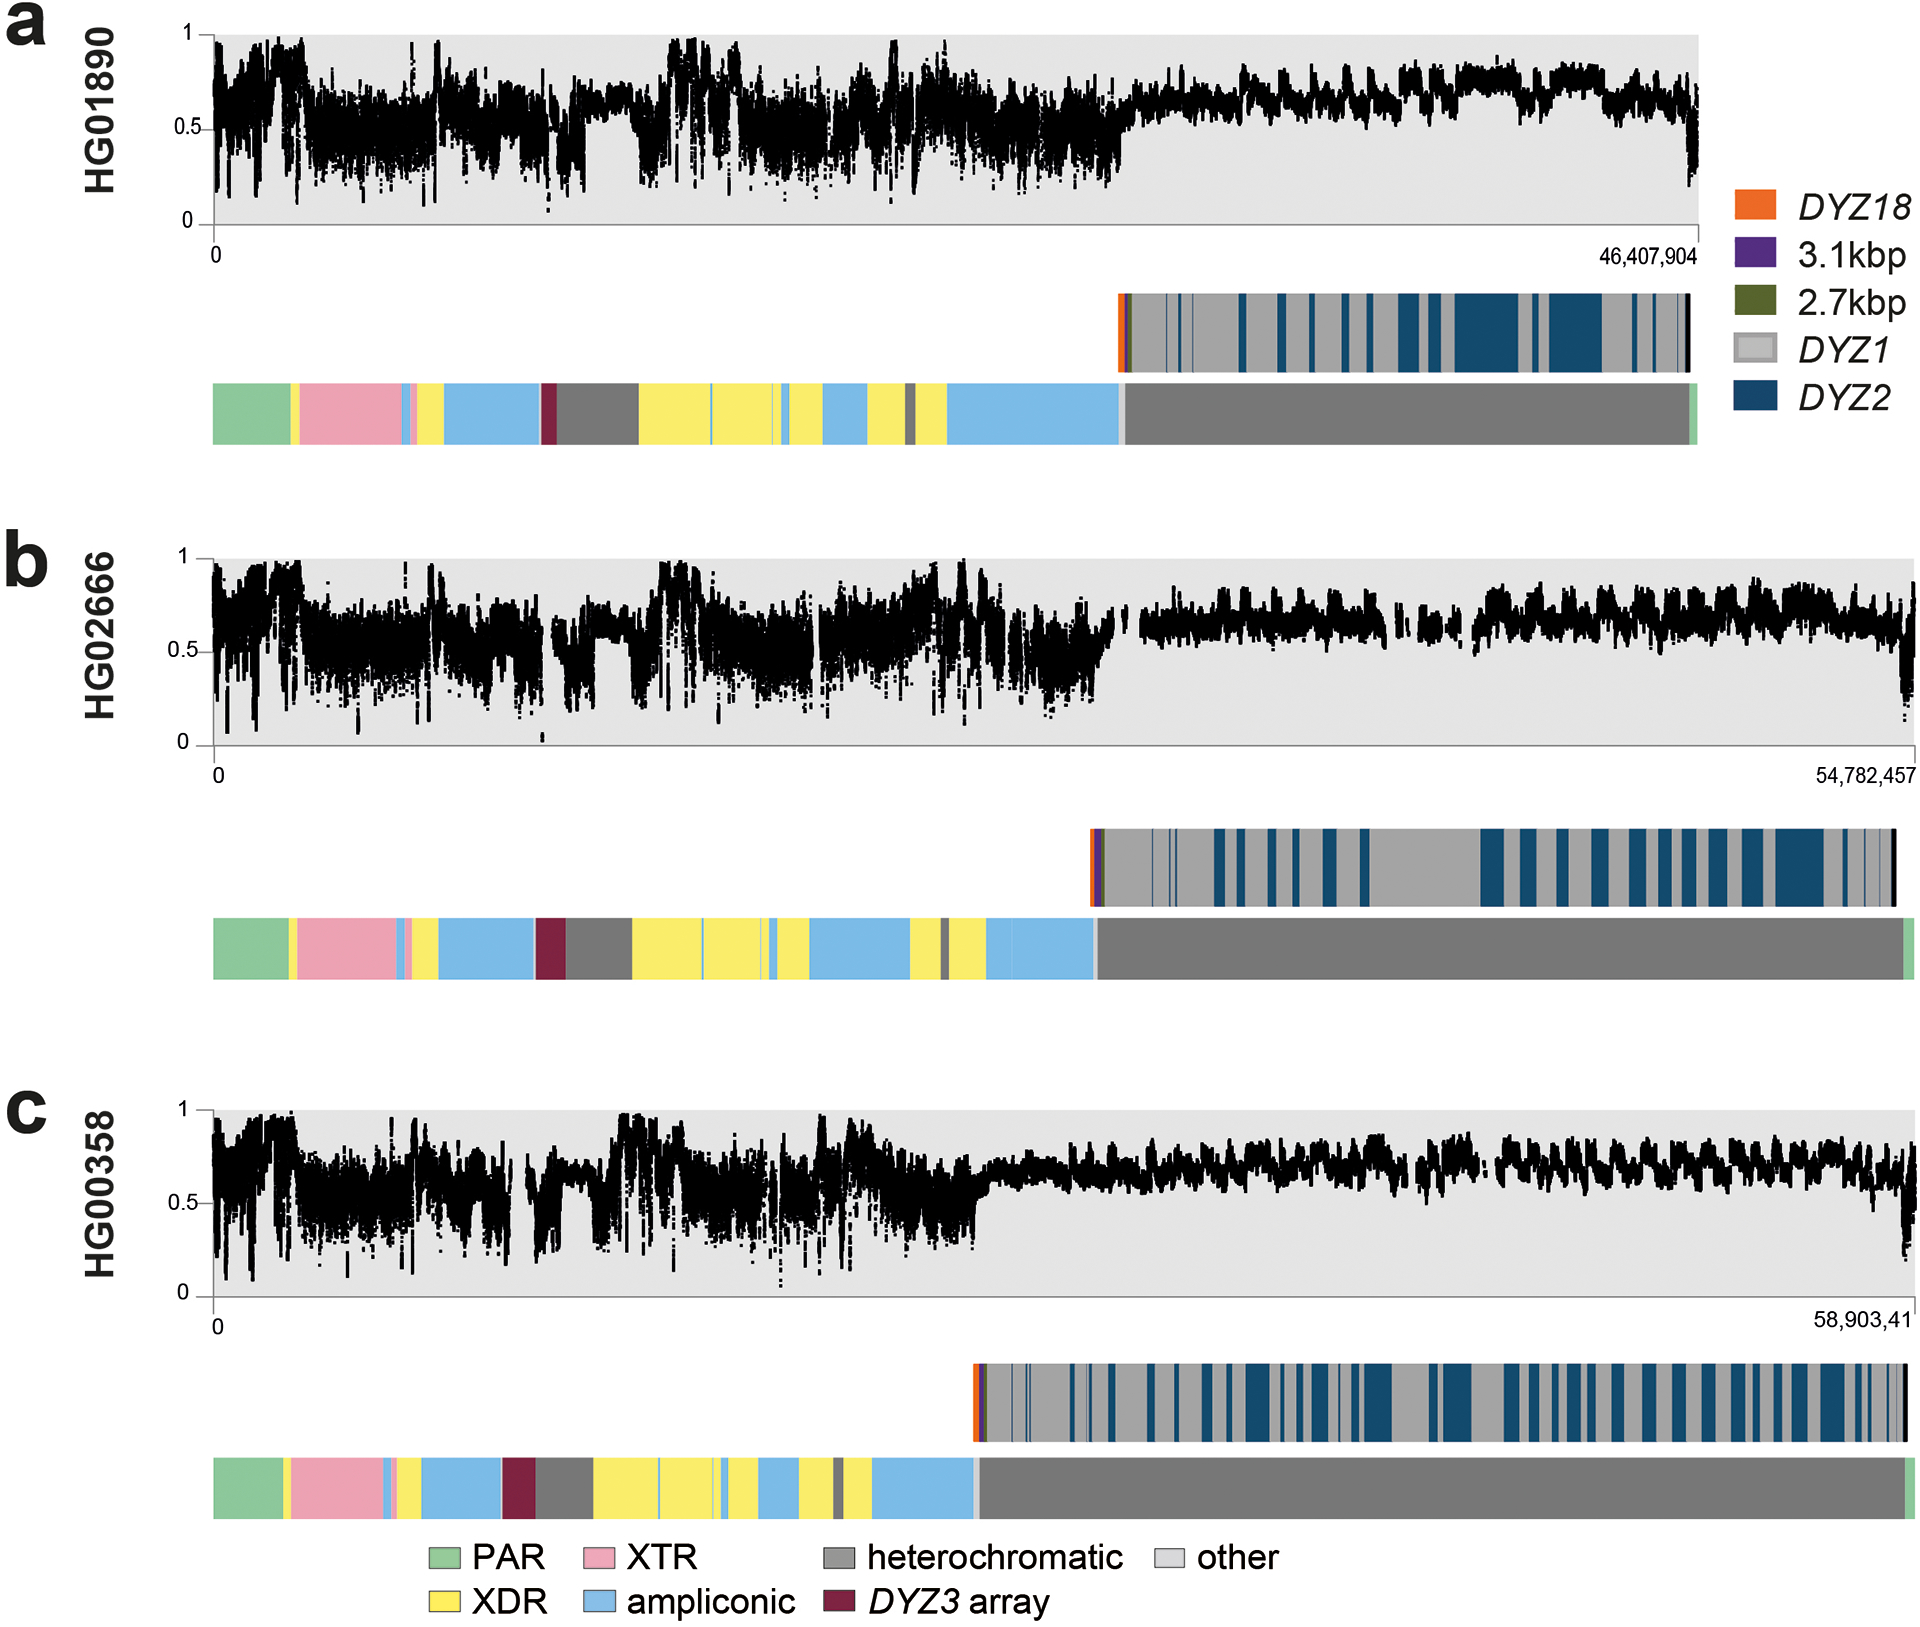
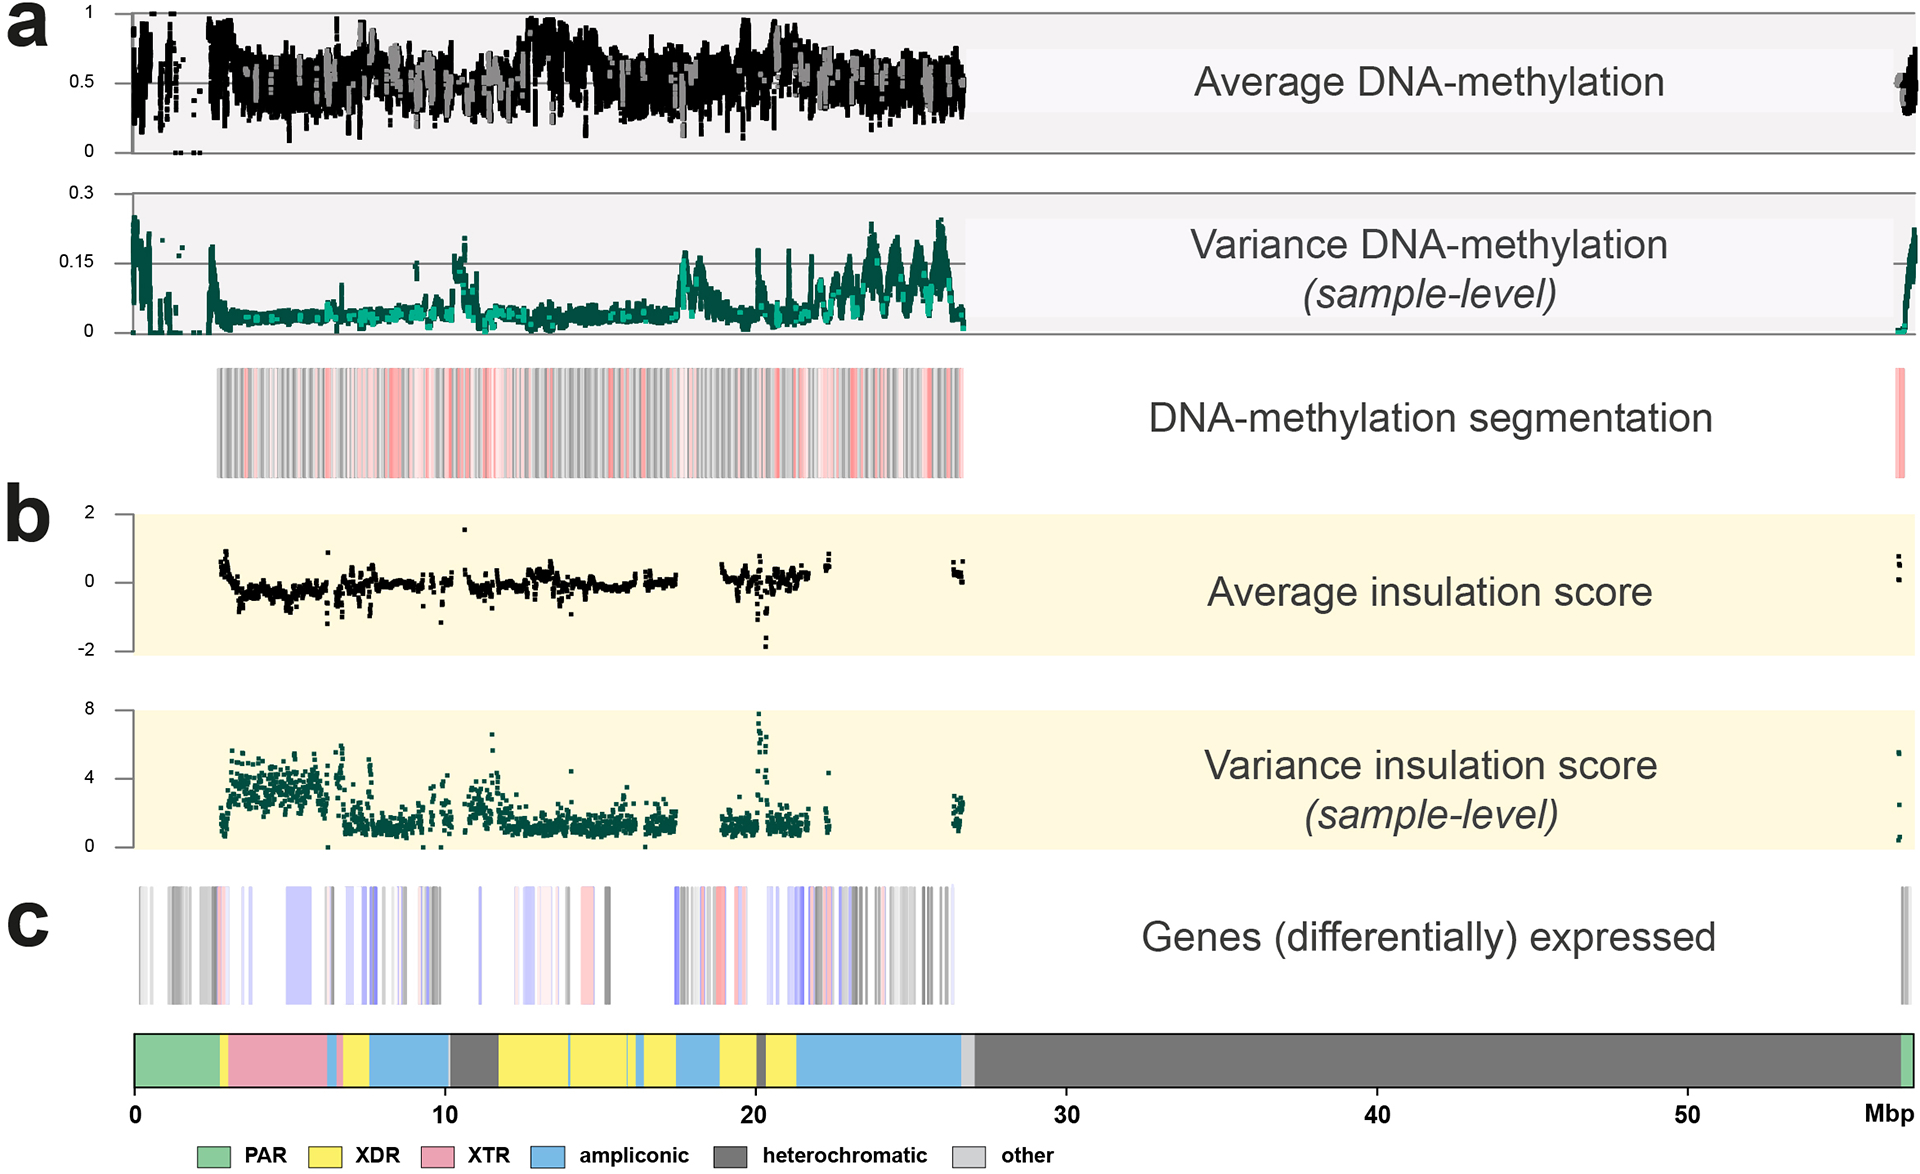
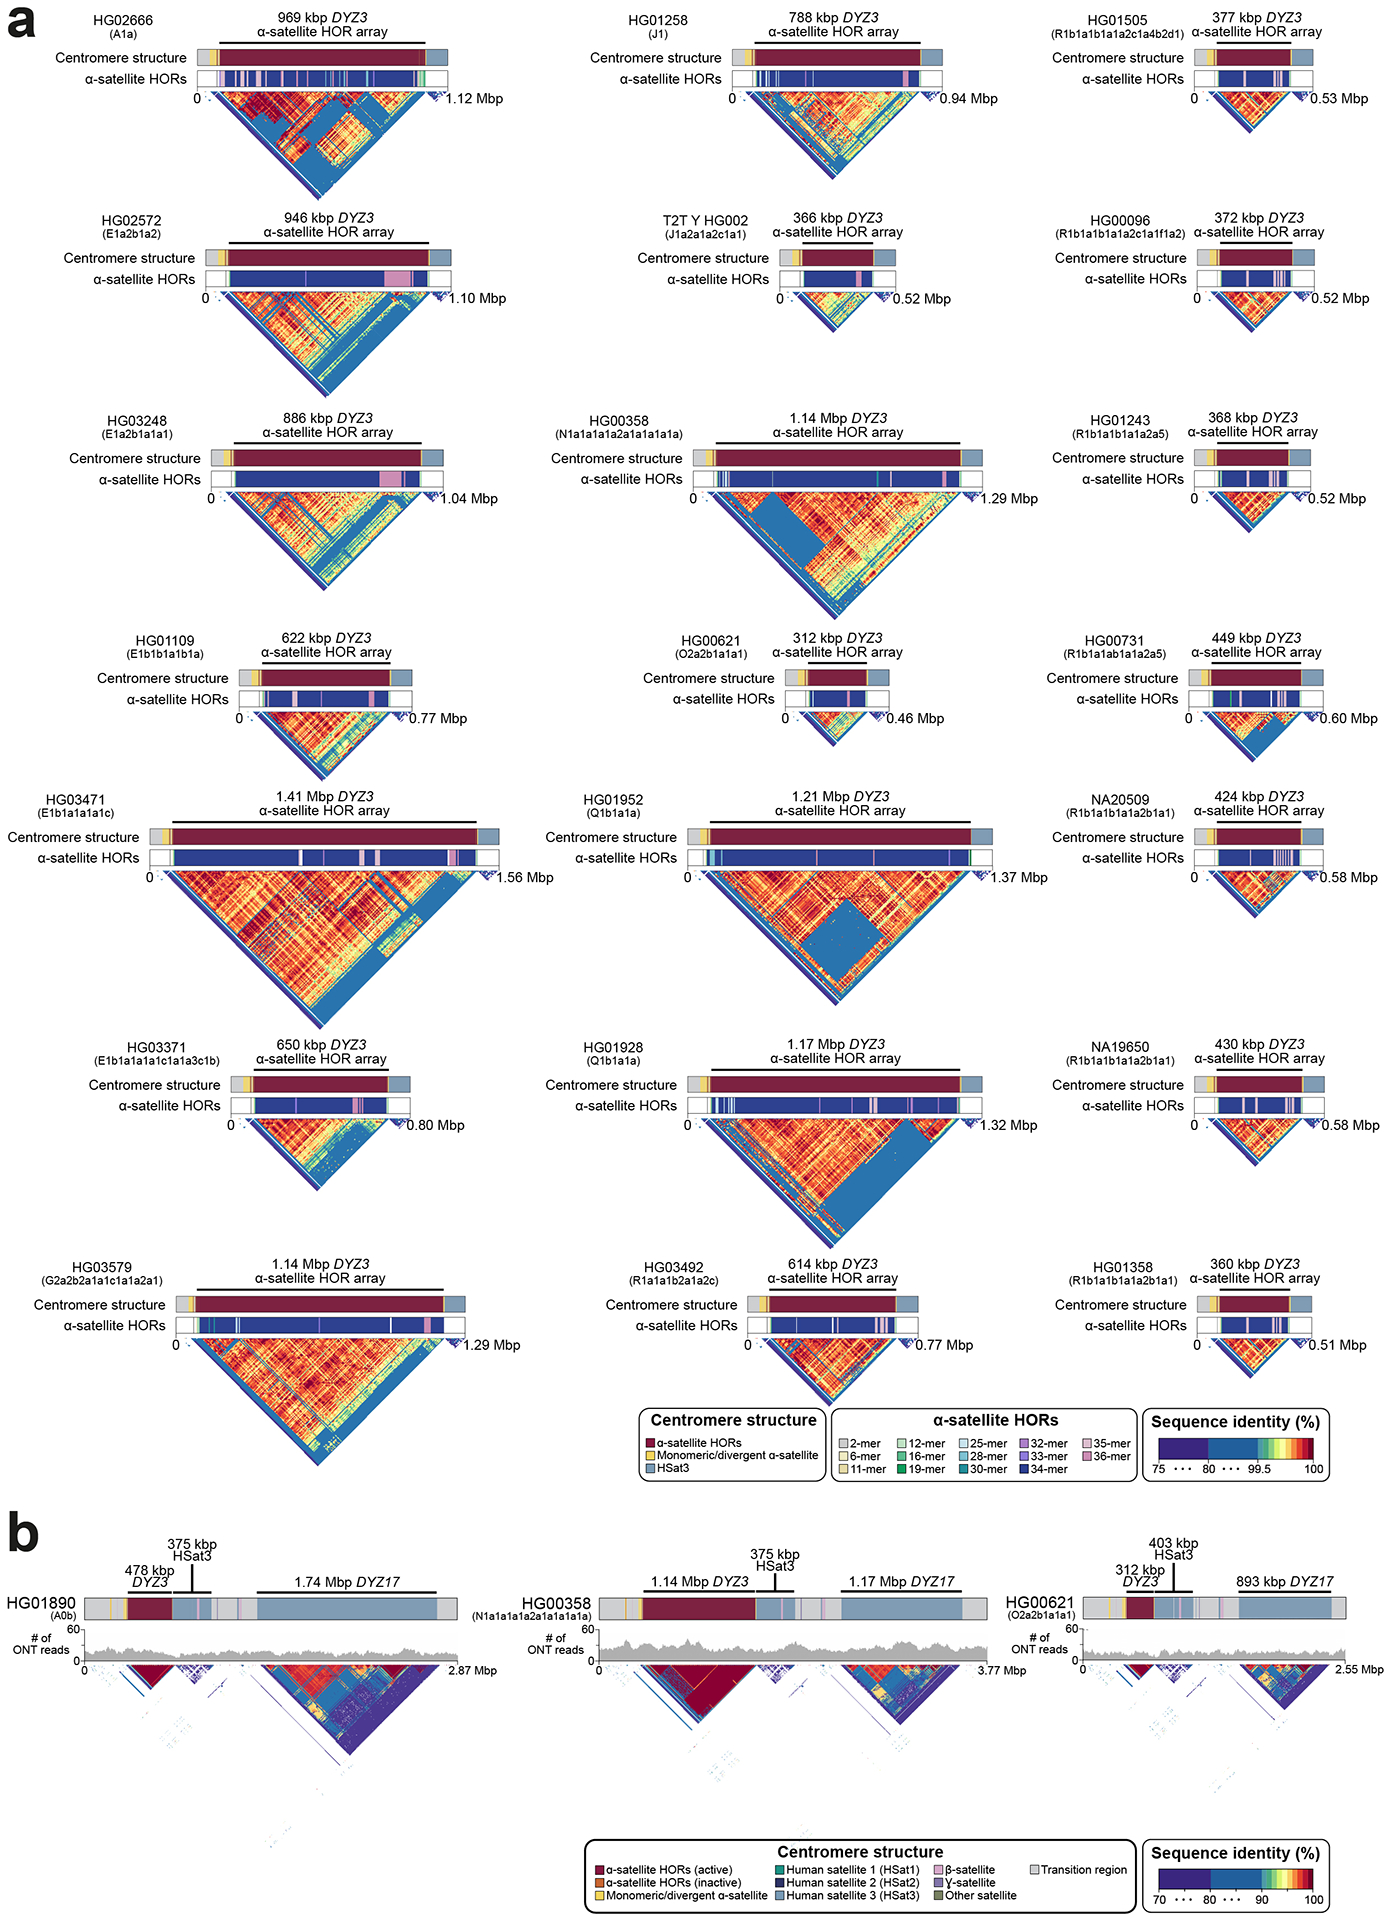
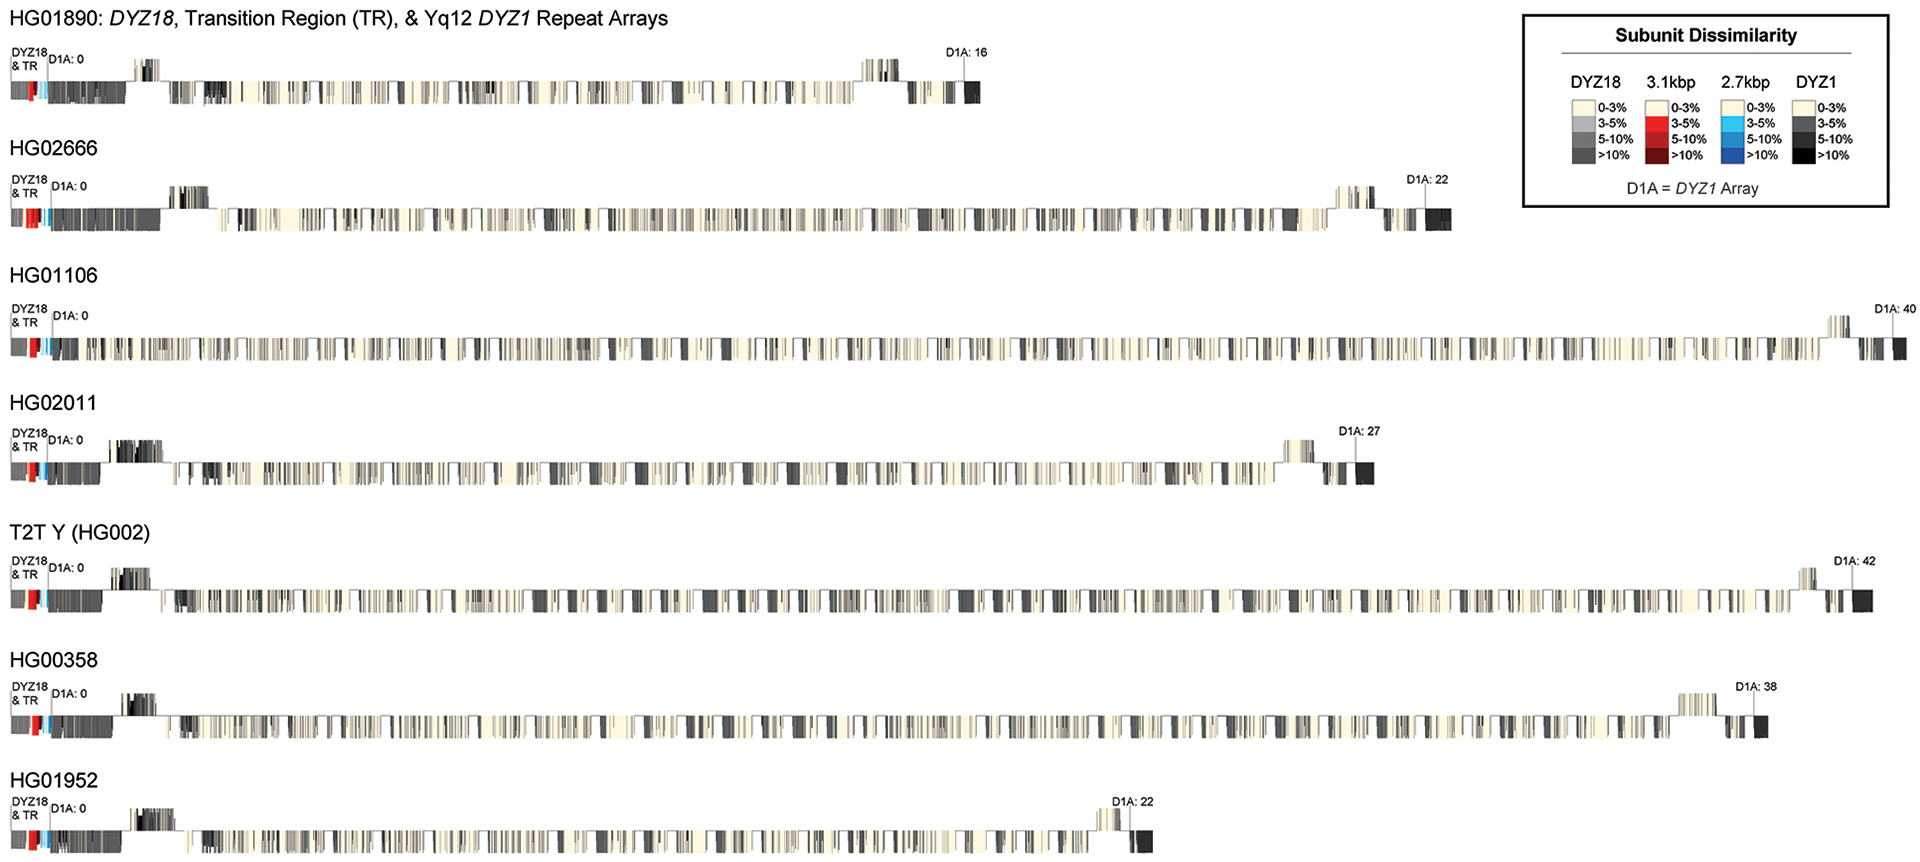
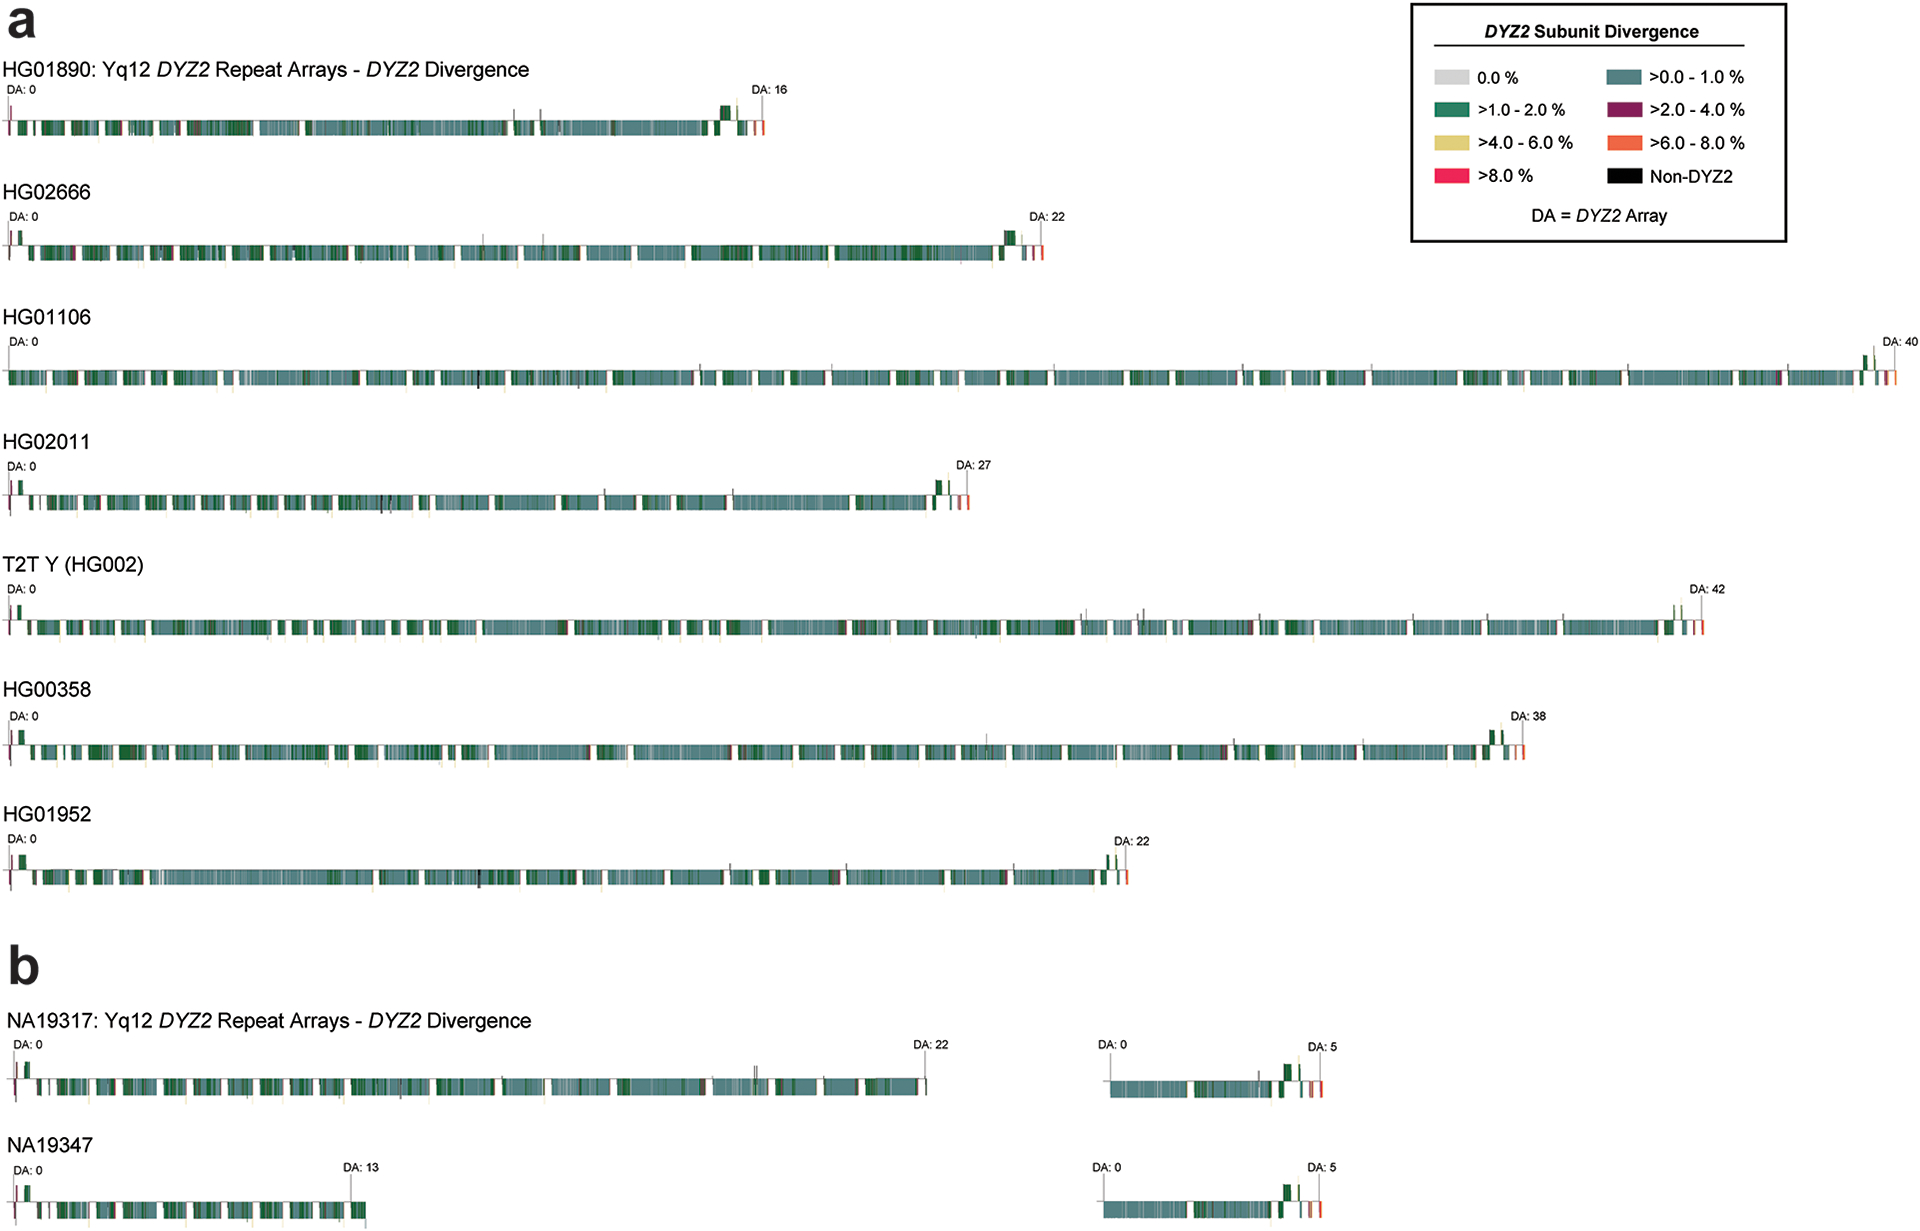
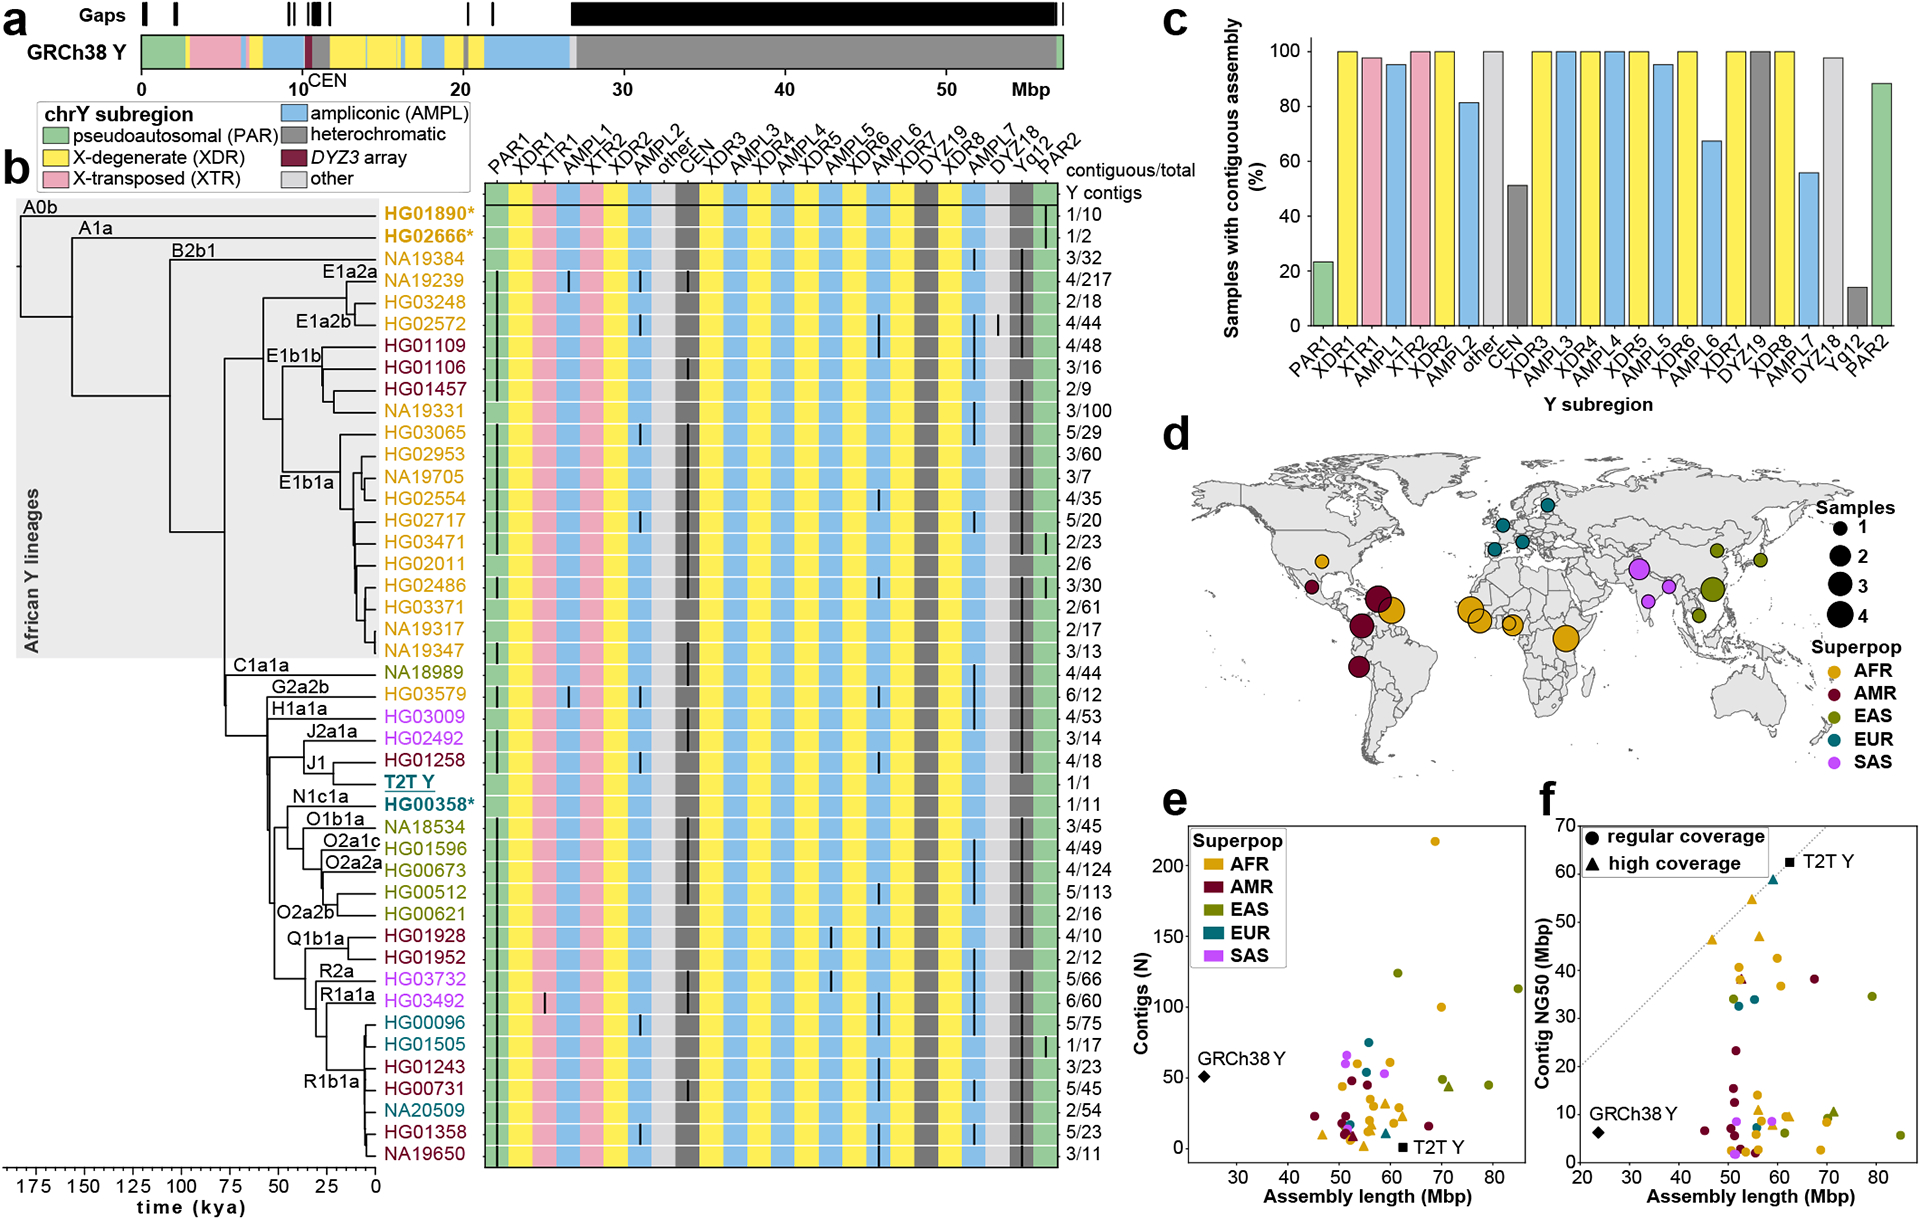
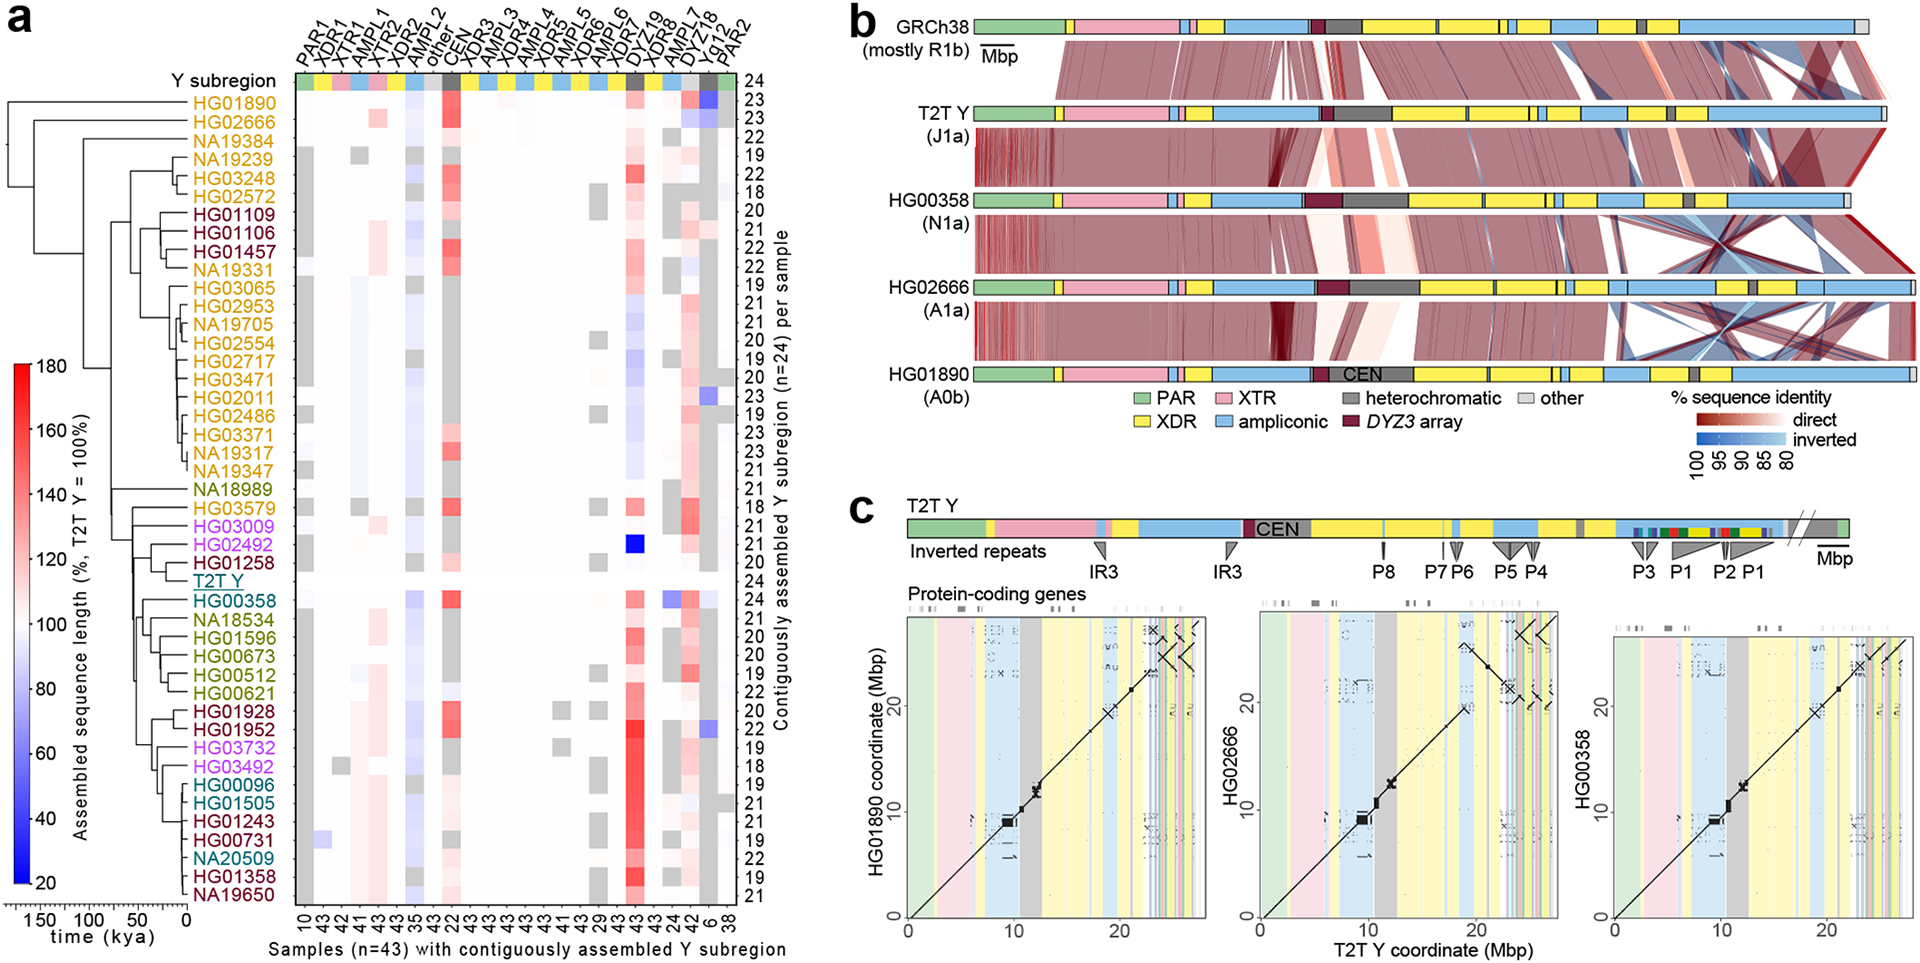
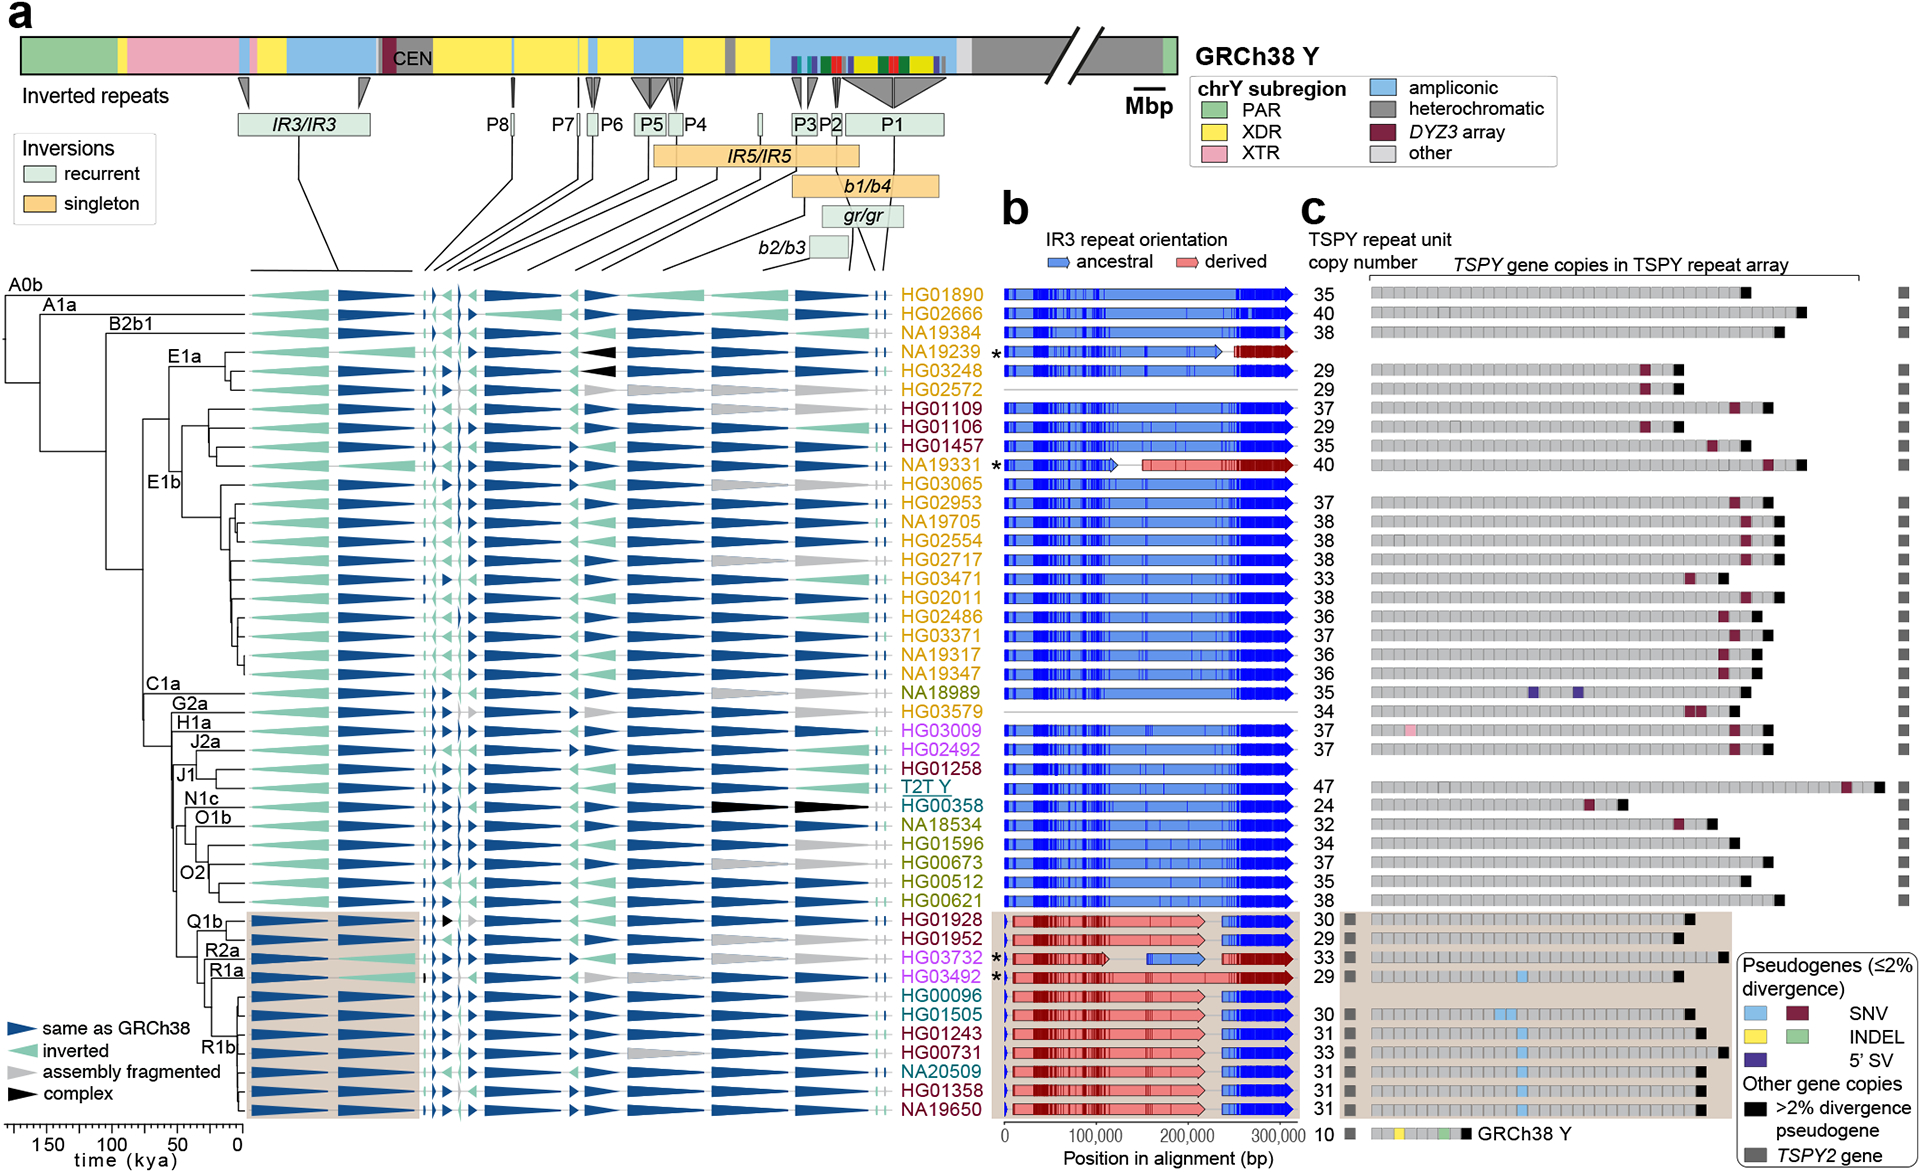
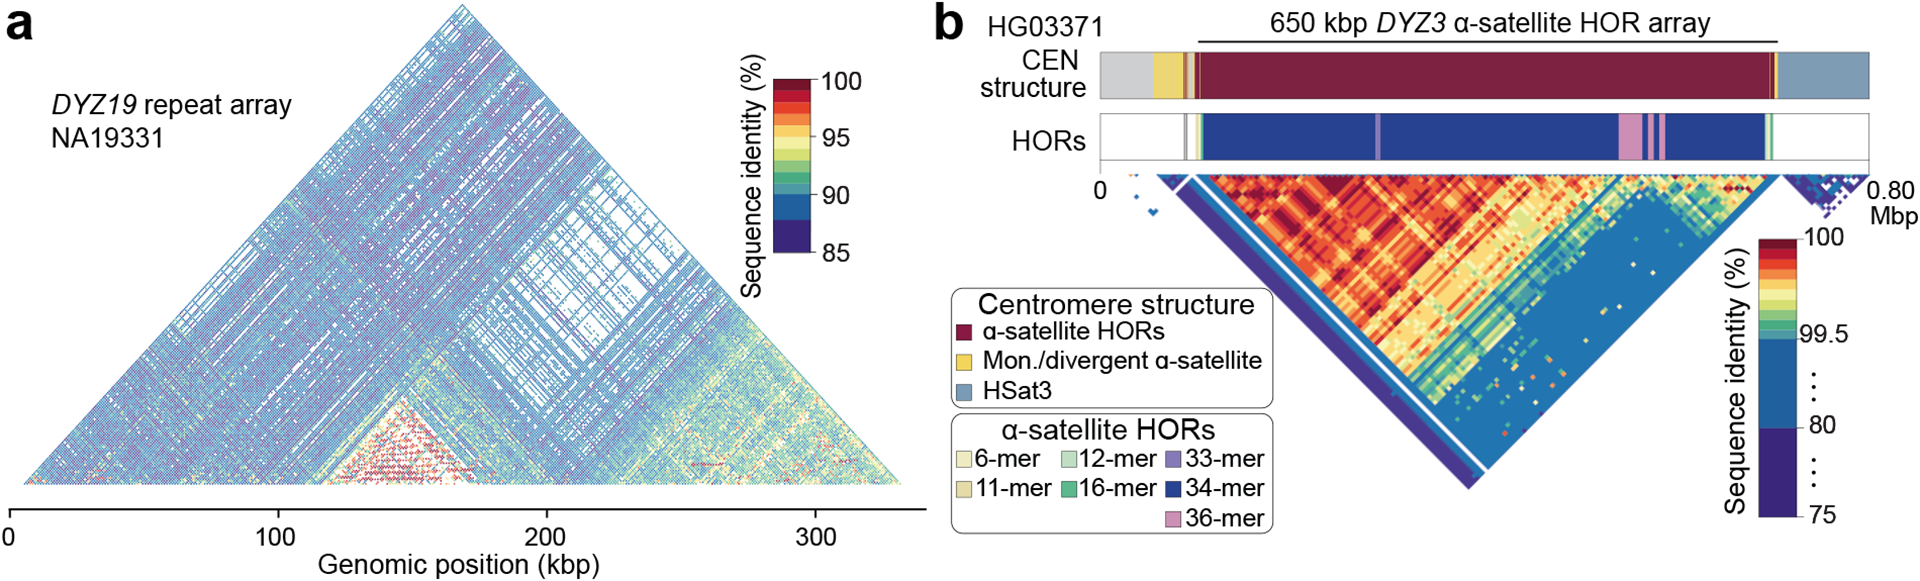
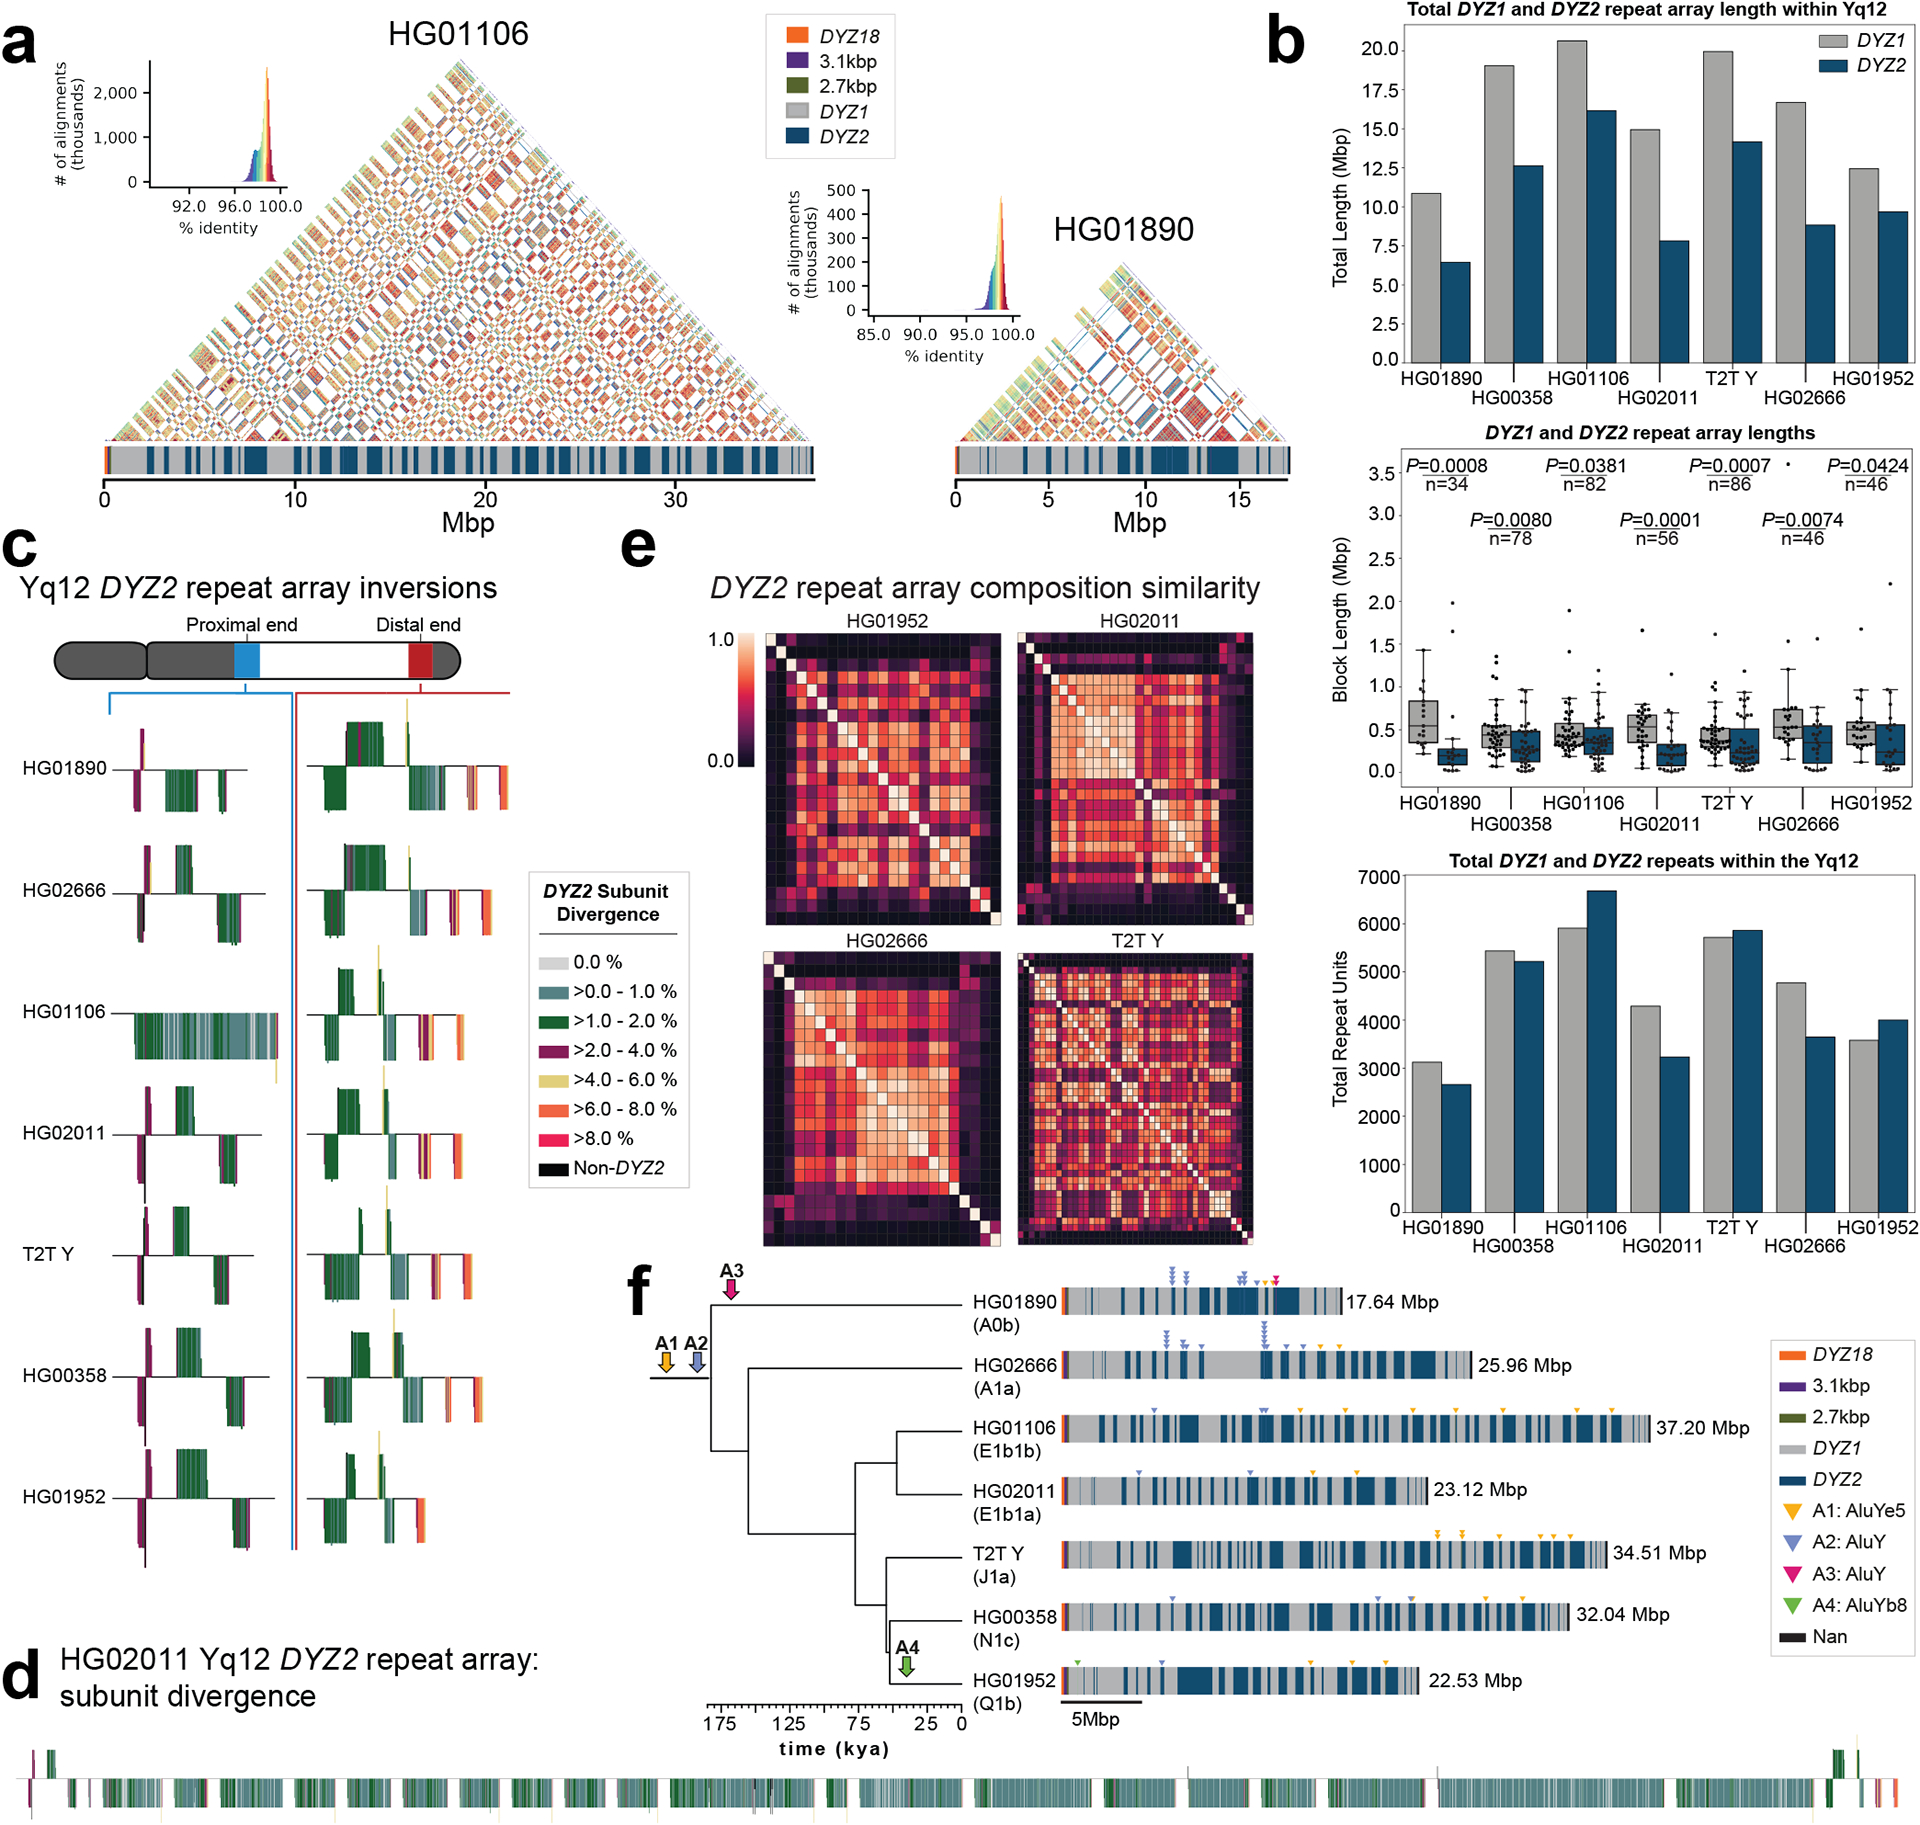
The prevalence of highly repetitive sequences within the human Y chromosome has prevented its complete assembly to date1 and led to its systematic omission from genomic analyses. Here we present de novo assemblies of 43 Y chromosomes spanning 182,900 years of human evolution and report considerable diversity in size and structure. Half of the male-specific euchromatic region is subject to large inversions with a greater than twofold higher recurrence rate compared with all other chromosomes2. Ampliconic sequences associated with these inversions show differing mutation rates that are sequence context dependent, and some ampliconic genes exhibit evidence for concerted evolution with the acquisition and purging of lineage-specific pseudogenes. The largest heterochromatic region in the human genome, Yq12, is composed of alternating repeat arrays that show extensive variation in the number, size and distribution, but retain a 1:1 copy-number ratio. Finally, our data suggest that the boundary between the recombining pseudoautosomal region 1 and the non-recombining portions of the X and Y chromosomes lies 500 kb away from the currently established1 boundary. The availability of fully sequence-resolved Y chromosomes from multiple individuals provides a unique opportunity for identifying new associations of traits with specific Y-chromosomal variants and garnering insights into the evolution and function of complex regions of the human genome.


Conflict of interest statement

Competing interests

E.E.E. is a scientific advisory board member of Variant Bio, Inc. C. Lee is a scientific advisory board member of Nabsys and Genome Insight. The following authors have previously disclosed a patent application (no. EP19169090) relevant to Strand-seq: J.O.K., T.M. and D.P. The other authors declare no competing interests.

Figures

Extended Data Fig. 1.
Extended Data Fig. 1.. Variation in structure and composition across Y-chromosomal subregions.
a. Overview of the Y chromosome. A three-way comparison of sequence identity between GRCh38 Y, NA19317 (E1b1a1a1a1c1a1a3a1-CTS8030) and the T2T Y (excluding Yq12 and PAR2 subregions), highlighting substantial differences in the size and orientation of some subregions. b. Focus on Yq12. Sequence identity heatmaps of the Yq12 subregion for six contiguously assembled samples (HG01890, HG02666, HG01106, HG02011, HG00358 and HG01952), two samples (NA19705 and HG01928) with a single gap in the Yq12 subregion (gap location marked with asterisk) and the T2T Y using 5kb window size. c. Focus on TSPY repeat array. Sequence identity heatmaps of ~20.3-kbp TSPY repeat units for three males highlighting putative expansion events harbouring both single and multiple repeat units. Red shades from lighter to darker indicate sequence identity from 99–100%, respectively, while white fill indicates sequence identity <99%. The last copy on the right is the single separate repeat unit containing the TSPY2 gene. See Fig. S22 for heatmaps of all samples. d. Dotplots of the TSPY repeat array for HG02666 with 5 kbp of flanking regions showing identical matches of 2, 5, and 10 kbp in size indicating regions with high sequence identity. See Fig. S25 for additional examples.
Extended Data Fig. 2.
Extended Data Fig. 2.. Distribution of genetic variants across the Y chromosome and repeat elements in PAR1, XDR1 and XTR1 subregions.
a. Distribution of variant sizes for SVs (≥ 50 bp, top), Indels (< 50 bp, middle), and SNVs (bottom) with the Y chromosome coloured by subregion. High peaks in heterochromatin are apparent for SVs, but are absent in SNVs and indels. b. Repeat element distribution across 10 samples with contiguously assembled PAR1 regions and the T2T Y. Repeat elements on sense (+) and antisense (-) strand are shown, coloured according to repeat class. Extensive differences in size can be seen between samples, especially in the satellite arrays located close to the telomere (in dark red), and substantial differences in repeat element composition in PAR1 vs. the male-specific XDR1 and XTR1 regions. The locations of PAR1, XDR1 and XTR1 subregions in each individual are shown in black, red and black, respectively. Please note that the maroon colour of the “Unknown” elements close to the telomere is caused by significant clustering of those elements. DNA: DNA repeat elements, snRNA: small nuclear RNA, tRNA: transfer RNA, rRNA: ribosomal RNA, srpRNA: signal recognition particle RNA, scRNA: small conditional RNA, RC: rolling circle.
Extended Data Fig. 3.
Extended Data Fig. 3.. Examples of structural variation identified in the assembled Y chromosomes.
a. Inversions identified in the AZFc/ampliconic 7 subregion. Top - comparison between the T2T Y and select de novo assemblies, bottom - GRCh38 Y and the de novo assemblies (see Fig. S34 for details on AZFc/ampliconic 7 subregion composition). Potential NAHR path is shown below the dotplot. b. Inverted duplication affecting roughly two thirds of the 161 kbp unique ‘spacer’ sequence in the P3 palindrome, spawning a second copy of the TTTY5 gene and elongating the LCRs in this region. A detailed sequence view reveals a high sequence similarity between the duplication and its template, and its placement in Y phylogeny supports emergence of this variant in the common ancestor of haplogroup E1a2 carried by NA19239, HG03248 and HG02572 (Fig. 3a).
Extended Data Fig. 4.
Extended Data Fig. 4.. RBMY1 gene similarity and architecture.
a. A schematic distribution of individual RBMY1 gene copies (filled rectangles) within analysed Y chromosome assemblies (42 + T2T + GRCh38). The RBMY1 gene copies are located in four primary regions (NA19239 carries a partial duplication of gene region 2 and the composition of HG02666 suggests at least one inversion within the RBMY regions). Fill colours refer to the assigned network community (NC) and indicates a similar sequence (Methods). Assembly of this region was not contiguous in HG03065 (brown line) and was not included in the analysis. b. A secondary directed network showing connections between NCs with the most similar consensus sequences. An edge pointing from one node to a second node indicates that the second node was the first’s closest match (i.e., most similar sequence; ties are allowed and shown as multiple edges stemming from a node). The width of the edge represents the sequence similarity between two nodes (i.e., NC consensus sequence similarity; thicker means fewer SNVs). The node size is representative of the total edges pointing to the node. c. RBMY1 phylogenetic analysis of exonic nucleotide sequences. Shown is the unrooted phylogenetic tree of RBMY1 genes constructed using a maximum likelihood approach (Methods). This tree is rooted at the midpoint with the total count of RBMY1 copies shown on the right. The scale bar represents the average number of substitutions per site. RBMY1 copies located in regions 1 and 2 (primarily dark blue, orange, dark/light green, and pink) distinguish themselves from those located downstream in regions 3 and 4 (primarily light blue and purple copies).
Extended Data Fig. 5.
Extended Data Fig. 5.. TSPY gene similarity and architecture.
a. TSPY array visualization of each sample with contiguous assembly in this region. Individual TSPY gene copies are shown (rectangles), and their colour is based on the assigned network community (NC) (Methods). Sample names with black rectangles (NA19331, HG03732 and HG03492) carry the IR3/IR3 inversion and were re-oriented for visualisation. Asterisks within individual gene copies indicate possible gene conversion (GC) or recombination (R) events unique to that gene copy. If a GC/R event is shared by a NC an asterisk is shown in the NC legend rectangle. The TSPY2 gene copy is shown as a red rectangle. b. A secondary directed network showing the sequence similarity between NC consensus sequences. An edge pointing from one node to a second node indicates that the second node was the first’s closest match (i.e., most similar sequence; ties are allowed and shown as multiple edges stemming from a node). The width of the edge represents the sequence similarity between two nodes (i.e., NC consensus sequence similarity; thicker means less SNVs). The node size is representative of the total edges pointing to the node. c. TSPY phylogenetic analysis of exonic nucleotide sequences. Shown is the unrooted phylogenetic tree of TSPY genes constructed using a maximum likelihood approach (Methods). This tree is rooted at the midpoint and the total count of TSPY copies is shown on the right. The scale bar represents the average number of substitutions per site. The early split/rise of NC1 within the tree, in conjunction with the secondary directed network and manual comparison of TSPY sequences (as well as their presence across all lineages) suggests that NC1 TSPY copies represent the ancestral TSPY gene sequence.
Extended Data Fig. 6.
Extended Data Fig. 6.. DNA methylation patterns as determined from the ONT data across the three contiguously assembled Y chromosomes.
Methylation patterns for samples: a. HG1890, b. HG02666 and c. HG00358. The three dot plots (in grey) show the smoothed DNAme levels, in 5 kbp windows for visualization, in beta-scale ranging from 0 (not methylated) to 1 (methylated). The locations of Yq12 repeat arrays (DYZ18, 2.7kb-repeat, 3.1kb-repeat, DYZ1 and DYZ2) and the Y-chromosomal subregions are shown below as bar plots.
Extended Data Fig. 7.
Extended Data Fig. 7.. Functional analyses on the Y chromosome with DNA-methylation, RNA expression and HiC information as anchored to GRCh38 Y.
a. The top three panels show DNA-methylation levels and variation over the studied chromosomes (n=41). In black (top dot plot) the average methylation is shown, in green (middle dot plot) the variation in DNAme levels across the studied genomes. The bottom boxplot represents the DNA methylation segmentation using PycoMeth-seg (Methods). In grey shades 2,861 methylation segments, and in red shades the 340 significantly differentially methylated segments (DMS). The CpG sites that fall in a DMS are coloured in a lighter shade in the top two dot plots, the dot plots are in beta-scale, ranging from 0 (not methylated) to 1 (methylated). b. Average insulation scores (top) and variance of insulation scores between any two samples (bottom) across 40 samples with Hi-C data with 10 kbp resolution. Regions with lower insulation scores are more insulated and more likely to be topologically associating domain (TAD) boundaries, while regions with higher scores are more likely to stay inside TADs (the regions between the two adjacent TAD boundaries). The y-axis represents the average insulation scores ranging from −2 (most insulated) to 2 (least insulated) and the variance insulation scores ranging from 0 (no variance) to 8 (more variance). c. The Geuvadis based gene-expression analysis, shown are the 205 genes on the Y chromosome (grey shades), the 64 genes expressed in the Geuvadis LCLs (blue shades), of which 22 are differentially expressed (red shades, Supplementary Results ‘Functional analysis’ for additional details).
Extended Data Fig. 8.
Extended Data Fig. 8.. Composition of the Y-chromosomal (peri-)centromeric regions.
a. Organization of the chromosome Y centromeric region from 21 genomes representing all major superpopulations. The structure (top), α-satellite HOR organization (middle), and sequence identity heat map (bottom) for each centromere is shown and reveals the presence of novel HORs in over half of the centromeres. Note - the sizes of the DYZ3 α-satellite array are shown on top as determined using RepeatMasker (Methods). b. Genetic landscape of the Y-chromosomal pericentromeric region for three select samples (see Figs. S47–S48 for all samples). The top panel shows locations and composition of the pericentromeric region with repeat array sizes shown for each Y chromosome (the DYZ3 α-satellite array size as determined using RepeatMasker, Methods). The middle panel shows (UL-)ONT read depth and bottom sequence identity head maps generated using StainedGlass pipeline (using a 5 kbp window size).
Extended Data Fig. 9.
Extended Data Fig. 9.. Divergence of DYZ18, Yq11 /Yq12 transition region and DYZ1 repeat units.
An overview of the Bray-Curtis distance/dissimilarity of k-mer abundance profiles for individual DYZ18 (grey), 3.1-kbp (red), 2.7-kbp (blue) and DYZ1 (black) repeats versus their consensus sequence. The Yq11/transition region/Yq12 are shown for each of the seven samples with a completely assembled Yq12 subregion. Lighter colours indicate less distance/dissimilarity (i.e., more similar) k-mer abundance profiles compared to their consensus sequence. Results indicate that arrays located on the proximal and distal boundaries of the Yq12 subregion contain repeats with k-mer abundance compositions less similar to their consensus sequence (i.e., more diverged). The size of individual lines is a function of the length of the repeat. The repeat unit orientation (above = sense, below = antisense) was determined based on RepeatMasker annotations of satellite sequences within repeats (Methods).
Extended Data Fig. 10.
Extended Data Fig. 10.. Divergence of Yq12 DYZ2 repeat units
An overview of the divergence of individual DYZ2 subunits for a. samples with completely assembled Yq12 subregion (HG01890, HG02666, HG01106, HG02011, T2T Y, HG00358, HG01952), and b. the two most closely related genomes (NA19317 and NA19347) with incompletely assembled Yq12 subregions. The size of individual lines is a function of the length of the repeat. The repeat unit orientation (above = sense, below = antisense) was determined based on RepeatMasker annotations of satellite sequences within repeats (Methods). A higher divergence was observed within the subunits located in arrays at the proximal and distal ends of the Yq12 subregion. Additionally, DYZ2 subunits located near the boundaries of individual arrays tend to be more diverged than those located centrally. Between the closely related genomes, the divergence of DYZ2 repeats within the shared DYZ2 arrays are highly similar.
Fig. 1.
Fig. 1.. De novo assembly outcome.
a. Human Y chromosome structure based on the GRCh38 Y reference sequence. b. Phylogenetic relationships (left) with haplogroup labels of the analysed Y chromosomes with branch lengths drawn proportional to the estimated times between successive splits (see Fig. S1 and Table S1 for additional details). Summary of Y chromosome assembly completeness (right) with black lines representing non-contiguous assembly of that region (Methods). Numbers on the right indicate the number of Y contigs needed to achieve the indicated contiguity/total number of assembled Y contigs for each sample. CEN - centromere - includes the DYZ3 α-satellite array and the pericentromeric region. Three contiguously assembled Y chromosomes are in bold and marked with an asterisk (assemblies for HG02666 and HG00358 are contiguous from telomere to telomere, while HG01890 assembly has a break approximately 100 kbp before the end of PAR2) and the T2T Y is in bold and underlined. The colour of sample ID corresponds to the superpopulation designation (see panel d). Note - GRCh38 Y sequence mostly represents Y haplogroup R1b. c. The proportion of contiguously assembled Y-chromosomal subregions across 43 samples. d. Geographic origin and sample size of the included 1000 Genomes Project samples coloured according to the continental groups (AFR, African; AMR, American; EUR, European; SAS, South Asian; EAS, East Asian). Superpop - super population. e. Y-chromosomal assembly length vs. number of Y contigs. Gap sequences (N’s) were excluded from GRCh38 Y. f. Y-chromosomal assembly length vs. Y contig NG50. High coverage defined as >50⨉ genome-wide PacBio HiFi read depth. Gap sequences (N’s) were excluded from GRCh38 Y.
Fig. 2.
Fig. 2.. Size and structural variation of Y chromosomes.
a. Size variation of contiguously assembled Y-chromosomal subregions shown as a heatmap relative to the T2T Y size (as 100%). Boxes in grey indicate regions not contiguously assembled (Methods). Numbers on the bottom indicate contiguously assembled samples for each subregion out of a total of 43 samples, and numbers on the right indicate the contiguously assembled Y subregions out of 24 regions for each sample. Samples are coloured as on Fig. 1b. b. Comparison of the three contiguously assembled Y chromosomes to GRCh38 and the T2T Y (excluding Yq12 and PAR2 subregions). c. Dot plots of three contiguously assembled Y chromosomes vs. the T2T Y (excluding Yq12 and PAR2), annotated with Y subregions and segmental duplications in ampliconic subregion 7 (see Fig. S34 for details).
Fig. 3.
Fig. 3.. Characterization of large SVs.
a. Distribution of 14 euchromatic inversions in phylogenetic context, with the schematic of the GRCh38 Y structure shown above, annotated with Y subregions, inverted repeat locations, palindromes (P1-P8), and segmental duplications in ampliconic subregion 7 (see Fig. S34 for details), with inverted segments indicated below. Samples are coloured as in Fig. 1b. b. Inversion breakpoint identification in the IR3 repeats. Light brown box (also in a and c) indicates samples that have likely undergone two inversions: one changing the location of the single, TSPY2 gene-containing, repeat unit from proximal to distal IR3 repeat and second reversing the region between the IR3 repeats, shared by haplogroup QR samples (Fig. S34, Supplementary Results Y-chromosomal Inversions). Asterisks indicate samples that have undergone an additional IR3 inversion. Informative PSVs are shown as vertical darker lines in each of the arrows. Samples with non-contiguous IR3 assembly are indicated by grey lines. c. Distribution of pseudogenes within the TSPY repeat array. The total number of TSPY genes located within the ~20.3 kbp TSPY repeat units is shown on the left. Samples marked with asterisks in b carry the TSPY array in reverse orientation and were reoriented for visualization. The low divergence (≤2%) pseudogenes (coloured boxes) originate from five events: two nonsense mutations (light blue, maroon), two one nucleotide indel deletions (yellow, green), and one 5’ structural variation that deletes ~370 nucleotides of the proximal half of exon 1 (purple). An additional sixth event was identified (i.e., a premature stop codon within the fourth TSPY copy in the array of HG03009, in pink), but was deemed unlikely to result in nonsense-mediated decay as it was located only three codons before the canonical stop codon. Refer to panel a for sample IDs and phylogenetic relationships.
Fig. 4.
Fig. 4.. DYZ19 and centromeric repeat arrays.
a. Sequence identity heatmap of the DYZ19 repeat array from NA19331 (E1b1b1b2b2a1-M293) (using 1 kbp window size) highlighting the higher sequence similarity within central and distal regions. b. Genetic landscape of the chromosome Y centromeric region from HG03371 (E1b1a1a1a1c1a-CTS1313). This centromere harbours the ancestral 36-monomer higher-order repeats (HORs), from which the canonical 34-monomer HOR is derived (Fig. S46). Mon - monomer; CEN - centromere.
Fig. 5.
Fig. 5.. Yq12 heterochromatic region.
a. Yq12 heterochromatic subregion sequence identity heatmap in 5 kbp windows for two samples with repeat array annotations. b. Bar plot of DYZ1 and DYZ2 total repeat array lengths (top), boxplots of individual array lengths (middle) and total number of DYZ1 and DYZ2 repeat units (bottom) within contiguously assembled genomes. Black dots represent individual arrays. Statistically significant p-values comparing DYZ1 and DYZ2 array lengths within each assembly and n values are shown (alpha=0.05, two-sided Mann-Whitney U test, Methods). Boxplot limits indicate quartiles, the whiskers encompass the full range of the data (except for ‘outliers’), and the median is indicated by the center line. c. DYZ2 repeat array inversions in the proximal and distal ends of the Yq12 subregion. DYZ2 repeats are coloured based on their divergence estimate and visualized based on their orientation (sense - up, antisense - down). d. Detailed representation of DYZ2 subunit divergence estimates for HG02011 (see panel c for colour legend). e. Heatmaps showing the inter-DYZ2 repeat array subunit composition similarity within a sample. Similarity is calculated using the Bray-Curtis index (1 – Bray-Curtis Distance, 1.0 = the same composition). DYZ2 repeat arrays are shown in physical order from proximal to distal (from top down, and from left to right). f. Mobile element insertions identified in the Yq12 subregion. We identified four putative Alu insertions across the seven gapless Yq12 assemblies. Their approximate location, as well as expansion and contraction dynamics of Alu insertion containing DYZ repeat units, are shown (right). Following the insertion into the DYZ repeat units, lineage-specific contractions and expansions occurred. Two Alu insertions (A1 and A2) occurred prior to the radiation of Y haplogroups (at least 180,000 years ago), while two additional Alu elements represent lineage-specific insertions. The total length of the Yq12 region is indicated on the right.

Comment in

Similar articles

Cited by

  • eXclusionarY: 10 years later, where are the sex chromosomes in GWASs?
    Sun L, Wang Z, Lu T, Manolio TA, Paterson AD. Sun L, et al. Am J Hum Genet. 2023 Jun 1;110(6):903-912. doi: 10.1016/j.ajhg.2023.04.009. Am J Hum Genet. 2023. PMID: 37267899 Free PMC article. Review.
  • The effects of loss of Y chromosome on male health.
    Bruhn-Olszewska B, Markljung E, Rychlicka-Buniowska E, Sarkisyan D, Filipowicz N, Dumanski JP. Bruhn-Olszewska B, et al. Nat Rev Genet. 2025 May;26(5):320-335. doi: 10.1038/s41576-024-00805-y. Epub 2025 Jan 2. Nat Rev Genet. 2025. PMID: 39743536 Review.
  • Small variant benchmark from a complete assembly of X and Y chromosomes.
    Wagner J, Olson ND, McDaniel J, Harris L, Pinto BJ, Jáspez D, Muñoz-Barrera A, Rubio-Rodríguez LA, Lorenzo-Salazar JM, Flores C, Sahraeian SME, Narzisi G, Byrska-Bishop M, Evani US, Xiao C, Lake JA, Fontana P, Greenberg C, Freed D, Mootor MFE, Boutros PC, Murray L, Shafin K, Carroll A, Sedlazeck FJ, Wilson M, Zook JM. Wagner J, et al. Nat Commun. 2025 Jan 8;16(1):497. doi: 10.1038/s41467-024-55710-z. Nat Commun. 2025. PMID: 39779690 Free PMC article.
  • Complex genetic variation in nearly complete human genomes.
    Logsdon GA, Ebert P, Audano PA, Loftus M, Porubsky D, Ebler J, Yilmaz F, Hallast P, Prodanov T, Yoo D, Paisie CA, Harvey WT, Zhao X, Martino GV, Henglin M, Munson KM, Rabbani K, Chin CS, Gu B, Ashraf H, Scholz S, Austine-Orimoloye O, Balachandran P, Bonder MJ, Cheng H, Chong Z, Crabtree J, Gerstein M, Guethlein LA, Hasenfeld P, Hickey G, Hoekzema K, Hunt SE, Jensen M, Jiang Y, Koren S, Kwon Y, Li C, Li H, Li J, Norman PJ, Oshima KK, Paten B, Phillippy AM, Pollock NR, Rausch T, Rautiainen M, Song Y, Söylev A, Sulovari A, Surapaneni L, Tsapalou V, Zhou W, Zhou Y, Zhu Q, Zody MC, Mills RE, Devine SE, Shi X, Talkowski ME, Chaisson MJP, Dilthey AT, Konkel MK, Korbel JO, Lee C, Beck CR, Eichler EE, Marschall T. Logsdon GA, et al. Nature. 2025 Aug;644(8076):430-441. doi: 10.1038/s41586-025-09140-6. Epub 2025 Jul 23. Nature. 2025. PMID: 40702183 Free PMC article.
  • Small polymorphisms are a source of ancestral bias in structural variant breakpoint placement.
    Audano PA, Beck CR. Audano PA, et al. Genome Res. 2024 Feb 7;34(1):7-19. doi: 10.1101/gr.278203.123. Genome Res. 2024. PMID: 38176712 Free PMC article.

References

    1. Skaletsky H et al. The male-specific region of the human Y chromosome is a mosaic of discrete sequence classes. Nature 423, 825–837 (2003). - PubMed
    1. Porubsky D et al. Recurrent inversion polymorphisms in humans associate with genetic instability and genomic disorders. Cell 185, 1986–2005.e26 (2022). - PMC - PubMed
    1. Charlesworth B & Charlesworth D The degeneration of Y chromosomes. Philos. Trans. R. Soc. Lond. B Biol. Sci 355, 1563–1572 (2000). - PMC - PubMed
    1. Vollger MR et al. Segmental duplications and their variation in a complete human genome. Science 376, eabj6965 (2022). - PMC - PubMed
    1. Altemose N, Miga KH, Maggioni M & Willard HF Genomic characterization of large heterochromatic gaps in the human genome assembly. PLoS Comput. Biol 10, e1003628 (2014). - PMC - PubMed