. 2023 Sep;621(7978):344-354.
doi: 10.1038/s41586-023-06457-y. Epub 2023 Aug 23.

The complete sequence of a human Y chromosome

Arang Rhie #  1 Sergey Nurk #  1   2 Monika Cechova #  3   4 Savannah J Hoyt #  5 Dylan J Taylor #  6 Nicolas Altemose  7 Paul W Hook  8 Sergey Koren  1 Mikko Rautiainen  1 Ivan A Alexandrov  9   10   11 Jamie Allen  12 Mobin Asri  13 Andrey V Bzikadze  14 Nae-Chyun Chen  15 Chen-Shan Chin  16   17 Mark Diekhans  13 Paul Flicek  12   18 Giulio Formenti  19 Arkarachai Fungtammasan  20 Carlos Garcia Giron  12 Erik Garrison  21 Ariel Gershman  8 Jennifer L Gerton  22   23 Patrick G S Grady  5 Andrea Guarracino  21   24 Leanne Haggerty  12 Reza Halabian  25 Nancy F Hansen  1   26 Robert Harris  27 Gabrielle A Hartley  5 William T Harvey  28 Marina Haukness  13 Jakob Heinz  8 Thibaut Hourlier  12 Robert M Hubley  29 Sarah E Hunt  12 Stephen Hwang  30 Miten Jain  31 Rupesh K Kesharwani  32 Alexandra P Lewis  28 Heng Li  33   34 Glennis A Logsdon  28 Julian K Lucas  4   13 Wojciech Makalowski  25 Christopher Markovic  35 Fergal J Martin  12 Ann M Mc Cartney  1 Rajiv C McCoy  6 Jennifer McDaniel  36 Brandy M McNulty  4   13 Paul Medvedev  37   38   39 Alla Mikheenko  10   40 Katherine M Munson  28 Terence D Murphy  41 Hugh E Olsen  4   13 Nathan D Olson  36 Luis F Paulin  32 David Porubsky  28 Tamara Potapova  22 Fedor Ryabov  42 Steven L Salzberg  43 Michael E G Sauria  6 Fritz J Sedlazeck  32   44 Kishwar Shafin  45 Valery A Shepelev  46 Alaina Shumate  8 Jessica M Storer  29 Likhitha Surapaneni  12 Angela M Taravella Oill  47 Françoise Thibaud-Nissen  41 Winston Timp  8 Marta Tomaszkiewicz  27   48 Mitchell R Vollger  28 Brian P Walenz  1 Allison C Watwood  27 Matthias H Weissensteiner  27 Aaron M Wenger  49 Melissa A Wilson  47 Samantha Zarate  15 Yiming Zhu  32 Justin M Zook  36 Evan E Eichler  28   50 Rachel J O'Neill  5   51   52 Michael C Schatz  6   15 Karen H Miga  4   13 Kateryna D Makova  27 Adam M Phillippy  53
Affiliations

The complete sequence of a human Y chromosome

Arang Rhie et al. Nature. 2023 Sep.

Abstract

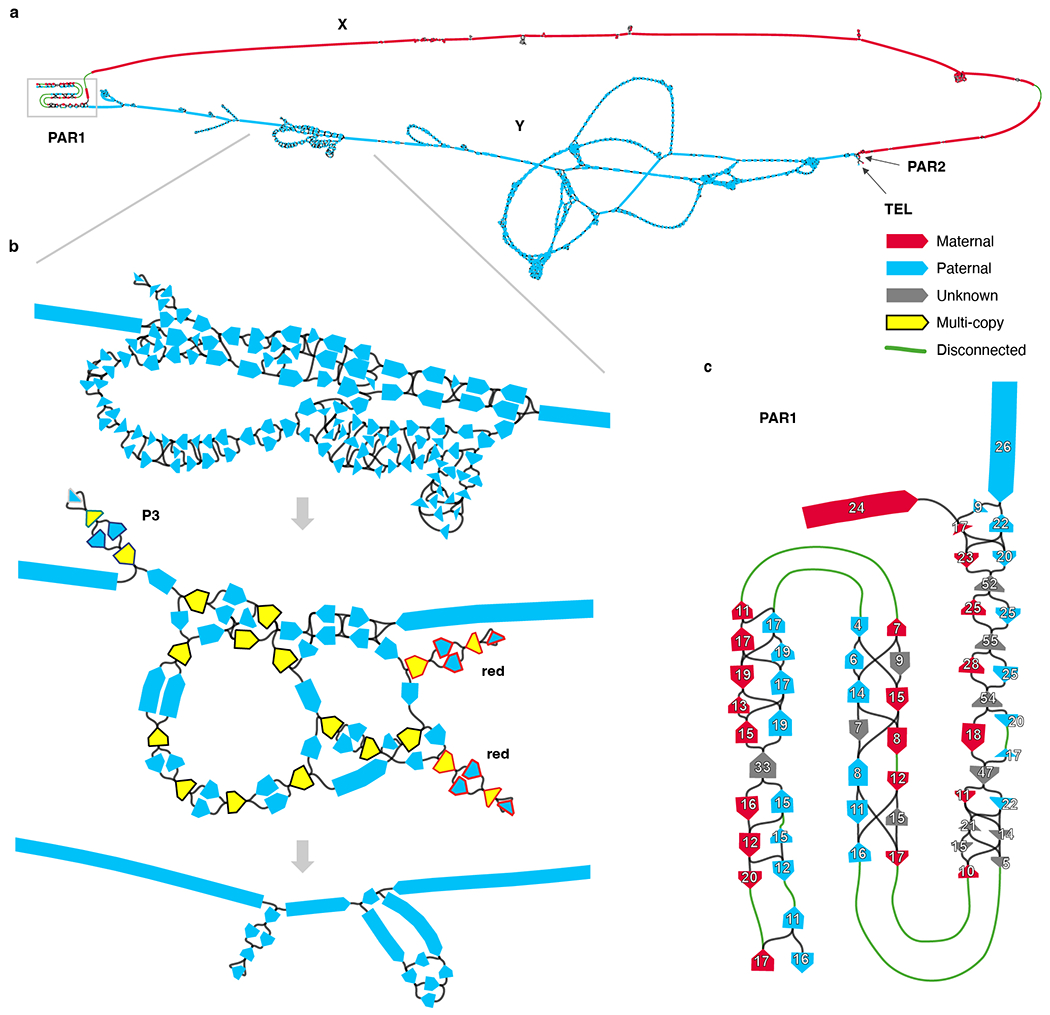
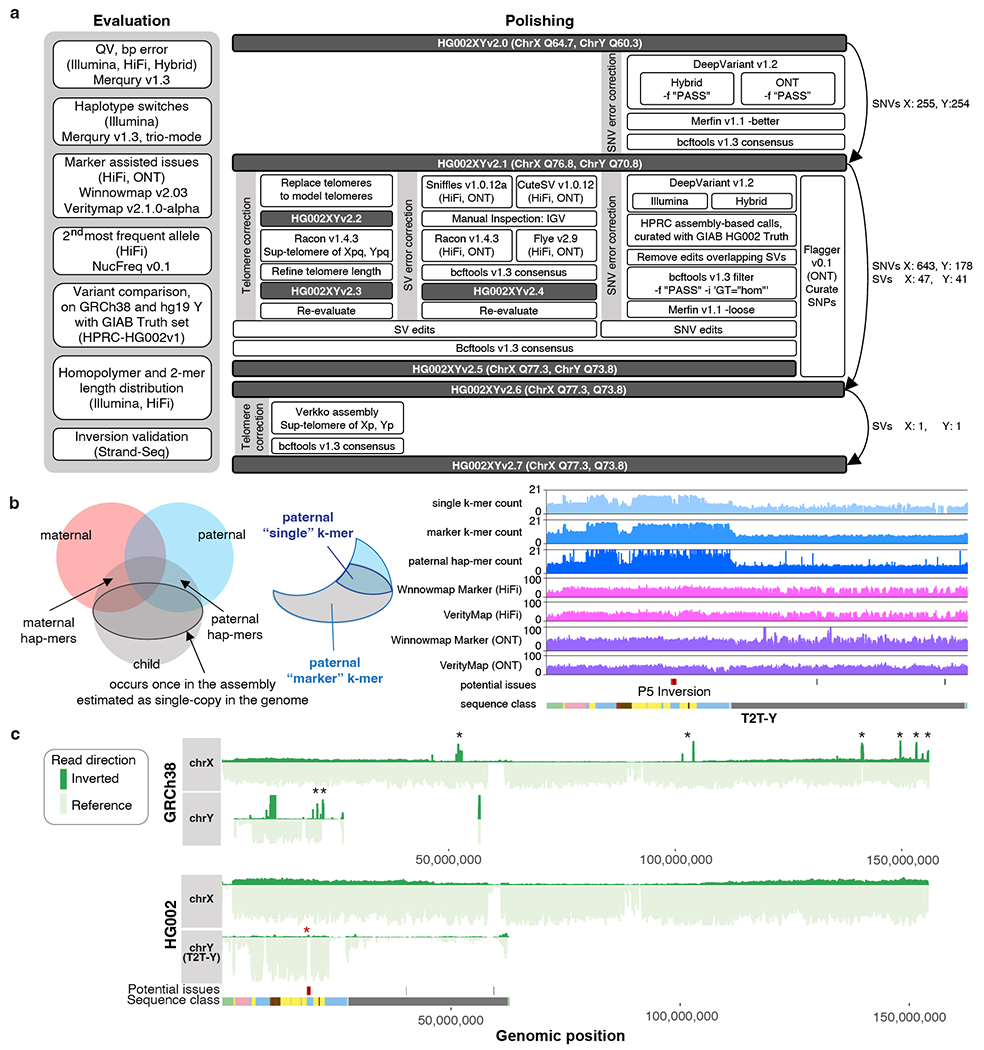
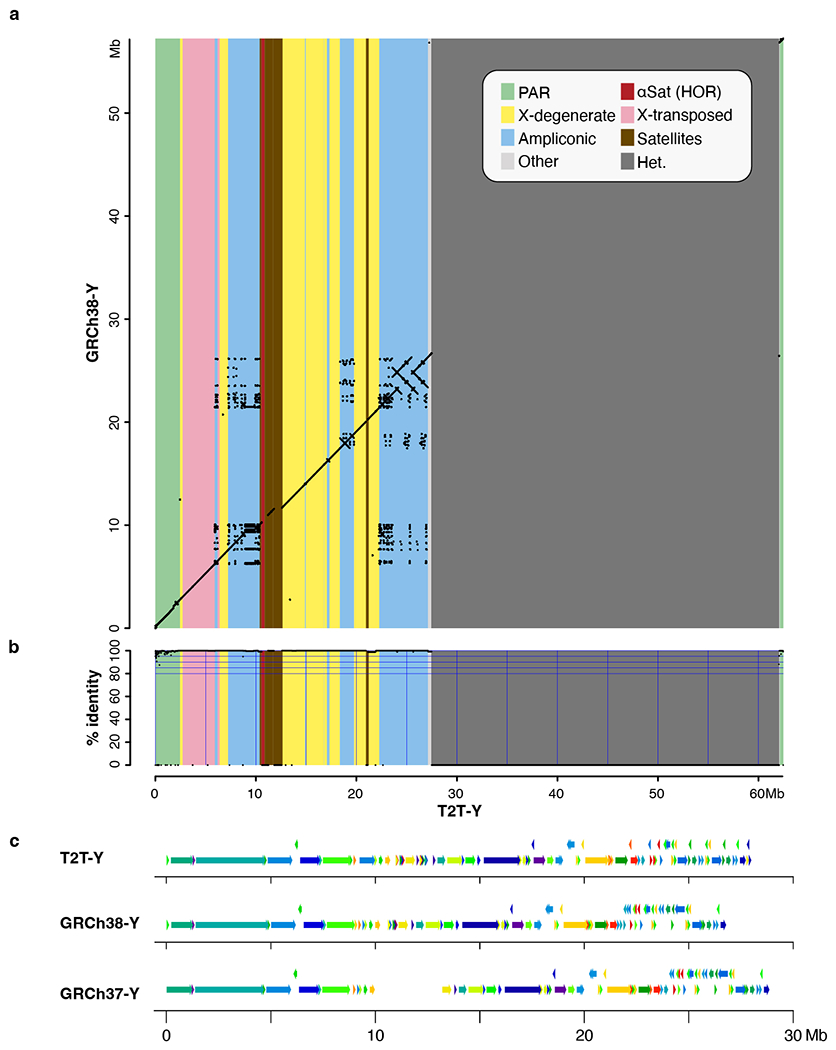
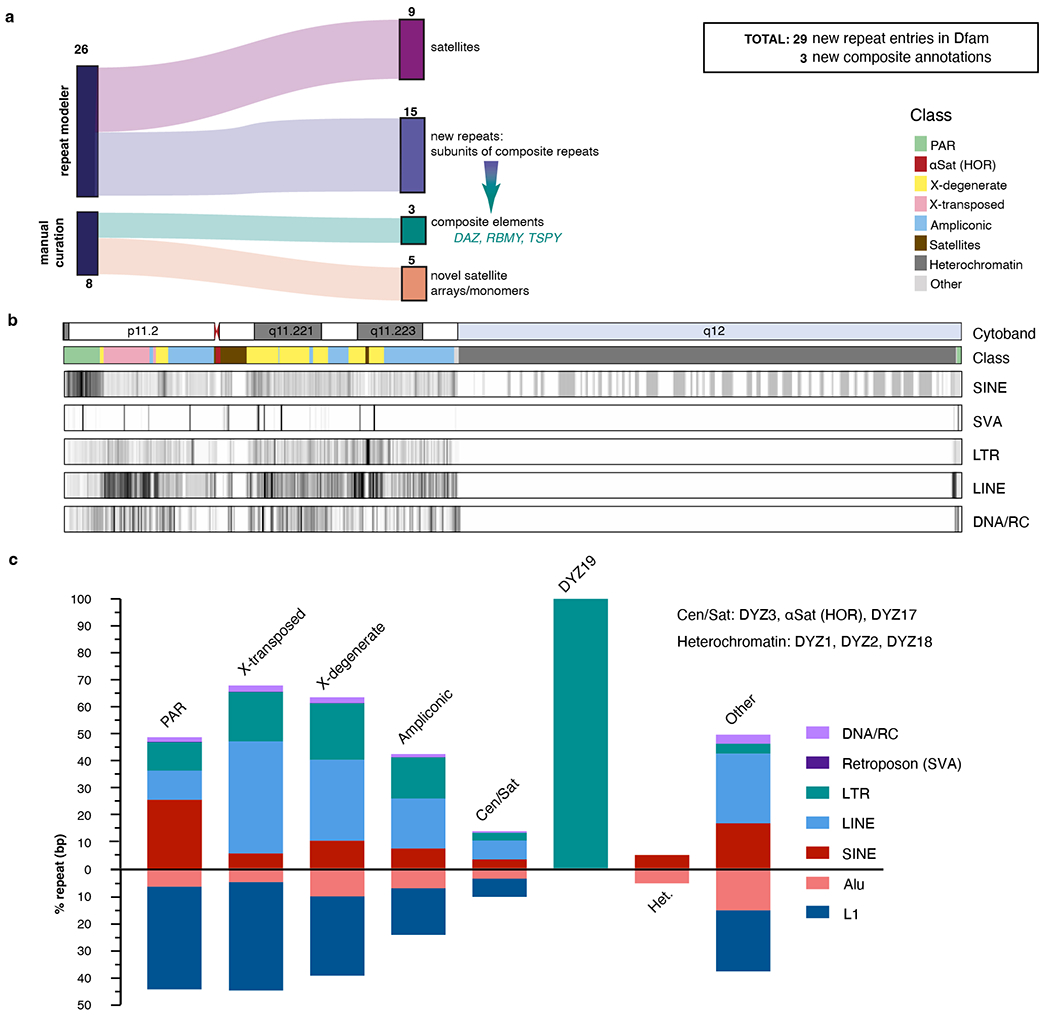
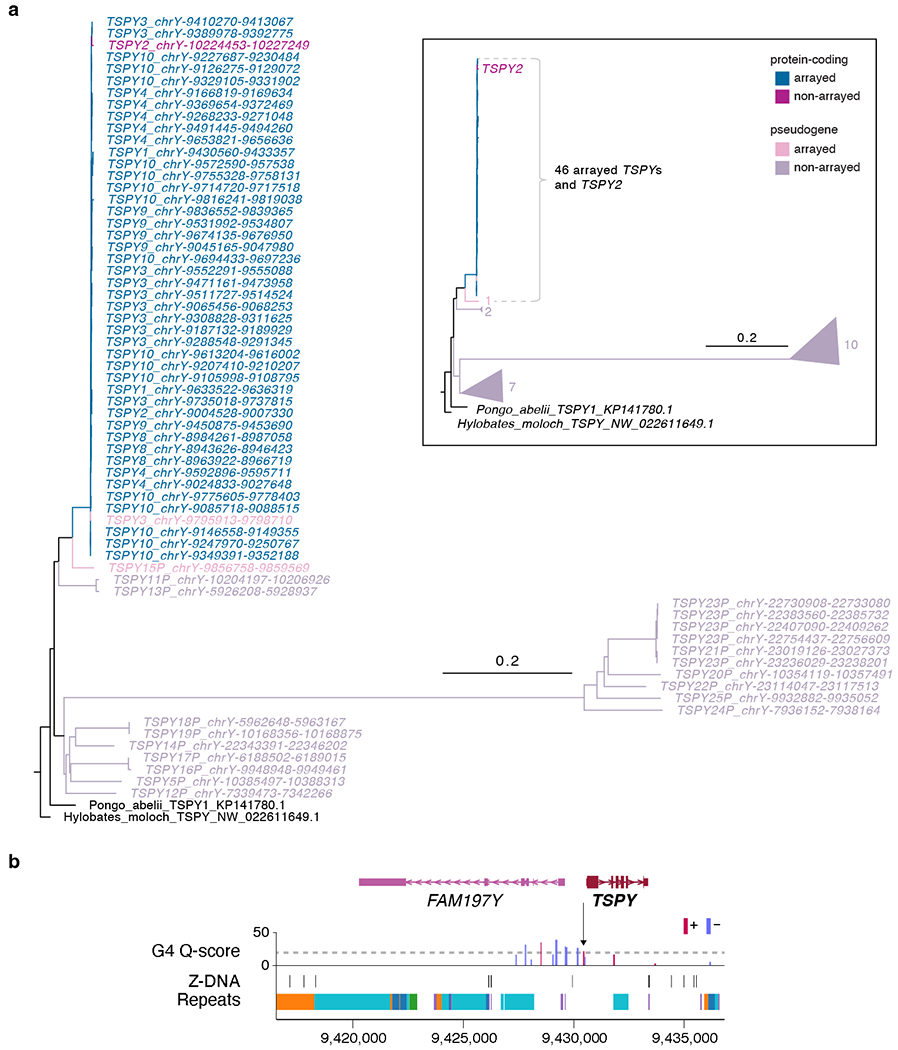
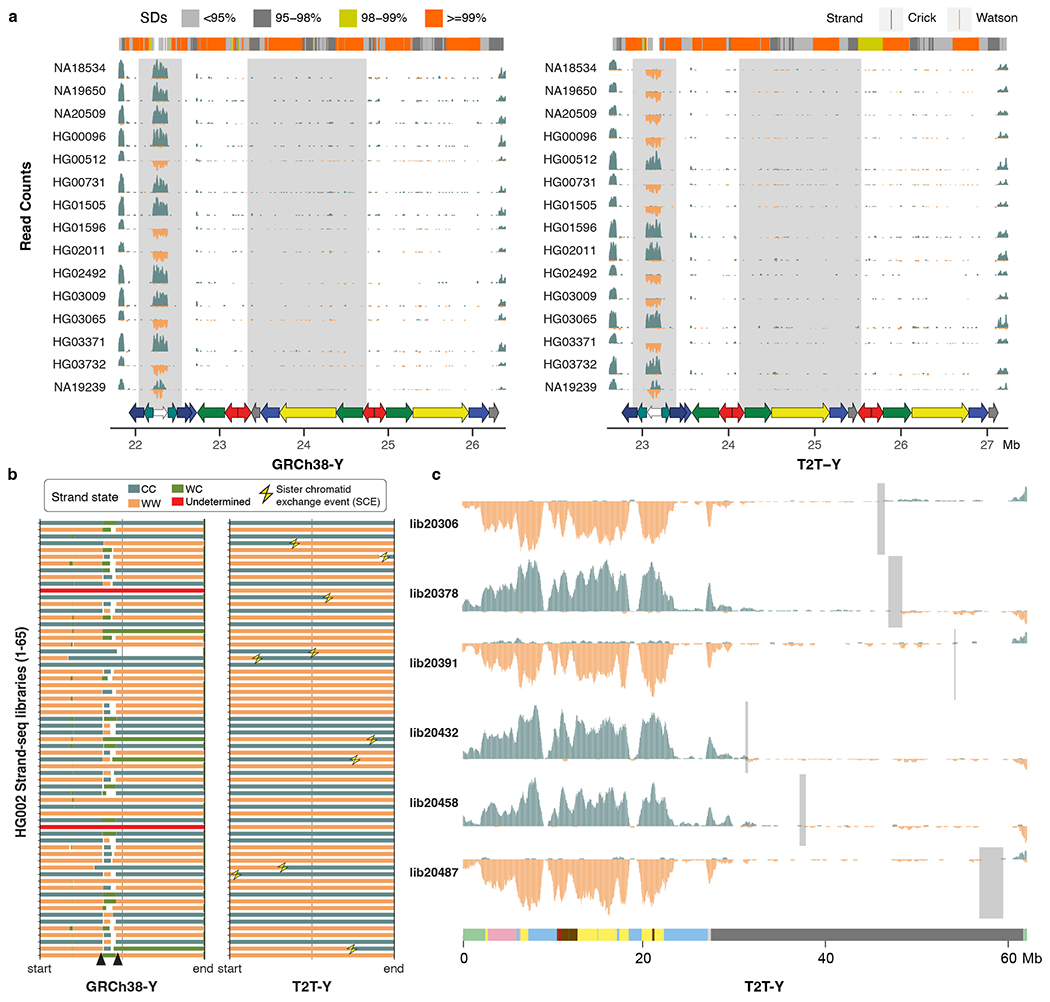
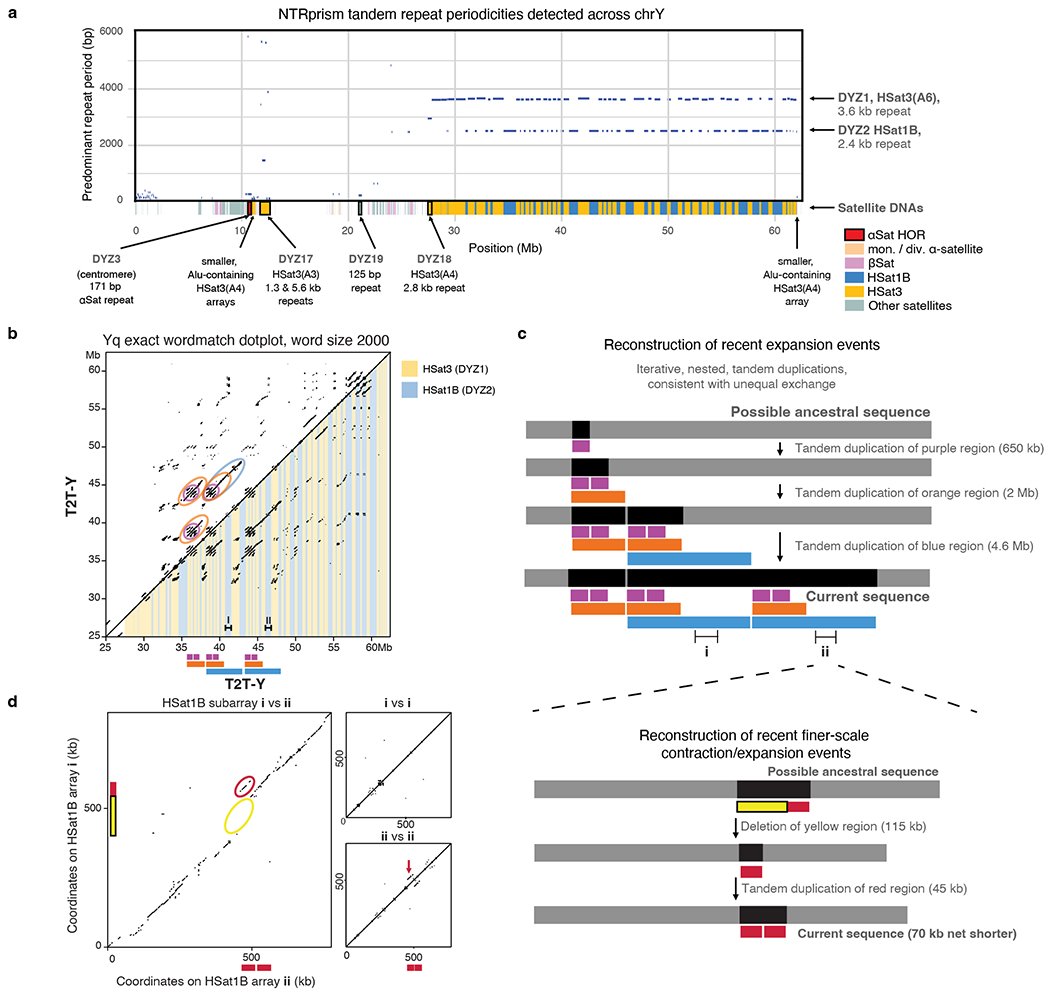
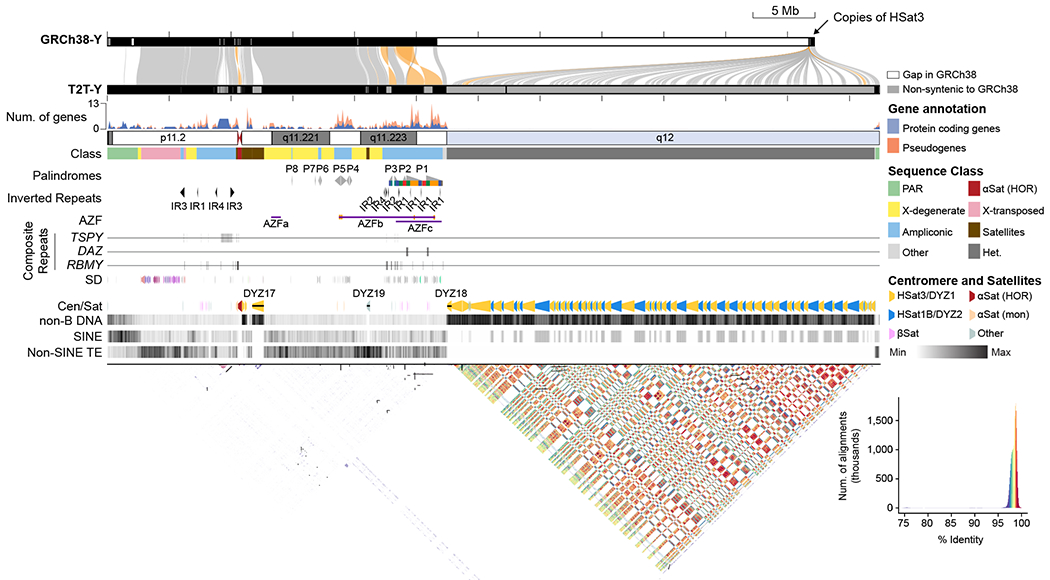
The human Y chromosome has been notoriously difficult to sequence and assemble because of its complex repeat structure that includes long palindromes, tandem repeats and segmental duplications1-3. As a result, more than half of the Y chromosome is missing from the GRCh38 reference sequence and it remains the last human chromosome to be finished4,5. Here, the Telomere-to-Telomere (T2T) consortium presents the complete 62,460,029-base-pair sequence of a human Y chromosome from the HG002 genome (T2T-Y) that corrects multiple errors in GRCh38-Y and adds over 30 million base pairs of sequence to the reference, showing the complete ampliconic structures of gene families TSPY, DAZ and RBMY; 41 additional protein-coding genes, mostly from the TSPY family; and an alternating pattern of human satellite 1 and 3 blocks in the heterochromatic Yq12 region. We have combined T2T-Y with a previous assembly of the CHM13 genome4 and mapped available population variation, clinical variants and functional genomics data to produce a complete and comprehensive reference sequence for all 24 human chromosomes.


Conflict of interest statement

S.N. is now an employee of Oxford Nanopore Technologies; S.K. has received travel funds to speak at events hosted by Oxford Nanopore Technologies; A.F. is an employee of DNAnexus; C.-S.C. is an employee of GeneDX Holdings Corp.; N.-C.C. is an employee of Exai Bio; L.F.P. receives research support from Genetech; F.J.S. receives research support from Pacific Biosciences, Oxford Nanopore Technologies, Illumina, and Genetech; K.S. is an employee of Google LLC and owns Alphabet stock as part of the standard compensation package; W.T. has two patents (8,748,091 and 8,394,584) licensed to Oxford Nanopore Technologies; E.E.E. is a scientific advisory board member of Variant Bio, Inc. All other authors declare no competing interests.

Figures

Extended Data Fig. 1 |
Extended Data Fig. 1 |. Assembling the X and Y chromosomes of HG002.
a. Chromosome X and Y components of the assembly string graph built from HiFi reads, detected based on node sequence alignments to T2T-CHM13 and GRCh38 references. Each node is colored according to the excess of paternal-specific (blue) and maternal-specific (red) k-mers, obtained from parental Illumina reads, indicating if they exclusively belong to chromosome Y or X, respectively. Most complicated tangles are localized within the heterochromatic satellite region on the Y q-arm. The X and Y subgraphs are connected in PAR1 and PAR2. Graph discontinuities are due to a lack of HiFi sequence coverage in these regions caused by contextual sequencing bias, with 9 out of 11 observed breaks falling within PAR1 on either chromosome (5 out of 5 for chromosome Y). Note that for visualization purposes the length of shorter nodes is artificially increased making the extent of the tangles appear larger than reality. b. The effects of manual pruning and semi-automated ONT read integration is illustrated from top to bottom. Top, zoomed in view of a tangle encoding the P1–P3 palindromic region in Y (approx. 22.86–27.08 Mb, see Fig. 4). Middle, corresponding subgraph following the manual pruning and recompaction. Nodes excluded from the curated “single-copy” list for automated ONT-based repeat resolution are shown in yellow. Three hairpin structures are highlighted, which form almost-perfect inverted tandem repeats encompassing the entire P3 and two P2 (red) palindromes. Node outlines in the palindromes are colored according to the palindromic arms as in Fig. 4. Bottom, corresponding subgraph following the repeat resolution using ONT read-to-graph alignments. Remaining ambiguities were resolved by evaluating ONT read alignments to all candidate reconstructions of the corresponding sub-regions. c. PAR1 subgraph labeled with HiFi read coverage on each node. Gaps (green edges) and uneven node coverage estimates indicate biases in HiFi sequencing across the region. Fig. 1 shows an enrichment of SINE repeats and non-B DNA motifs in PAR1 that may underlie the sequencing gaps in this region.
Extended Data Fig. 2 |
Extended Data Fig. 2 |. Validation and polishing of the T2T-Y.
a. Evaluation and polishing workflow performed on T2T-CHM13v1.1 autosomes + HG002 XY assemblies. b. Venn diagram of the k-mers from the parents and child. On the left, hap-mers represent haplotype specific k-mers inherited by the child. The darker outlined circle inside the child k-mers represent single-copy k-mers (k-mers occurring once in the assembly and single-copy in the child’s genome). Right figure shows an example of the paternal specific, “single-copy” and “marker” k-mers. The marker set includes both multi-copy and single-copy k-mers specific to the paternal haplotype that were inherited by the child. Unlike polishing the nearly haploid CHM13 assembly, both single-copy k-mers and marker k-mers were used for the marker-assisted alignments to HG002 XY. This helped align more reads within repetitive regions to the correct chromosome for evaluation during polishing. Right panel shows counts of the k-mers and coverage of HiFi and ONT reads using the marker-assisted Winnowmap2 alignment, in addition to alignments from VerityMap, which uses locally unique k-mers for anchoring the reads. c. Aggregated Strand-seq coverage profile across all 65 libraries on GRCh38-Y (top) and T2T-Y (bottom). Each bar represents read counts in every 20 kb bin supporting the reference in forward direction (light green) or reverse direction (dark green). Multiple spikes in reverse direction (black asterisks) in GRCh38-Y indicate inversion polymorphisms relative to HG002, likely due to differences between the haplogroups. Such spikes in coverage are not observed on T2T-X and T2T-Y, which confirm the structural and directional accuracy of the HG002 assemblies. A 3 kb inversion of the unique sequence between the P5 palindromic arms was identified as erroneous in T2T-Y (red asterisk), but was confirmed to be polymorphic in the population and left uncorrected in this version of the assembly.
Extended Data Fig. 3 |
Extended Data Fig. 3 |. Large structural differences between T2T-Y and previous GRCh Y assemblies.
a-b. Ampliconic genes and X-degenerate sequences revealed from alignments between GRCh38-Y (Y-axis) and T2T-Y (X-axis). a. Dotplot generated using LastZ after softmasking with WindowMasker. b. Identity was computed from matches and mismatches over positions with alignments, excluding gaps. c. Structural differences revealed using PRG-TK against GRCh38-Y and GRCh37-Y in the euchromatic region of the Y chromosome.
Extended Data Fig. 4 |
Extended Data Fig. 4 |. Repeat discovery and annotation of T2T-Y.
a. Assembly completion allowed for a full assessment of repeats and resulted in the identification of previously unknown satellite arrays (predominantly in the PAR1) and subunit repeats that fall within one of three composite repeat units (TSPY, RBMY, DAZ). b. Ideogram of TE density (per 100 kb bin). This is an extension of Fig. 1 with non-SINEs expanded into separate TE classes (SVA, LTR, LINE, DNA/RC). Density scale ranges from low (white, zero) to high (black, relative to total density) and sequence classes are denoted by color. c. Summary (in terms of base coverage per region) across all five TE classes and two specific families: Alu/SINE and L1/LINE. The satellites in (b) were kept separate as two categories; Cen/Sat as the left satellite block including alpha satellites and DYZ19, while all other categories were combined per sequence classes.
Extended Data Fig. 5 |
Extended Data Fig. 5 |. Non-B DNA motifs along the T2T-Y.
HSat3 on the Yq and satellite sequences around the centromere are more enriched with A-phased repeats, direct repeats and STRs, while HSat1B is more enriched with inverted repeats and mirror repeats. Enrichment of non-B DNA sequences were also observed in the PAR region. Notably, the TSPY gene array is enriched for G4 and Z-DNA motifs, as shown in Extended Data Fig. 6b.
Extended Data Fig. 6 |
Extended Data Fig. 6 |. Phylogenetic tree analysis of the ampliconic TSPY gene family and pattern of non-B DNA structure.
a. Phylogenetic tree analysis using protein-coding TSPYs from a Sumatran Orangutan (Pongo abelii) and a Silvery gibbon (Hylobates moloch) as outgroups confirmed TSPY2 (distal to the array) and TSPY copies within the array originated from the same branch, distinguished from the rest of the TSPY pseudogenes. Rectangular inset shows a cartoon representation of the simplified tree. Numbers next to the triangles indicate the number of TSPY genes in the same branch. b. G4 and Z-DNA structures predicted for a typical TSPY copy inside the TSPY array. All TSPY copies in the array have the same signature, with one G4 peak present ~500 bases upstream of the TSPY (arrow). Higher Quadron score (Q-score) indicates a more stable G4 structure, with scores over 19 considered stable (dotted line).
Extended Data Fig. 7 |
Extended Data Fig. 7 |. Recurrent inversions identified with Strand-seq.
a. Five out of 15 individuals have the inverted variant as present in HG002 at the P3 palindrome (white arrow). Although inversions across P1–P2 (yellow and red arrows) are difficult to confirm with Strand-seq because of the high sequence similarity between the palindromic arms, different orientations are observable in these samples. b. Strand states for 65 Strand-seq libraries of HG002. Depending on the mappings of directional Strand-seq reads (+ reads: ‘Crick’, C, - reads: ‘Watson’, W), reference sequence was assigned in three states: WC, WW, and CC. WC, roughly equal mixture of plus and minus reads; WW, all reads mapped in minus orientation; CC, all reads mapped in plus orientation. Changes in strand state along a single chromosome are normally caused by a double-strand-break (DSBs) that occurred during DNA replication in a random fashion and we refer to them as sister-chromatid-exchanges (SCEs, yellow thunderbolts). Recurrent change in strand state over the same region in multiple Strand-seq cells indicates misassembly. Similarly, collapsed or incomplete assembly of a certain genomic region will result in a recurrent strand state change as observed for GRCh38-Y (black arrowheads). In contrast, T2T-Y shows strand state changes randomly distributed along each Strand-seq library with no evidence of misassembly or collapse. c. Strand-seq profile of selected libraries over T2T-Y summarized in bins (bin size: 500 kb, step size: 50 kb). Teal, Crick read counts; orange, Watson read counts. As ChrY is haploid, reads are expected to map only in Watson or Crick orientation. Light gray rectangles highlight regions where SCEs were detected in the heterochromatic Yq12 despite a lower coverage of Strand-seq reads. A modified breakpointR parameter was used (windowsize = 500000 minReads = 20) in order to refine detected SCEs presented in panel b and c.
Extended Data Fig. 8 |
Extended Data Fig. 8 |. Satellite annotation and recent expansion events in the Yq heterochromatin.
a. A plot showing the top repeat periodicities detected by NTRprism in 50 kb blocks tiled across T2T-Y, with centromeric satellite annotations overlaid on the X axis. Large arrays are labeled with their historic nomenclature, HSat subfamilies, and predominant repeat periodicities. b. An exact 2000-mer match dotplot of the Yq region (a dot is plotted when an identical 2000 base sequence is found at positions X and Y). The lower triangle has DYZ1/DYZ2 annotations overlaid as yellow and blue bars, respectively. Circled patterns in the upper triangle correspond to recent iterative duplication events, which are illustrated below the X axis. c. A reconstruction of a possible sequence of recent iterative duplications that could explain the observed dotplot patterns. d. A 2000-mer dotplot comparison of two ~800 kb HSat1B sub-arrays that were part of a recent large duplication event, along with self-self comparisons of the same arrays, revealing sites of more recent and smaller-scale deletions and expansions (annotated in yellow and red, with a possible sequence of events illustrated by the schematic on the right).
Extended Data Fig. 9 |
Extended Data Fig. 9 |. Genomic similarity in PARs and XTR and improved MAPQ of the PARs through informed sex chromosome complement reference.
a. Dotplots from LASTZ alignments of the CHM13-X, HG002-X, and HG002-Y (T2T-Y) over 96% sequence identity. Dashed gray lines represent the start and end of the approximate PARs or XTR boundaries. Disconnected diagonal lines indicate the presence of genomic diversity between each paired region. More genomic differences are observed in the PAR1 between the HG002-Y and CHM13-X. b-c. Average mapping quality (MAPQ) across GRCh38-X from simulated reads of an XX (b) and XY (c) sample. Top, a default version of GRCh38 (with two copies of identical PARs on XY). Middle, a version of GRCh38 informed on the sex chromosome complement (SCC) of the sample (entire Y hard-masked for the XX sample vs. only PARs on the Y hard-masked for the XY sample). Bottom, the difference in average MAPQ between the SCC and default approaches. MAPQ was averaged in 50 kb windows, sliding 10 kb across the chromosome. A positive value means MAPQ score is higher with SCC reference alignment compared to default alignment.
Extended Data Fig. 10 |
Extended Data Fig. 10 |. Number of variants called from 1KGP and SGDP individuals.
a. More variants are called on the X-PARs when using the sex chromosome complement reference approach (calling variants in diploid mode on PARs) than the non-masked approach (calling variants in haploid mode on PARs). The 1KGP results for GRCh38-Y are from Aganezov et al., which was performed on CHM13v1.0+GRCh38-Y. b. Num. of variants called from each 1KGP XY sample on chromosome GRCh38-Y and T2T-Y c. Num. of variants called in the syntenic region between the two Ys. A large num. of additional variants are called on each sample attributed to the newly added, non-syntenic sequences on T2T-Y. Within the syntenic regions, a reduction in the number of variants is observed for each population except for samples from R1 haplogroups as shown in Fig. 6c. d. Aggregated total number of variants for the 279 SGDP samples per chromosome. e. SGDP genome-wide counts of variants per-sample (n=279) demonstrate increased variation in African samples regardless of reference. Each bar in the box plot represents the 1st, 2nd (median), and 3rd quartile of the number of variants in each population. Whiskers are bound to the 1.5 × interquartile range. Data outside of the whisker ranges are shown as dots. For the SGDP samples, variants were called using T2T-CHM13+Y or GRCh38 as the reference. All variants shown in this figure were filtered for “high quality (PASS)”.
Extended Data Fig. 11 |
Extended Data Fig. 11 |. Human contaminants in bacterial reference genomes.
a. Number of distinct RefSeq accessions in every 10 kb window containing 64-mers of GRCh38-Y (top), T2T-Y (middle), and in T2T-Y only (bottom). Here, RefSeq sequences with more than 20 64-mers or matching over 10% of the Y chromosome are included. b. Length distribution of the sequences from (a) in log scale. Majority of the shorter (<1 kb) sequences contain 64-mers found in HSat1B or HSat3. c. Number of bacterial RefSeq entries by strain identified to contain sequences of T2T-Y and not GRCh38-Y, visualized with Krona.
Fig. 1 |
Fig. 1 |. The structure of a complete Y chromosome.
From top to bottom: Alignment of GRCh38-Y and T2T-Y. Regions with sequence identity over 95% are connected and colored by alignment direction (gray, forward; orange, reverse). Gene density plot shows enriched protein coding genes in ampliconic sequences. Sequence class, palindromes, inverted repeats (IR), and Azoospermia factor (AZF) a-c are annotated. Composite repeat arrays are named after the contained ampliconic genes. Segmental duplications (SDs) are colored by duplication types defined in DupMasker. Centromere and satellite annotations (Cen/Sat) highlight the alternating HSat1 and HSat3 pattern comprising Yq12. Non-B DNA track shows regions forming alternate sequence structures are enriched in centromeric and satellite repeats. Short-interspersed repeat elements (SINE), including AluY, are highly enriched in the pseudo autosomal region 1 (PAR1). All other non-SINE transposable elements (TEs) are only found in the euchromatin. All repeats within T2T-Y are visualized by StainedGlass with similar repeats colored by % identity in the style of an alignment dotplot.
Fig. 2 |
Fig. 2 |. Ampliconic genes forming composite repeats.
a. T2T-Y has 44 TSPY protein-coding genes organized in a single continuous array and a single TSPY2 copy, compared to GRCh38-Y which has a gap in the TSPY array. T2T-Y shows a more regularized array and recovers additional TSPY pseudogenes not present in GRCh38-Y. b. Copy number differences of the TSPY protein-coding copies found in the SGDP. c, Repeat composition of the RBMY gene family. d. Repeat composition of the DAZ gene family, with one extra copy annotated on Chr3 that is missing L1PA2. While TSPY and RBMY genes are found within repeat composites forming arrays, DAZ-associated composites are embedded within the introns of the gene.
Fig. 3 |
Fig. 3 |. The structure of the T2T-Y centromere.
No TEs were found within the DYZ3 array, while L1s (upstream) and Alus (downstream) were found within the diverged alpha satellites (drawn taller than the other Tes). A periodic non-B DNA motif pattern is shown within the HOR array. The HG002-Y (T2T-Y) HOR haplotypes and SVs reveal a different long-range structure and organization compared to a previously assembled centromere from RP11-Y. Three major HOR haplotypes were identified in HG002-Y based on their phylogenetic distance (red, blue, and green). RP11-Y has no 36-mer variants, but does have a number of 35-mers containing internal duplications. Histograms show the fraction of methylated CpG sites called by both ONT and HiFi, with two hypo-methylated centromeric dip regions (CDR) supported by CENP-A binding signal from CUT&RUN. A StainedGlass dotplot illustrates high similarity within the HOR array (99.5–100%).
Fig. 4 |
Fig. 4 |. Comparison of the palindromic structure of the P1–P3 region.
a. GRCh38-Y and T2T-Y alignment dotplot and schematics of the palindromes. Frequently recombining inverted repeats (IRs) in Azoospermia factor c (AZFc) region are highlighted in light blue. Deletion of AZFc between the IRs is known to cause spermatogenic failure. A self-dotplot of the T2T-Y with AZFb and AZFc annotation is available as Supplementary Fig. 15. b. Top, a schematic of the palindromes. Two inversions are found, one in P3 and one between P1-P2. Below, Strand-seq signal from HG002 confirms the inverted orientation of P3 and P1 in T2T-Y compared to GRCh38-Y.
Fig. 5 |
Fig. 5 |. Heterochromatic region of the distal Y q-arm (Yq12).
a. FISH painting of the Y chromosome, centromere/DYZ3 (magenta), HSat1B (blue), and HSat3 (yellow). Top-left, overall chromosome labeling by DNA dye (DAPI) with ChrY highlighted in an HG002-derived lymphoblastoid cell line (GM24385). The right panels show ChrY labeled with FISH probes recognizing centromeric alpha satellite/DYZ3 (magenta), HSat3/DYZ1 (yellow), and HSat1B/DYZ2 (blue). In concordance with the T2T-Y assembly, HSat3 probes indicate the presence at DYZ17 (close to centromere) as well as a slight enrichment to the proximal part of the Yq12 (DYZ1), while HSat1B is only present in the Yq12 and is more enriched towards the distal part (DYZ2). Maximum intensity projections are shown in all panels. The results of this experiment were replicated using two different sets of PCR probes. Fifteen large-field images containing at least 20 spreads were analyzed per condition. b. % identity of each DYZ2/DYZ1 repeat unit to its consensus sequence. c. % GC sequence composition of the HSat1B/DYZ2 and HSat3/DYZ1 repeat units and the position of an ancient AluY fragment in DYZ2. d. Phylogenetic tree of AluY sequences associated with HSat1B and HSat3, rooted on AluSc8. Tree represents subsampling of AluY elements, both full length (FL) and truncated, including AluY sequences found within HSat1B units and associated with HSat3 arrays. Elements located on ChrY are denoted with orange branches. The scale bar represents 0.2 substitutions per site on a branch of the same length.
Fig. 6 |
Fig. 6 |. Short-read mappability and variant calling improvements on T2T-Y.
In all plots, GRCh38-Y is colored orange and T2T-Y is maroon. The complete sequence of T2T-Y improves short-read alignment of the 1KGP dataset by a. increased number of reads mapped, b. higher portion of reads properly paired, and c. lower mismatch rate compared to GRCh38-Y. Bar in the box plot represents the 1st, 2nd (median), and 3rd quartile of the data. Whiskers are bound to the 1.5 × interquartile range. Data outside of the whisker ranges are shown as dots. d. The number of called variants within syntenic regions is reduced on T2T-Y for all haplogroups except R1 (haplogroup of GRCh38-Y). e. Further investigation on 3 samples (J1, R1b, and E1b) shows a higher number of variants called with excessive read depth and variable alternate allele fractions for GRCh38-Y. Each dot represents a variant, with the % alternate alleles as a function of total read depth. Dotted line represents the median coverage on T2T-Y, close to the expected 1-copy coverage. f. Dotplot of the DYZ19 array between GRCh38-Y and T2T-Y and self-dotplot of T2T-Y. Large rearrangements are observed, with multiple inversions proximal to the gap in GRCh38-Y with respect to T2T-Y (top), while more identical, tandem duplications are visible in T2T-Y (bottom). g. Read pile-ups and variants on DYZ19 for GRCh38-Y (left) and T2T-Y (right) as shown with IGV. Gray histogram shows the mapped read coverage, with colored lines indicating non-reference bases with >60% allele frequency. Regardless of the haplogroup, the incomplete DYZ19 array in GRCh38-Y hinders interpretation. Syntenic regions between the two Ys are marked, and SNV sites used to identify Y haplogroup lineages in Y-Finder are shown below, with variants liftable from GRCh38-Y to T2T-Y in black, not-liftable in red, respectively.

Similar articles

  • A complete reference genome improves analysis of human genetic variation.
    Aganezov S, Yan SM, Soto DC, Kirsche M, Zarate S, Avdeyev P, Taylor DJ, Shafin K, Shumate A, Xiao C, Wagner J, McDaniel J, Olson ND, Sauria MEG, Vollger MR, Rhie A, Meredith M, Martin S, Lee J, Koren S, Rosenfeld JA, Paten B, Layer R, Chin CS, Sedlazeck FJ, Hansen NF, Miller DE, Phillippy AM, Miga KH, McCoy RC, Dennis MY, Zook JM, Schatz MC. Aganezov S, et al. Science. 2022 Apr;376(6588):eabl3533. doi: 10.1126/science.abl3533. Epub 2022 Apr 1. Science. 2022. PMID: 35357935 Free PMC article.
  • The complete sequence of a human genome.
    Nurk S, Koren S, Rhie A, Rautiainen M, Bzikadze AV, Mikheenko A, Vollger MR, Altemose N, Uralsky L, Gershman A, Aganezov S, Hoyt SJ, Diekhans M, Logsdon GA, Alonge M, Antonarakis SE, Borchers M, Bouffard GG, Brooks SY, Caldas GV, Chen NC, Cheng H, Chin CS, Chow W, de Lima LG, Dishuck PC, Durbin R, Dvorkina T, Fiddes IT, Formenti G, Fulton RS, Fungtammasan A, Garrison E, Grady PGS, Graves-Lindsay TA, Hall IM, Hansen NF, Hartley GA, Haukness M, Howe K, Hunkapiller MW, Jain C, Jain M, Jarvis ED, Kerpedjiev P, Kirsche M, Kolmogorov M, Korlach J, Kremitzki M, Li H, Maduro VV, Marschall T, McCartney AM, McDaniel J, Miller DE, Mullikin JC, Myers EW, Olson ND, Paten B, Peluso P, Pevzner PA, Porubsky D, Potapova T, Rogaev EI, Rosenfeld JA, Salzberg SL, Schneider VA, Sedlazeck FJ, Shafin K, Shew CJ, Shumate A, Sims Y, Smit AFA, Soto DC, Sović I, Storer JM, Streets A, Sullivan BA, Thibaud-Nissen F, Torrance J, Wagner J, Walenz BP, Wenger A, Wood JMD, Xiao C, Yan SM, Young AC, Zarate S, Surti U, McCoy RC, Dennis MY, Alexandrov IA, Gerton JL, O'Neill RJ, Timp W, Zook JM, Schatz MC, Eichler EE, Miga KH, Phillippy AM. Nurk S, et al. Science. 2022 Apr;376(6588):44-53. doi: 10.1126/science.abj6987. Epub 2022 Mar 31. Science. 2022. PMID: 35357919 Free PMC article.
  • Genomic characterization of large heterochromatic gaps in the human genome assembly.
    Altemose N, Miga KH, Maggioni M, Willard HF. Altemose N, et al. PLoS Comput Biol. 2014 May 15;10(5):e1003628. doi: 10.1371/journal.pcbi.1003628. eCollection 2014 May. PLoS Comput Biol. 2014. PMID: 24831296 Free PMC article.
  • Dark Matter of Primate Genomes: Satellite DNA Repeats and Their Evolutionary Dynamics.
    Ahmad SF, Singchat W, Jehangir M, Suntronpong A, Panthum T, Malaivijitnond S, Srikulnath K. Ahmad SF, et al. Cells. 2020 Dec 18;9(12):2714. doi: 10.3390/cells9122714. Cells. 2020. PMID: 33352976 Free PMC article. Review.
  • Centromere studies in the era of 'telomere-to-telomere' genomics.
    Miga KH. Miga KH. Exp Cell Res. 2020 Sep 15;394(2):112127. doi: 10.1016/j.yexcr.2020.112127. Epub 2020 Jun 3. Exp Cell Res. 2020. PMID: 32504677 Free PMC article. Review.

Cited by

References

    1. Skaletsky H et al. The male-specific region of the human Y chromosome is a mosaic of discrete sequence classes. Nature 423, 825–837 (2003). - PubMed
    1. Miga KH et al. Centromere reference models for human chromosomes X and Y satellite arrays. Genome Res. 24, 697–707 (2014). - PMC - PubMed
    1. Vollger MR et al. Segmental duplications and their variation in a complete human genome. Science 376, eabj6965 (2022). - PMC - PubMed
    1. Nurk S et al. The complete sequence of a human genome. Science 376, 44–53 (2022). - PMC - PubMed
    1. Schneider VA et al. Evaluation of GRCh38 and de novo haploid genome assemblies demonstrates the enduring quality of the reference assembly. Genome Res. 27, 849–864 (2017). - PMC - PubMed

Grants and funding