

Cellular characterisation of advanced osteoarthritis knee synovium
- PMID: 37612718
- PMCID: PMC10463598
- DOI: 10.1186/s13075-023-03110-x
Cellular characterisation of advanced osteoarthritis knee synovium
Abstract
Objectives: Osteoarthritis (OA) is increasingly recognised as a whole joint disease, with an important role for synovium. However, the repertoire of immune cells and fibroblasts that constitute OA synovium remains understudied. This study aims to characterise the cellular composition of advanced OA synovium and to explore potential correlations between different cell types and patient demographics or clinical scores.
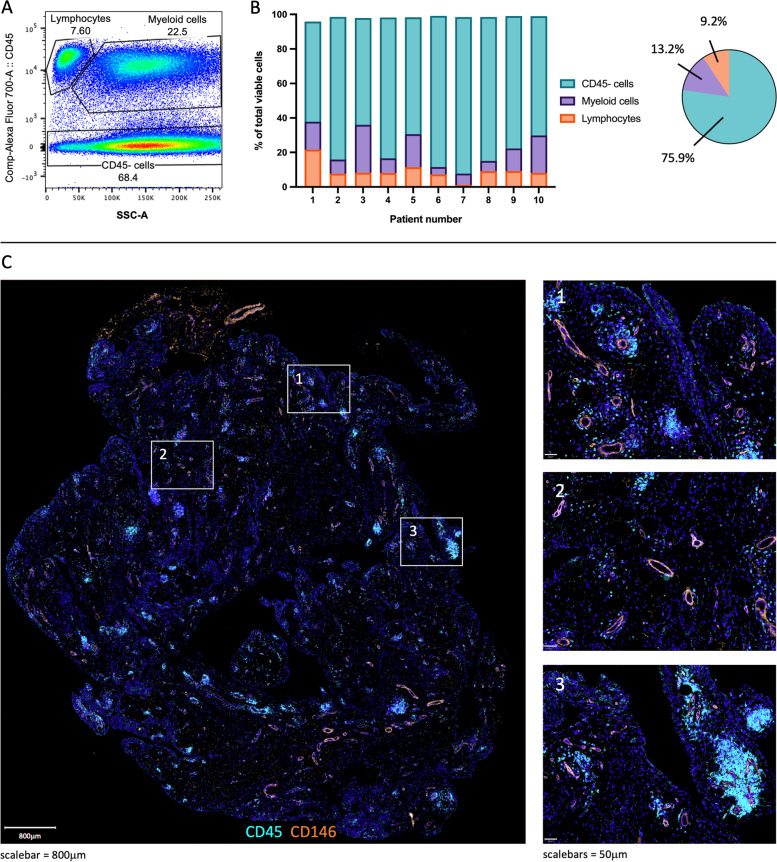
Methods: Synovium, collected from 10 patients with advanced OA during total knee replacement surgery, was collagenase-digested, and cells were stained for flow cytometry analysis. Formalin-fixed paraffin-embedded synovium was sectioned, stained with immunofluorescence, and imaged using the multiplex Cell DIVE platform. Patient demographics and clinical scores were also collected.
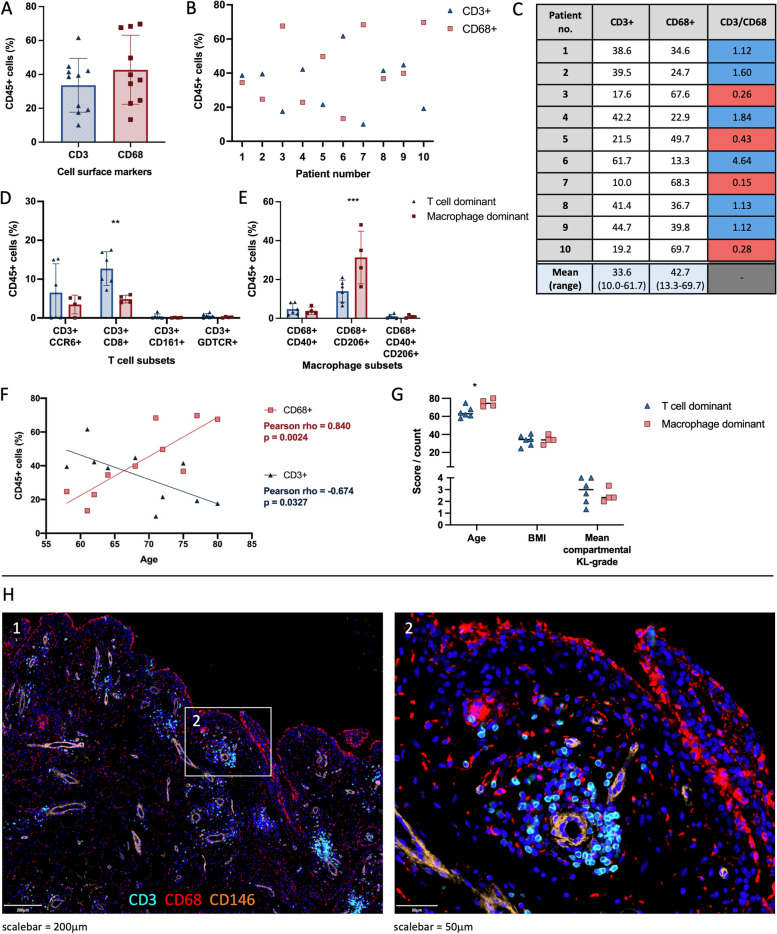
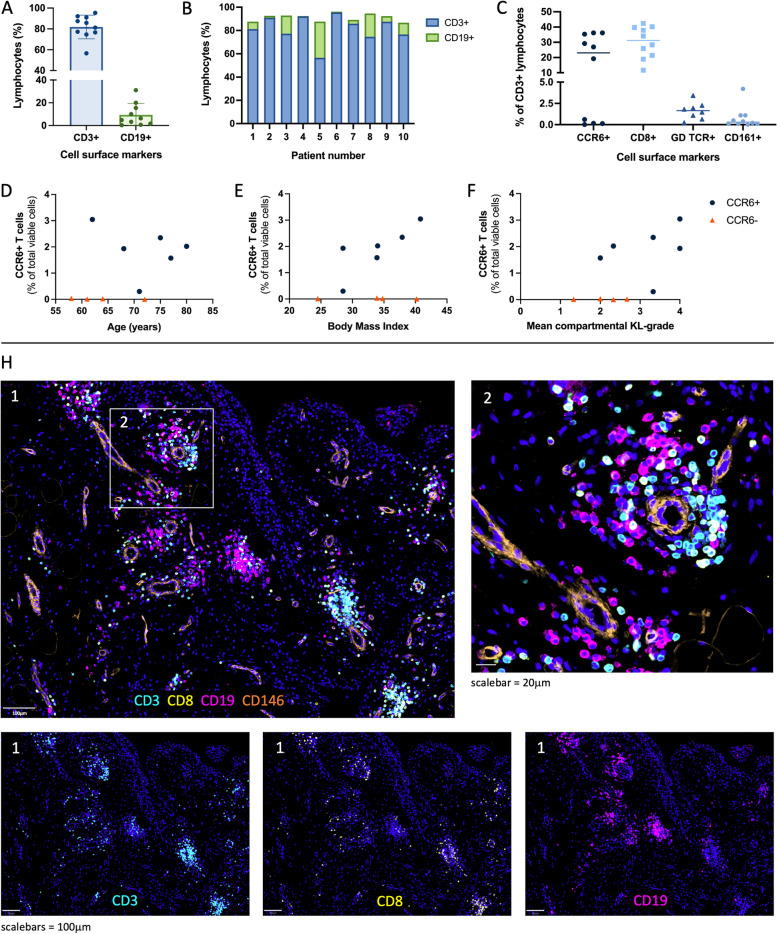
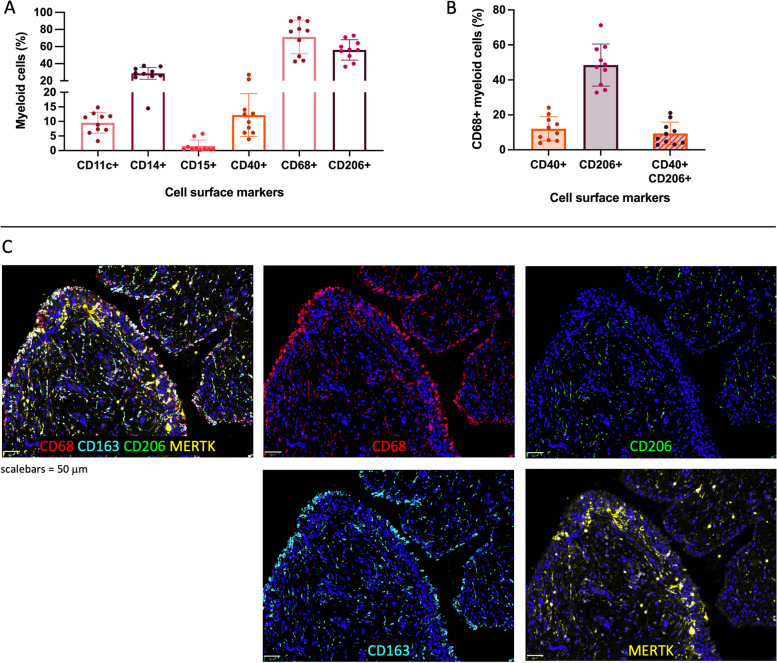
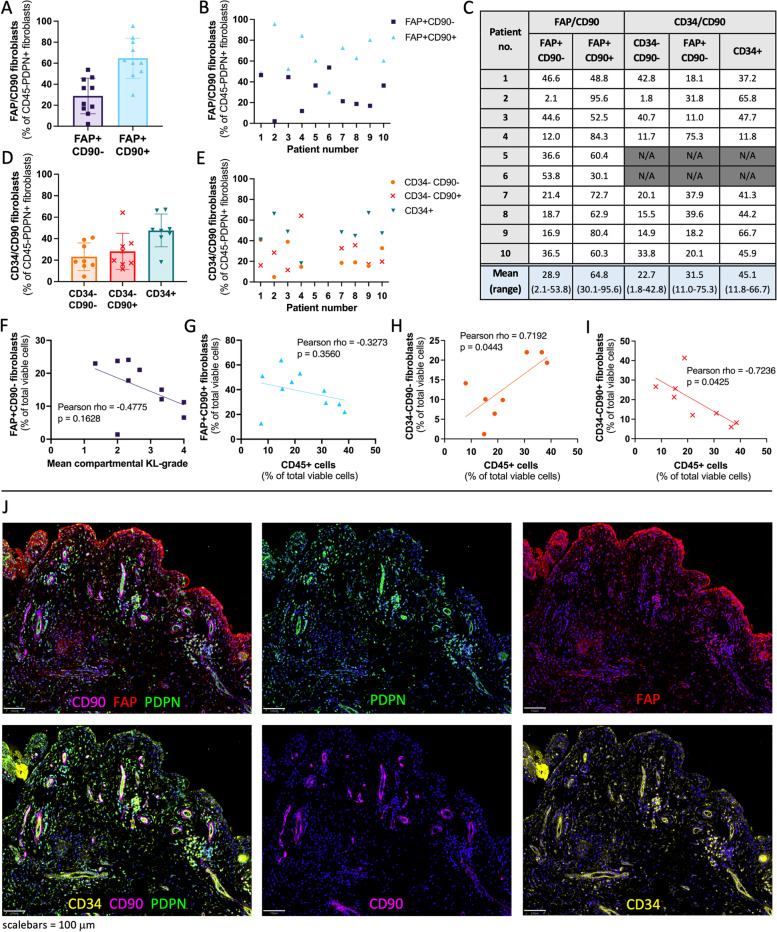
Results: The proportion of immune cells in OA synovium varied between patients (8-38% of all cells). Macrophages and T cells were the dominant immune cell populations, together representing 76% of immune cells. Age positively correlated with the proportion of macrophages, and negatively correlated with T cells. CCR6+ T cells were found in 6/10 patients; these patients had a higher mean Kellgren-Lawrence grade across the three knee compartments. Immunofluorescence staining showed that macrophages were present in the lining as well as distributed throughout the sublining, while T and B cells were mainly localised near vessels in the sublining. Fibroblast subsets (CD45-PDPN+) based on the expression of CD34/CD90 or FAP/CD90 were identified in all patient samples, and some populations correlate with the percentage of immune cells or clinical scores. Immunofluorescence staining showed that FAP expression was particularly strong in the lining layer, but also present throughout the sublining layer. CD90 expression was exclusively found around vessels in the sublining, while CD34 was mostly found in the sublining but also occasionally in the lining layer.
Conclusions: There are significant differences in the relative proportions and subsets of immune cells in OA synovium; exploratory correlative analyses suggest that these differences might be correlated with age, clinical scores, or fibroblast subsets. Additional studies are required to understand how different cell types affect OA pathobiology, and if the presence or proportion of cell subsets relates to disease phenotypes.
Keywords: B cells; CCR6; Fibroblasts; Flow cytometry; Immunofluorescence; Macrophages; Osteoarthritis; Synovium; T cells.
© 2023. BioMed Central Ltd., part of Springer Nature.
Conflict of interest statement
Christopher D. Buckley and Mark C. Coles are co-founders, shareholders, and scientific advisory board members of Mestag Therapeutics, and Mark Coles is a co-founder, shareholder, and director at Lightox Therapeutics.
Figures
Similar articles
-
Multiparameter Analysis Identifies Heterogeneity in Knee Osteoarthritis Synovial Responses.Arthritis Rheumatol. 2020 Apr;72(4):598-608. doi: 10.1002/art.41161. Epub 2020 Mar 12. Arthritis Rheumatol. 2020. PMID: 31702112 Free PMC article.
-
Inhomogeneity of immune cell composition in the synovial sublining: linear mixed modelling indicates differences in distribution and spatial decline of CD68+ macrophages in osteoarthritis and rheumatoid arthritis.Arthritis Res Ther. 2016 Jul 16;18:170. doi: 10.1186/s13075-016-1057-3. Arthritis Res Ther. 2016. PMID: 27424032 Free PMC article.
-
Obesity defined molecular endotypes in the synovium of patients with osteoarthritis provides a rationale for therapeutic targeting of fibroblast subsets.Clin Transl Med. 2023 Apr;13(4):e1232. doi: 10.1002/ctm2.1232. Clin Transl Med. 2023. PMID: 37006170 Free PMC article.
-
When are patients with osteoarthritis referred for surgery?Best Pract Res Clin Rheumatol. 2023 Jun;37(2):101835. doi: 10.1016/j.berh.2023.101835. Epub 2023 May 30. Best Pract Res Clin Rheumatol. 2023. PMID: 37263807 Review.
-
Patterns of Compartment Involvement in End-stage Knee Osteoarthritis in a Chinese Orthopedic Center: Implications for Implant Choice.Orthop Surg. 2018 Aug;10(3):227-234. doi: 10.1111/os.12395. Orthop Surg. 2018. PMID: 30152607 Free PMC article. Review.
Cited by
-
Increased synovitis and pro-inflammatory macrophage abundance are observed in the synovia of patients at risk of developing post-traumatic OA compared to those with established OA.Osteoarthr Cartil Open. 2025 Jul 18;7(3):100643. doi: 10.1016/j.ocarto.2025.100643. eCollection 2025 Sep. Osteoarthr Cartil Open. 2025. PMID: 40740990 Free PMC article.
-
Cartilage responses to inflammatory stimuli and adipose stem/stromal cell-derived conditioned medium: Results from an ex vivo model.Regen Ther. 2024 Jun 28;26:346-353. doi: 10.1016/j.reth.2024.06.010. eCollection 2024 Jun. Regen Ther. 2024. PMID: 39036443 Free PMC article.
-
Fibroblast activation protein: Pivoting cancer/chemotherapeutic insight towards heart failure.Biochem Pharmacol. 2024 Jan;219:115914. doi: 10.1016/j.bcp.2023.115914. Epub 2023 Nov 11. Biochem Pharmacol. 2024. PMID: 37956895 Free PMC article. Review.
-
B Cell Activation, Differentiation, and Their Potential Molecular Mechanisms in Osteoarthritic Synovial Tissue.J Inflamm Res. 2025 Feb 11;18:2137-2151. doi: 10.2147/JIR.S503597. eCollection 2025. J Inflamm Res. 2025. PMID: 39959649 Free PMC article.
-
Targeting FAP-positive chondrocytes in osteoarthritis: a novel lipid nanoparticle siRNA approach to mitigate cartilage degeneration.J Nanobiotechnology. 2024 Oct 26;22(1):659. doi: 10.1186/s12951-024-02946-y. J Nanobiotechnology. 2024. PMID: 39456041 Free PMC article.
References
-
- Sellam J, Berenbaum F. The role of synovitis in pathophysiology and clinical symptoms of osteoarthritis. Nat Rev Rheumatol. 2010;6:625–635. - PubMed
Publication types
MeSH terms
Substances
Grants and funding
LinkOut - more resources
Full Text Sources
Medical
Research Materials
Miscellaneous
