. 2023 Aug 24;15(1):133.
doi: 10.1186/s13148-023-01546-1.

CRISPR/dCAS9-mediated DNA demethylation screen identifies functional epigenetic determinants of colorectal cancer

Affiliations

CRISPR/dCAS9-mediated DNA demethylation screen identifies functional epigenetic determinants of colorectal cancer

Juan Ramón Tejedor et al. Clin Epigenetics. .

Abstract

Background: Promoter hypermethylation of tumour suppressor genes is frequently observed during the malignant transformation of colorectal cancer (CRC). However, whether this epigenetic mechanism is functional in cancer or is a mere consequence of the carcinogenic process remains to be elucidated.

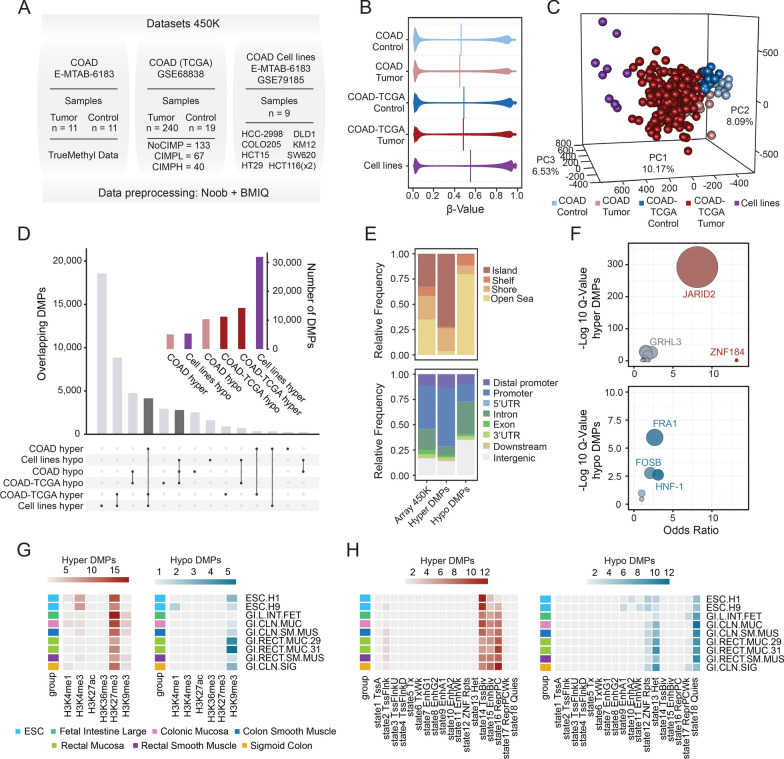
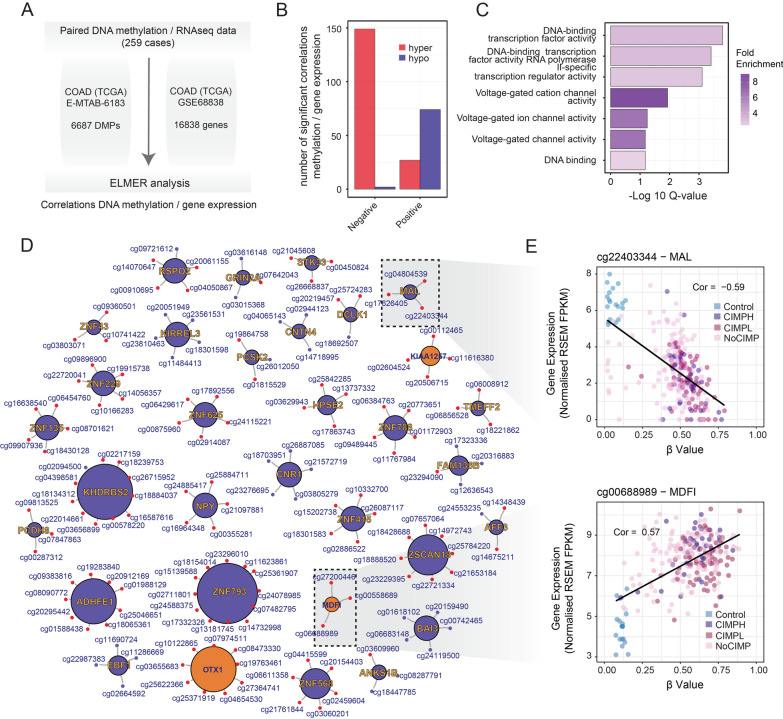
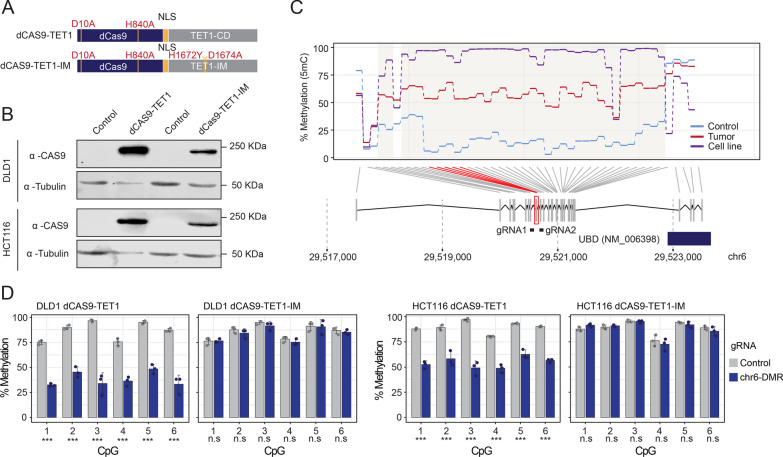
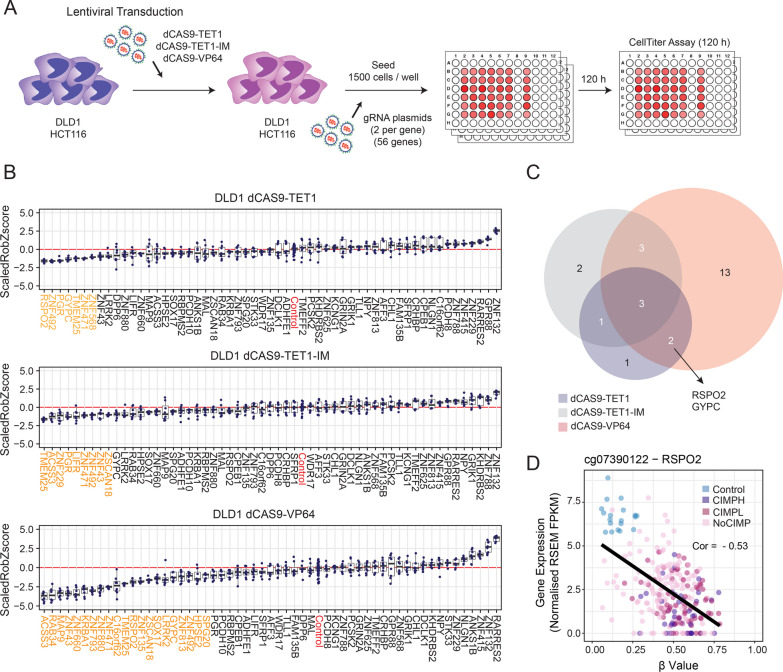
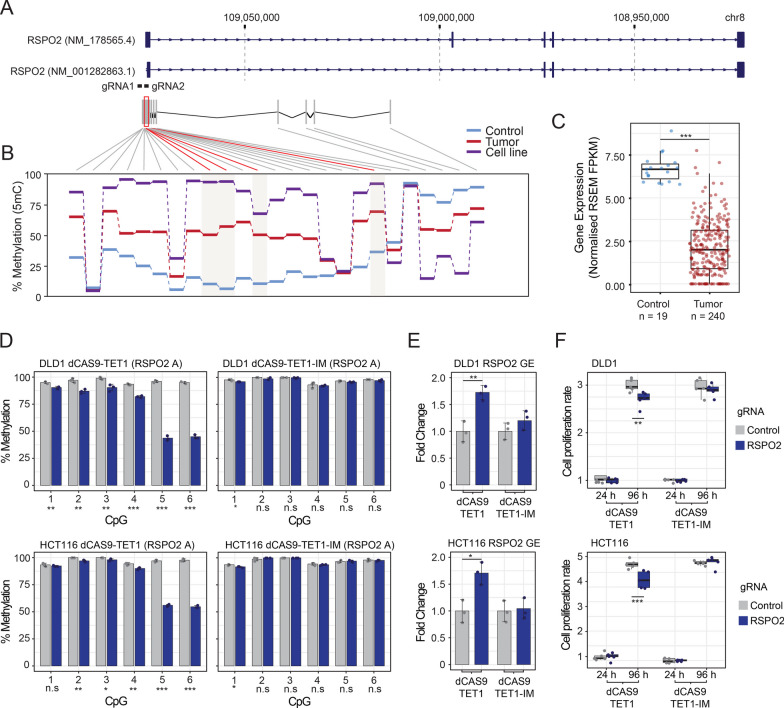
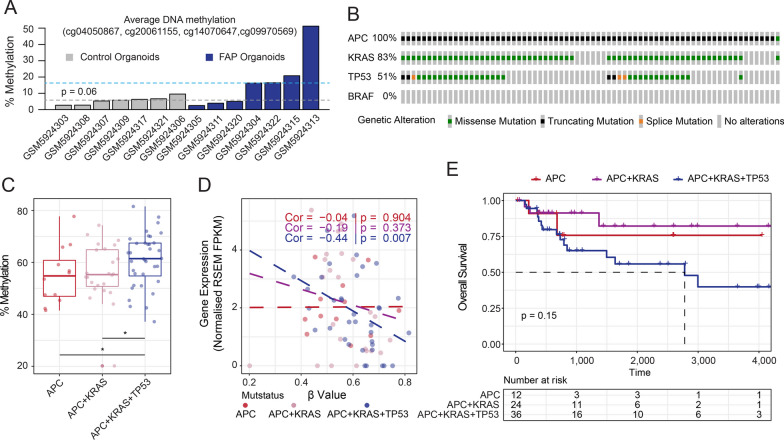
Results: In this work, we performed an integrative multi-omic approach to identify gene candidates with strong correlations between DNA methylation and gene expression in human CRC samples and a set of 8 colon cancer cell lines. As a proof of concept, we combined recent CRISPR-Cas9 epigenome editing tools (dCas9-TET1, dCas9-TET-IM) with a customized arrayed gRNA library to modulate the DNA methylation status of 56 promoters previously linked with strong epigenetic repression in CRC, and we monitored the potential functional consequences of this DNA methylation loss by means of a high-content cell proliferation screen. Overall, the epigenetic modulation of most of these DNA methylated regions had a mild impact on the reactivation of gene expression and on the viability of cancer cells. Interestingly, we found that epigenetic reactivation of RSPO2 in the tumour context was associated with a significant impairment in cell proliferation in p53-/- cancer cell lines, and further validation with human samples demonstrated that the epigenetic silencing of RSPO2 is a mid-late event in the adenoma to carcinoma sequence.

Conclusions: These results highlight the potential role of DNA methylation as a driver mechanism of CRC and paves the way for the identification of novel therapeutic windows based on the epigenetic reactivation of certain tumour suppressor genes.

Keywords: CRISPR screen; Colorectal cancer; DNA methylation; Epigenetics; Gene expression; Tumour suppressor gene.


Conflict of interest statement

The authors declare that they have no competing interests.

Figures

Fig. 1
Fig. 1
The DNA methylation landscape of CRC samples and cell lines. A Table indicating the datasets used in this study for the identification of CRC specific DMPs. B Violin plots depicting the overall 5mC estimates from the 450 K platform in control and CRC samples. Vertical lines indicate the median value for each of the above-mentioned distributions. C Principal component analysis for 413,756 CpG sites across all samples included in the DNA methylation study. Samples are coloured according to their clinical status (control/tumour) in their corresponding dataset. D Barplot indicating the number of common (dark-grey) and specific significantly hyper- or hypomethylated CpG sites as compared with healthy controls observed in the comparisons indicated (FDR < 0.05, mean β difference > 0.25). The inset illustrates the total number of hyper- and hypomethylated CpG sites observed in each separate condition. E Stacked barplots displaying the relative frequency of significant common hyper- or hypomethylated CpGs in relation to their CpG context (top) or CpG location (bottom). The background distribution of the 450 K platform is included for interpretation purposes. F Bubble plots showing enrichment of TFBS in the context of common hyper- (top) or hypomethylated (bottom) CpG sites as determined by the information obtained from the GTRD database. Dot size denotes statistical significance (−log10 adjusted p value) of a particular TFBS dataset as compared with the background distribution of the 450 K platform. G Heatmaps illustrating histone mark enrichment analyses of common hyper- and hypomethylated CpGs. Colour scales represent the odds ratio obtained across 6 common histone modifications from the NIH Roadmap Epigenome consortium as compared with the background distribution of the 450 K platform. The legend indicates the tissue types used for these comparisons. H Same as G, but displaying chromatin state enrichment analyses across 18 chromatin states obtained from the NIH Roadmap Epigenome consortium
Fig. 2
Fig. 2
Inferring functional epigenetic alterations through integration of DNA methylation and gene expression data. A Schema depicting the integration of DNA methylation and RNA-Seq data using the ELMER algorithm. Values indicate the number of significant common hyper- or hypomethylated CpGs used in the context of the 450 K arrays and the number of genes expressed in the TCGA-COAD RNA-seq dataset. B Barplot illustrating the number of significant gene expression–correlating hyper- or hypomethylated CpGs associated with promoter regions with an absolute Pearson’s correlation > 0.5. C Barplot displaying gene ontology enrichment analyses of the significant gene expression–correlating hyper- or hypomethylated CpGs. Genes with a consistent correlation with DNA methylation were used for enrichment calculation versus the background dataset (16,838). Colour range denotes the odds ratio of the represented ontology, while bar size represents the significance of these enrichments (−Log10 adj. p value) as calculated with the GORILLA tool. D Graph illustrating the gene-CpG promoter network associated with significant gene expression–correlating hyper- (red) or hypomethylated (blue) CpGs in CRC samples. Genes that are down- or upregulated in CRC samples cells as compared to healthy controls are shown in blue or orange, respectively. E Scatter plots displaying the correlations between DNA methylation and gene expression for the genes MAL (top) and MDFI (bottom). Control and CRC samples are coloured according to their CIMP status, and the resulting significant correlation (p value < 0.001) is indicated for each gene comparison
Fig. 3
Fig. 3
dCas9-TET1 induces locus-dependent DNA demethylation in DLD1 and HCT116 cells. A Schema illustrating the structure of the chimeric CRISPR-dCas9 construct fused to the catalytic domain (TET1, top) or the catalytically inactive domain (TET1-IM, bottom) of TET1. The position of the nuclear localization signal (NLS) and the mutations of the dCas9 or the TET1 catalytic domain are indicated. B Expression levels of chimeric dCas9-TET1, dCas9-TET1-IM and β-Tubulin proteins obtained by western blot analyses in control transduced or Cas9 transduced DLD1 and HCT116 cells. The approximate size of the protein products is indicated. C Line plot illustrating overall 5mC levels observed for a robust cancer-associated differentially hypermethylated region in control and tumour samples and in CRC cell lines. Data represent the average methylation status of the indicated CpG sites for the aforementioned categories. Significantly hypermethylated CpG sites observed in the differential methylation comparisons are highlighted in red. The genomic position of the gRNAs designed to modulate the DNA methylation status of this region is indicated. D Barplots representing the percentage of DNA methylation observed for the CpG sites included in the modulated differentially methylated region in DLD1 and HCT116 cells in the context of control gRNA (grey) or gRNAs targeting this DMR (blue) in cells transduced with dCas9-TET1- or dCas9-TET1-IM-related chimeras. Data represent mean ± standard deviation of at least 3 independent experiments, and two-sided Welch’s t tests were applied for the different statistical comparisons versus each corresponding control condition. ***p value < 0.001; n.s.—nonsignificant
Fig. 4
Fig. 4
CRISPR-dCas9 demethylation screen identifies functional epigenetic drivers in DLD1 cells. A Schema depicting the experimental CRISPR-dCas9 mediated pipeline adopted in the screen strategy. A total of 56 gene promoters were targeted with 2 gRNAs each against genomic regions with significant DNA hypermethylation levels in tumour cells. The screen was performed in parallel using DLD1 cells transduced with the chimeric constructs dCas9-TET1, dCas9-TET1-IM or the transcriptional activator dCas9-VP64. B Boxplots displaying the Scaled Robust Z-score data observed for the indicated gene promoters in the context of DLD1 cells transduced with dCas9-TET1 (top), dCas9-TET1-IM (middle) or dCas9-VP64 (bottom) constructs. Those epigenetic modulations that resulted in statistically significant changes in the proliferation rate of DLD1 cells are highlighted in orange, while conditions corresponding to control gRNAs are highlighted in red. C Venn diagrams illustrating the overlap of significant hits obtained in the different screen strategies. D Scatter plots showing the correlation between DNA methylation and gene expression levels for the gene RSPO2
Fig. 5
Fig. 5
Epigenetic modulation of RSPO2 impairs the proliferation rate of CRC cell lines. A Schema reflecting the genomic position of the RSPO2 gene, the CpG sites analysed in the 450 K methylation platform and the gRNAs designed to modulate the DNA methylation status of its promoter region. B Line plot illustrating the average methylation status of the CpG sites for the indicated categories. Significantly hypermethylated CpG sites observed in the differential methylation comparisons are highlighted in red. C Boxplot showing the gene expression levels of the RSPO2 gene in control or tumour cases obtained from the TCGA-COAD dataset. D Barplots depicting the percentage of DNA methylation observed for the CpG sites included in the RSPO2 promoter region in DLD1 (top) and HCT116 (bottom) cells in the context of control gRNA (grey) or gRNAs targeting this modulated region in cells transduced with dCas9-TET1 (left)- or dCas9-TET1-IM (right)-related chimeras. E Barplots indicating RSPO2 gene expression levels observed upon epigenetic modulation of its promoter region in DLD1 (top) and HCT116 (bottom) cells in the context of dCas9-TET1- or dCas9-TET1-IM-related chimeras, both in control and RSPO2 targeting RNA conditions. F Boxplots displaying the normalized cell proliferation rate observed for the indicated gRNA treatments at two different time points (24 and 96 h) in the context of DLD1 and HCT116 cells transduced with dCas9-TET1 and dCas9-TET1-IM constructs. For D and E, data represent mean ± standard deviation of at least 3 independent experiments, while for F, at least 8 experimental replicas were included. Two-sided Welch’s t-tests were applied for the different statistical comparisons versus each corresponding control condition. ***p value < 0.001; **p value < 0.01; *p value < 0.05; n.s.—nonsignificant
Fig. 6
Fig. 6
RSPO2 DNA methylation and gene expression levels are anti-correlated along the adenoma to carcinoma sequence. A Barplot depicting the DNA methylation status of colon organoids obtained from FAP or control patients. Data represent the average methylation value of the four CpG sites identified as differentially methylated in our study. Dashed lines indicate the median DNA methylation value of FAP or control organoids and statistical significance between these groups was calculated by means of a one-sided Welch’s t-test. B Oncoprint representation of the TCGA-COAD samples with mutations in the APC, KRAS and TP53 genes included in these analyses. C Boxplots illustrating the DNA methylation score of the indicated samples along the adenoma to carcinoma sequence in the context of a single (APC), double (APC + KRAS) or triple mutant group (APC + KRAS + TP53). Statistical significance was inferred using a one-sided Wilcoxon rank sum exact test (*p value < 0.05). D Scatter plots showing the correlation between DNA methylation and gene expression levels for the gene RSPO2 in the context of the above-mentioned categories. Resulting Spearman correlations and p values are indicated in the figure legend. E Kaplan–Meier plot showing the overall survival estimates of the single, double- and triple-mutant categories. p value refers to differences in event rates between the Kaplan–Meier curves and was calculated with the log-rank test function

References

    1. Lao VV, Grady WM. Epigenetics and colorectal cancer. Nat Rev Gastroenterol Hepatol. 2011;8:686–700. - PMC - PubMed
    1. Esteller M. Aberrant DNA methylation as a cancer-inducing mechanism. Annu Rev Pharmacol Toxicol. 2005;45:629–656. - PubMed
    1. Feinberg AP, Tycko B. The history of cancer epigenetics. Nat Rev Cancer. 2004;4:143–153. - PubMed
    1. Herman JG, Baylin SB. Gene silencing in cancer in association with promoter hypermethylation. N Engl J Med. 2003;349:2042–2054. - PubMed
    1. De Carvalho DD, Sharma S, You JS, Su S-F, Taberlay PC, Kelly TK, et al. DNA methylation screening identifies driver epigenetic events of cancer cell survival. Cancer Cell. 2012;21:655–667. - PMC - PubMed

Publication types