. 2023 Oct;22(10):e13954.
doi: 10.1111/acel.13954. Epub 2023 Aug 23.

Alterations of lipid-mediated mitophagy result in aging-dependent sensorimotor defects

Affiliations

Alterations of lipid-mediated mitophagy result in aging-dependent sensorimotor defects

Natalia Oleinik et al. Aging Cell. 2023 Oct.

Abstract

The metabolic consequences of mitophagy alterations due to age-related stress in healthy aging brains versus neurodegeneration remain unknown. Here, we demonstrate that ceramide synthase 1 (CerS1) is transported to the outer mitochondrial membrane by the p17/PERMIT transporter that recognizes mislocalized mitochondrial ribosomes (mitoribosomes) via 39-FLRN-42 residues, inducing ceramide-mediated mitophagy. P17/PERMIT-CerS1-mediated mitophagy attenuated the argininosuccinate/fumarate/malate axis and induced d-glucose and fructose accumulation in neurons in culture and brain tissues (primarily in the cerebellum) of wild-type mice in vivo. These metabolic changes in response to sodium-selenite were nullified in the cerebellum of CerS1to/to (catalytically inactive for C18-ceramide production CerS1 mutant), PARKIN-/- or p17/PERMIT-/- mice that have dysfunctional mitophagy. Whereas sodium selenite induced mitophagy in the cerebellum and improved motor-neuron deficits in aged wild-type mice, exogenous fumarate or malate prevented mitophagy. Attenuating ceramide-mediated mitophagy enhanced damaged mitochondria accumulation and age-dependent sensorimotor abnormalities in p17/PERMIT-/- mice. Reinstituting mitophagy using a ceramide analog drug with selenium conjugate, LCL768, restored mitophagy and reduced malate/fumarate metabolism, improving sensorimotor deficits in old p17/PERMIT-/- mice. Thus, these data describe the metabolic consequences of alterations to p17/PERMIT/ceramide-mediated mitophagy associated with the loss of mitochondrial quality control in neurons and provide therapeutic options to overcome age-dependent sensorimotor deficits and related disorders like amyotrophic lateral sclerosis (ALS).

Keywords: CerS1; Drp1; aging; ceramide; mitochondrial metabolism; mitophagy; neurodegeneration; sensorimotor defects.


Conflict of interest statement

The authors declare no competing interests.

Figures
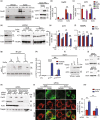
FIGURE 1
FIGURE 1
Mitochondrial membrane rearrangements are critical in recruiting p17/PERMIT‐CerS1 to mitochondria. (a) CerS1, and ICT1 in the whole lysate (WL) and mitochondrial fractions in vehicle (left) or SoSe (right) treated UM‐SCC‐1A cells. (b and c) Quantification of (a). Data are means ± SD (n = 3 independent experiments, **p < 0.01; ***p < 0.001). Normalization was done using corresponding protein levels. (d) Drp1 in cells treated with SCR control and Drp1 shRNA (left). Levels of ICT1 (top) and NUBPL (bottom) proteins in mitochondria isolated from SCR control and shDrp1 UM‐SCC‐1A cells treated with vehicle (−) or SoSe (+), 10 µM 3 h (right panel). (e and f) Quantification of (d). Data are means ± SD (n = 3 independent experiments, nsp > 0.5; **p < 0.01). (g) Representative Western Blot of Co‐IP analysis of ICT1 and p17 interaction in UM‐SCC‐1A cells with silenced endogenous p17 ectopically expressing empty vector (EV), wild type of p17 (WT) and p17RYE/AAA. (h) Quantification of p17/ICT1 interaction in cells from (g). Data are means ± SD (n = 3 independent experiments, ***p < 0.001). (i) Levels of p17WT and P17RYE/AAA mutant transiently expressed in p17 shRNA UM‐SCC‐1A cells. (j) ICT1 in UM‐SCC‐1A cells stably transfected with scrambled (Scr) or ICT1 shRNAs. (k) CerS1 and ICT1 in the whole lysates and mitochondrial fractions of Scr control and siICT1 RNA treated cells. (l) Confocal images of cells treated for 3 h with 10 μM of SoSe and stained for CerS1 (green) and MTR (red), mitochondrial marker. Yellow shows co‐localization. (m) Quantification of (l). Rc, the co‐localization coefficient was determined using Fiji J software. Images represent at least three independent experiments. Data are means ± SD (n = 3 independent experiments, **p < 0.01).
FIGURE 2
FIGURE 2
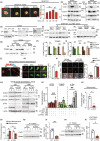
Silencing or genetic loss of p17/PERMIT inhibits SoSe‐induced mitophagy. (a) (Left) Live cell‐confocal imaging (overlay) of SHSY‐5Y‐differentiated neuronal cells treated with SoSe (10 µM) and stained with Mitotracker Red and Lysotracker Green. Right, Quantification of the left. Data are means ± SD (n = 3 independent experiments, **p < 0.01). (b) Markers of SoSe‐induced mitophagy shown in mitochondria (M) and whole lysate (WL) of scrambled control and p17 knocked down SHSY‐5Y cells treated for 3 h with vehicle (−) or 10 µM of SoSe (+). COXIV and Actin were used as loading controls. (c) Levels of PINK1 (top panel) and PARKIN (PRKN) (lower panel) in mitochondrial (M) and non‐mitochondrial (NM) fractions of scrambled control and p17 knocked down SHSY‐5Y cells treated for 3 h with vehicle (−) or 10 µM of SoSe (+). (d) Levels of p17 (left), Drp1 (middle) and CerS1 (right) in scrambled control and p17 (left), Drp1 (middle) and CerS1 (right) knocked down SHSY‐5Y neurons. (e) Levels of ACO2 in cells treated with Vehicle (−) or LCL768 (+). Actin demonstrates equal protein loading. (f) Levels of Drp1‐Cys nitrosylation in cells from (e), measured by co‐IP using an antibody for Drp1 and probed against Cys‐NO. (g) Topological analysis of the mitochondrial proteins using PK digestion. TOM40 (top) and ICT1 (bottom) proteins in mitochondria isolated from SCR control and Shp17 SHSY‐5Y cells treated with vehicle or SoSe. (h and i) Quantification of (g). The proteins extracted from PK‐treated samples were normalized by the corresponding levels of untreated cells. Data are means ± SD (n = 3 independent experiments, **p < 0.01). (j) Confocal images of primary neurons isolated from the hippocampus of 12 months old WT and p17KO animals stained against MAP‐4 (neuronal marker, red) and DAPI (blue). (k) Detection of mitochondrial membrane potential by staining live primary hippocampal neurons with TMRE (red) and mitotracker (MTG, green). Yellow indicates healthy mitochondria with high mitochondrial membrane potential (left). Right, quantification of the left panel. (l) (left panel), Confocal images of live primary neurons from (j), treated with Vehicle or LCL768 stained with “Mtphagy Dye” (blue) and mitotracker (MTR, red). Magenta indicates mitochondria undergoing mitophagy. Right, quantification of the left. Data are means ± SD (n = 3 independent experiments, ****p < 0.0001). (m) Protein (ACO2, LC3, Calbindin, p‐Tau, p17) levels in the whole lysate of cerebellums isolated from 3 (left) to 15 (right) months old WT and p17KO animals. Actin was used as a loading marker. (n) Quantification of the m was done by Image G software. Data are means ± SD (n = 3, nsp > 0.05, **p < 0.01). (o) CerS1 protein in mitochondria isolated from cerebellums of animals from (m), COXIV was used as a loading marker. (p) Quantification of (o). Data means ± SD (n = 3, *p < 0.05). (q) Levels of C18‐Ceramide measured in mitochondrial (M) and non‐mitochondrial (NM) fractions isolated from cerebellums of 15 months old WT and p17KO animals measured by lipid profiling. (r) Levels of CerS1 and TOM40 interaction in cerebellums isolated from 15 months old WT and p17KO mice measured by co‐IP. s, Quantification of (r). Data means ± SD (n = 3, **p < 0.01). (t) Levels of LC3 and TOM40 interaction in cerebellums isolated from 15 months old WT and p17KO mice measured by co‐IP. (u) Quantification of (t). Data means ± SD (n = 3, *p < 0.05).
FIGURE 3
FIGURE 3
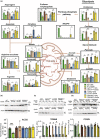
Genetic loss of CerS1, p17/PERMIT, and PARKIN abrogates SoSe‐induced mitophagy response and mitochondrial metabolism in vivo. (a) Metabolomics of the brain (cerebellum) tissues extracted from WT, CerS1to/to, p17KO, and PARKIN KO mice. Levels of metabolites in the cerebellum of WT, CerSto/to, P17KO, and PARKIN KO animals treated either with vehicle or SoSe (1 mg/kg, 3 h). (b) Representative Western blot analysis of ACO2 levels in the brain tissues of WT, CerS1to/to, and PARKIN KO. (c) Quantification of ACO2 levels in brain lysates of mice from (b). Data are means ± SD (n = 3 independent experiments, **p < 0.01). Topological analysis of the TOM40 (d) and COXIV (f) proteins by digestion with PK in mitochondria isolated from brain tissues of animals from (a). (e–g) are the quantification of (d) and (f). Data are means ± SD (n = 3 independent experiments, *p < 0.05).
FIGURE 4
FIGURE 4
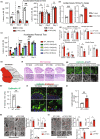
The genetic loss of p17/PERMIT inhibits motor‐neuronal functions in aging mice. (a) Evaluation of 15 (left panel) and 3 months mice motor‐neuron functions by accelerated rotarod test. Latency to fall (the time mouse spent on the rotating rod with increasing velocity) of WT and p17KO during accelerated rotarod task for 3 consecutive days. Repeated‐measures two‐way ANOVA was conducted to examine the main effect of genotype on each day (p values indicated). *p < 0.05, **p < 0.01 by t test with Bonferroni correction. *p < 0.05 by Mann–Whitney test with Bonferroni correction (number of comparisons was 10 for latency to fall). n = 12 mice per genotype. Error bars represent SEM. (b) Analysis of coordination and strength by Composite Phenotype Scoring. This scoring was based on the ledge (left) and string (right) assays. Repeated‐measures two‐way ANOVA was conducted to examine the main effect of genotype. *p < 0.05, **p < 0.01, ***p < 0.001 (n = 12 mice per genotype). Error bars represent SEM. (c) p17KO animals' motor‐neuron deficit is age‐related. An accelerated rotarod test assessed the mice's coordination. (d) Evaluation of learning and memory by Morris water maze, dim‐light open field, elevated plus maze, and novelty Y‐maze tests. p values are indicated (nsp > 0.05). (e) Schematics of the mouse cerebellum's zones. (f) H&E staining of the 3‐ and 15‐month‐old WT and p17KO animals' cerebellum. Insets demonstrate almost complete loss of Purkinje cells in the cerebellum's anterior zone. (g) Upper panels contain confocal microphotographs of the cerebellum of animals from (f) stained against Calbindin, Purkinje marker (green), and DAPI (blue). Lower panels contain insets, as marked in upper panels, with higher magnification. (h) Confocal images of cerebellums of 15 months WT and p17KO animals stained against ubiquitin, calbindin, and DAPI. (i and j) Quantification of (h). For the fluorescence image quantification, Image G software was used (**p < 0.01), n for the WT group is 7, and n for p17KO is 6. Error bars represent SEM. (k) Left panel, TEM micrographs of cerebellums of the 3 months WT (left) and p17KO (right) animals. Lower panels are insets from the top with higher magnification. Scale bars, 2 m. Left top, quantification of mitochondria number per plane from TEM on the left. p value is indicated nsp = 0.05 (n = 7 mice/images per genotype). Error bars represent SEM. Right top, the average area of the mitochondria from TEM is on the left. p value is indicated nsp = 0.05 (n = 7 mice per genotype). Error bars represent SEM. Bottom, quantification of damaged mitochondria. p value is indicated nsp = 0.05 (n = 7 mice per genotype). Error bars represent SEM. (l) Left panel, TEM microphotographs of cerebellums of the 15 months WT (left) and p17KO (right) animals. Lower panels are insets from the top with higher magnification. Scale bars, 2 m. Left top, quantification of the mitochondria from EM on the left. p value is indicated **p < 0.01 (n = 7 mice per genotype). Error bars represent SEM. Right top, the average area of the mitochondria from EM is on the left. **p < 0.01 (n = 9 mice per genotype). Bottom, quantification of damaged mitochondria. p value is indicated **p < 0.01 (n = 7 mice per genotype). Error bars represent SEM.
FIGURE 5
FIGURE 5
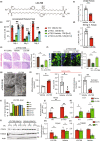
Ceramide analog LCL768 alleviates motor neuron deficiency in 15 months p17/PERMIT−/− (KO) mice by inducing mitophagy. (a) The chemical formula of LCL768, a sphingolipid‐based selenium compound. b, Evaluation of 12 months mice’ motor‐neuron functions by accelerated rotarod test with vehicle (Alzet pump, 28 days) or LCL768 (Alzet pump, 0.1 mg/kg/day for 28 days) during accelerated rotarod task for 3 consecutive days. *p < 0.05, **p < 0.01 by t test with Bonferroni correction (n = 12 mice per genotype). Error bars represent SEM. (c and d) Analysis of animals' coordination and strength by Composing Phenotype Scoring. A detailed description of the method is in the legend of (b). The average composite score for each p17KO‐vehicle and p17KO‐LCL768 was calculated. Repeated‐measures two‐way ANOVA was conducted to examine the main effect of genotype (p values indicated). **p < 0.01 (n = 7 mice per genotype). Error bars represent SEM. (e) (left panel), H&E staining of the 12‐month WT and p17KO animals' cerebellum treated with Vehicle or LCL768. Insets demonstrate loss of Purkinje cells in the cerebellum's anterior zone of p17KO and restoration of the cells in treated mice with LCL768; right panel, quantification of the left. (f) Confocal microphotographs of the animals' cerebellums from (e) stained against Calbindin, Purkinje marker (green), and DAPI (blue). (g) TEM micrographs of cerebellums of the 12 months p17KO mice treated with vehicle (left) or LCL768 (right). Lower panels are insets from the top with higher magnification. Scale bars, 2 nm. (h) Left, Quantification of mitochondria number from (g). p value is indicated nsp = 0.05, *p < 0.05 (n = 4 mice from vehicle‐treated group and n = 5 mice from LCL768 treated group). Error bars represent SEM. Middle, the average area of the mitochondria from (g). p value is indicated nsp = 0.05, *p < 0.05 (n = 9 mice per genotype). Right, Quantification of damaged mitochondria from (g). p value, nsp = 0.05, *p < 0.05 (n = 7 mice per genotype). (i) Levels of LCL768 in the brain of p17KO mice implanted with Alzet pumps during indicated periods (28 days, +30 min, and 3, 6, or 24 h), measured by mass spectrometry. *p < 0.05, **p < 0.01 (n = 3 mice per group). Error bars represent SEM. (j) ACO2 levels in the cerebellum of animals from (b). *p < 0.05, **p < 0.01 (at least 4 mice have been used per group). Error bars represent SEM. (k) LC3 levels in the cerebellum of animals from (b). *p < 0.05 (at least 4 mice have been used per group). Error bars represent SEM. (l) Topological analysis of the COXIV and TOM20 proteins by digestion with PK in mitochondria isolated from brain tissues of animals from (b). (m and n) Quantification of (l). Data are means ± SD (n = 3 animals per group, *p < 0.05).
FIGURE 6
FIGURE 6
Detection of p17/PERMIT/CerS1/ceramide‐dependent mitophagy in the brain tissues of healthy donors versus ALS patients. (a) Levels of ACO2, CerS1, p17 in the whole lysates brain tissues from control and ALS individuals. Actin is used as a loading control. (b) CerS1 in mitochondria isolated from cerebellums from (a). COXIV was used as a loading control. (c) quantification of (b). Data are means ± SD (n = 3, **p < 0.01). (d) Levels of C18‐ceramide were measured in mitochondrial fractions, isolated from the cerebellum tissues of control individuals and ALS patients by lipid profiling. (e) Levels of CerS1 and TOM40 interaction in cerebellums isolated from control and ALS patients were measured by co‐IP. (f) Quantification of (e). Data are means ± SD (n = 3, ***p < 0.001). (g) Levels of p17 in whole lysates isolated from the cerebellum of control and ALS patients. Actin is used as a loading control. (h) Levels of p17 gene relative expression in control and ALS human cerebellums. Data are means ± SD (n = 3, ***p < 0.001). (i) Confocal images of the cerebellums isolated from human age‐matched control and ALS patients and stained with calbindin (green), ubiquitin (red), and DAPI (blue). The yellow image shows the co‐localization of calbindin and ubiquitin. Arrows point at Purkinje cells. (j) Quantification of (i). Data are means ± SD (n = 3, **p < 0.01).

References

    1. Abidi, M. , de Marco, G. , Grami, F. , Termoz, N. , Couillandre, A. , Querin, G. , Bede, P. , & Pradat, P. F. (2021). Neural correlates of motor imagery of gait in amyotrophic lateral sclerosis. Journal of Magnetic Resonance Imaging, 53(1), 223–233. 10.1002/jmri.27335 - DOI - PubMed
    1. Bede, P. , Chipika, R. H. , Christidi, F. , Hengeveld, J. C. , Karavasilis, E. , Argyropoulos, G. D. , Lope, J. , Li Hi Shing, S. , Velonakis, G. , Dupuis, L. , Doherty, M. A. , Vajda, A. , McLaughlin, R. , & Hardiman, O. (2021). Genotype‐associated cerebellar profiles in ALS: Focal cerebellar pathology and cerebro‐cerebellar connectivity alterations. Journal of Neurology, Neurosurgery and Psychiatry, 92(11), 1197–1205. 10.1136/jnnp-2021-326854 - DOI - PMC - PubMed
    1. Bisaccia, F. , Capobianco, L. , Brandolin, G. , & Palmieri, F. (1994). Transmembrane topography of the mitochondrial oxoglutarate carrier assessed by peptide‐specific antibodies and enzymatic cleavage. Biochemistry, 33(12), 3705–3713. 10.1021/bi00178a030 - DOI - PubMed
    1. Blom, T. , Li, S. , Dichlberger, A. , Bäck, N. , Kim, Y. A. , Loizides‐Mangold, U. , Riezman, H. , Bittman, R. , & Ikonen, E. (2015). LAPTM4B facilitates late endosomal ceramide export to control cell death pathways. Nature Chemical Biology, 11(10), 799–806. 10.1038/nchembio.1889 - DOI - PubMed
    1. Cheng, C. T. , Qi, Y. , Wang, Y. C. , Chi, K. K. , Chung, Y. , Ouyang, C. , Ann, D. K. , Oh, M. E. , Sheng, X. , Tang, Y. , Liu, Y. R. , Lin, H. H. , Kuo, C. Y. , Schones, D. , Vidal, C. M. , Chu, J. C. , Wang, H. J. , Chen, Y. H. , Miller, K. M. , … Ann, D. K. (2018). Arginine starvation kills tumor cells through aspartate exhaustion and mitochondrial dysfunction. Communications Biology, 1, 178. 10.1038/s42003-018-0178-4 - DOI - PMC - PubMed

Publication types

LinkOut - more resources