

TRIM5 Promotes Systemic Lupus Erythematosus Through CD4(+) T Cells and Macrophage
- PMID: 37614552
- PMCID: PMC10443694
- DOI: 10.2147/IJGM.S416493
TRIM5 Promotes Systemic Lupus Erythematosus Through CD4(+) T Cells and Macrophage
Abstract
Purpose: Systemic lupus erythematosus (SLE) is a typical autoimmune disease characterized by the involvement of multiple organs and the production of antinuclear antibodies. This study aimed to investigate the molecular mechanism of SLE.
Patients and methods: We retrieved genome-wide gene expression levels from five public datasets with relatively large sample sizes from the Gene Expression Omnibus (GEO), and we compared the expression profiles of peripheral blood mononuclear cells (PBMCs) from SLE patients and healthy controls (HCs). The expression of seven target genes in PBMCs from 25 cases and 3 HCs was further validated by reverse-transcription quantitative PCR (RT‒qPCR). Flow cytometry was used for verifying the proportion of naive CD4(+) T cells and M2 macrophages in PBMCs from 5 cases and 4 HCs.
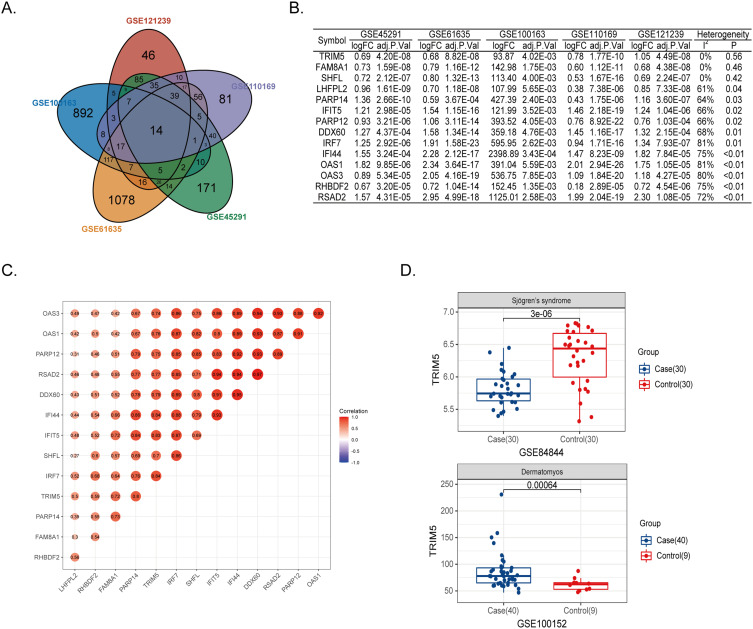
Results: We found 14 genes (TRIM5, FAM8A1, SHFL, LHFPL2, PARP14, IFIT5, PARP12, DDX60, IRF7, IF144, OAS1, OAS3, RHBDF2, and RSAD2) that were differentially expressed among all five datasets. The heterogeneity test under the fixed effect model showed no obvious heterogeneity of TRIM5, FAM8A1, and SHFL across different populations. TRIM5 was positively correlated with the remaining 13 genes. By separating patient samples into TRIM5-high and TRIM5-low groups, we found that up-regulated genes in the TRIM5-high group were mainly enriched in virus-related pathways. Immune cell proportion analysis and flow cytometry revealed that naive CD4(+) T cells were significantly decreased while M2 macrophages were increased in the SLE group. TRIM5 expression levels were negatively correlated with naive CD4(+) T cells but positively correlated with M2 macrophages.
Conclusion: Our data indicated that TRIM5 might be a key factor that modulates SLE etiology, possibly through naive CD4(+) T cells and M2 macrophages.
Keywords: autoimmune disease; differential gene expression analysis; gene; virus.
© 2023 Pan et al.
Conflict of interest statement
Dr Leilei Wen reports grants from National Natural Science Foundation of China, outside the submitted work. The author reports no other conflicts of interest in this work.
Figures


Similar articles
-
Aberrant expression of regulatory cytokine IL-35 in patients with systemic lupus erythematosus.Lupus. 2015 Oct;24(12):1257-66. doi: 10.1177/0961203315585815. Epub 2015 May 11. Lupus. 2015. PMID: 25966926
-
Identification of key interferon-stimulated genes for indicating the condition of patients with systemic lupus erythematosus.Front Immunol. 2022 Jul 28;13:962393. doi: 10.3389/fimmu.2022.962393. eCollection 2022. Front Immunol. 2022. PMID: 35967341 Free PMC article.
-
Defective response of CD4(+) T cells to retinoic acid and TGFβ in systemic lupus erythematosus.Arthritis Res Ther. 2011 Jun 27;13(3):R106. doi: 10.1186/ar3387. Arthritis Res Ther. 2011. PMID: 21708033 Free PMC article.
-
Regulatory T-cell levels in systemic lupus erythematosus patients: a meta-analysis.Lupus. 2019 Apr;28(4):445-454. doi: 10.1177/0961203319828530. Epub 2019 Feb 11. Lupus. 2019. PMID: 30744525
-
The circRNA-miRNA-mRNA regulatory network in plasma and peripheral blood mononuclear cells and the potential associations with the pathogenesis of systemic lupus erythematosus.Clin Rheumatol. 2023 Jul;42(7):1885-1896. doi: 10.1007/s10067-023-06560-5. Epub 2023 Mar 2. Clin Rheumatol. 2023. PMID: 36862342 Review.
Cited by
-
Crucial Roles of RSAD2/viperin in Immunomodulation, Mitochondrial Metabolism and Autoimmune Diseases.Inflammation. 2025 Apr;48(2):520-540. doi: 10.1007/s10753-024-02076-5. Epub 2024 Jun 23. Inflammation. 2025. PMID: 38909344 Review.
-
Polydatin-curcumin formulation alleviates CTD-ILD-like lung injury in mice via GABBR/PI3K/AKT/TGF-β pathway.Front Pharmacol. 2025 Jun 5;16:1573525. doi: 10.3389/fphar.2025.1573525. eCollection 2025. Front Pharmacol. 2025. PMID: 40538533 Free PMC article.
-
Identification of differentially expressed immune-related genes in patients with systemic lupus erythematosus and the development of a hub gene-based diagnostic model.Eur J Med Res. 2025 Jul 30;30(1):689. doi: 10.1186/s40001-025-02953-1. Eur J Med Res. 2025. PMID: 40739239 Free PMC article.
References
LinkOut - more resources
Full Text Sources
Research Materials
