

Interspecific differences and ecological correlations between scale number and skin structure in freshwater fishes
- PMID: 37614923
- PMCID: PMC10443616
- DOI: 10.1093/cz/zoac059
Interspecific differences and ecological correlations between scale number and skin structure in freshwater fishes
Abstract
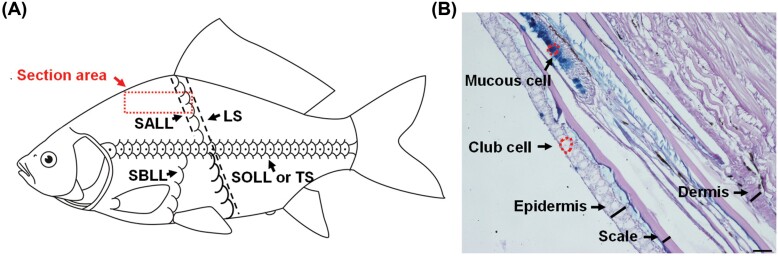
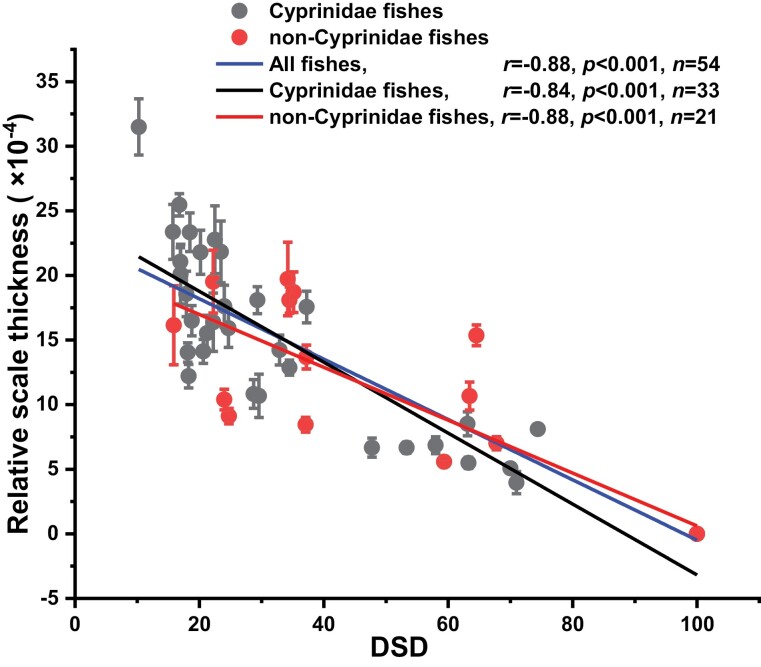
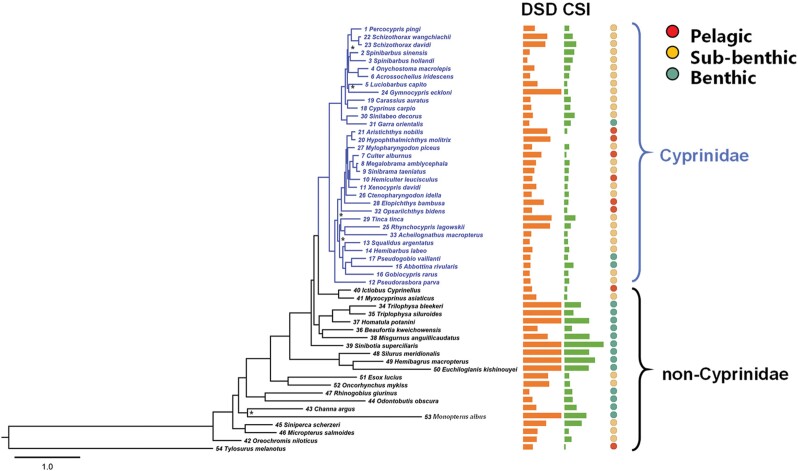
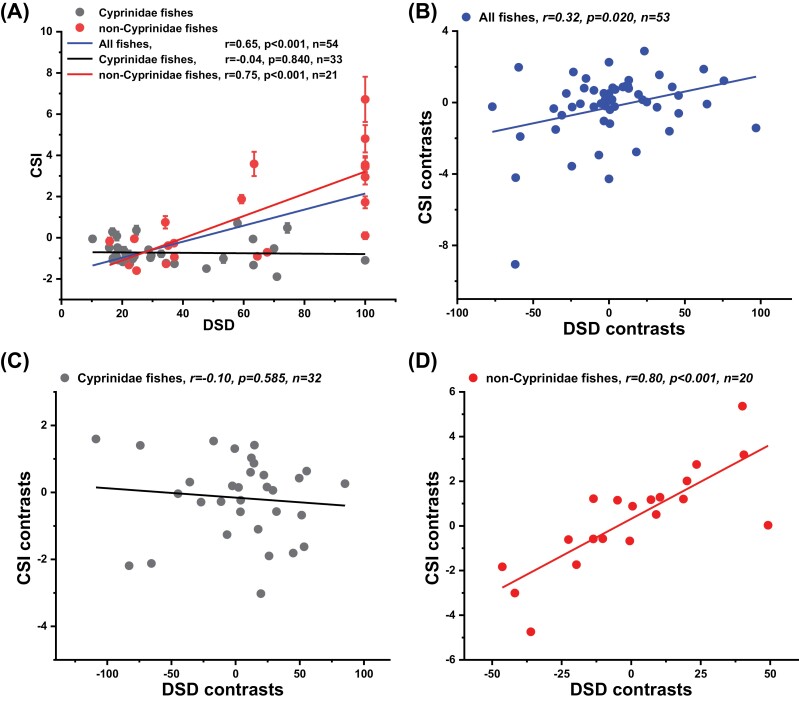
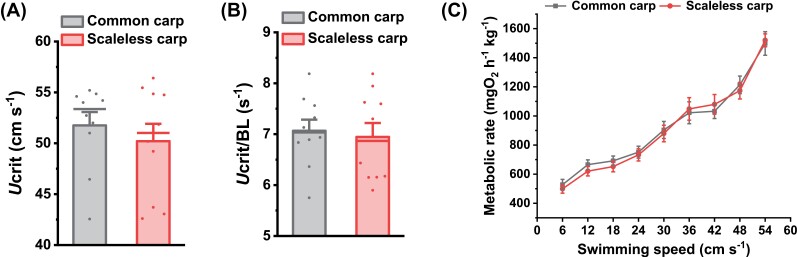
Fish skin is mainly composed of the epidermis, dermis, and its derivative scales. There is a wide diversity in scale number in fishes, but the diversity of skin structure lacks systematic histological comparison. This research aimed to improve our understanding of the functional relationship between the scale number and the skin structure in freshwater fishes and to determine which ecological factors affect the scale number and skin structure. First, we presented a method to quantify skin structure in fish and histologically quantified the skin structure of 54 freshwater fishes. Second, we collected the scale number and habitat information of 509 Cyprinidae fishes in China and explored which ecological factors were related to their scale number. Third, common carp and scaleless carp were used as models to study the effects of scale loss on swimming. We found a strong negative correlation between scale thickness and scale number. The main factor affecting the skin structure of fishes was the species' water column position, and the skin of benthic fishes was the most well-developed (thicker skin layers (dermis, epidermis) or more/larger goblet cells and club cells). The scale number was related to two factors, namely, temperature and water column position, and cold, benthic and pelagic adaptation may have contributed to increased scale numbers. Only in benthic fishes, the more well-developed their skin, the more scales. In common carp, scale loss did not affect its swimming performance. In summary, we suggest that there is a rich diversity of skin structure in freshwater fishes, and the scales of fish with well-developed skin tend to degenerate (greater number/smaller size/thinner, or even disappear), but the skin of fish with degenerated scales is not necessarily well developed.
Keywords: ecological adaptation; functional antagonism; scale degeneration; scale number; skin structure.
© The Author(s) 2022. Published by Oxford University Press on behalf of Editorial Office, Current Zoology.
Conflict of interest statement
The authors declare that they have no competing interests.
Figures


Similar articles
-
Freshwater fish biodiversity restoration in floodplain rivers requires connectivity and habitat heterogeneity at multiple spatial scales.Sci Total Environ. 2022 Sep 10;838(Pt 4):156509. doi: 10.1016/j.scitotenv.2022.156509. Epub 2022 Jun 3. Sci Total Environ. 2022. PMID: 35667436
-
Drainage network position and historical connectivity explain global patterns in freshwater fishes' range size.Proc Natl Acad Sci U S A. 2019 Jul 2;116(27):13434-13439. doi: 10.1073/pnas.1902484116. Epub 2019 Jun 17. Proc Natl Acad Sci U S A. 2019. PMID: 31209040 Free PMC article.
-
Explosive diversification following a benthic to pelagic shift in freshwater fishes.BMC Evol Biol. 2013 Dec 17;13:272. doi: 10.1186/1471-2148-13-272. BMC Evol Biol. 2013. PMID: 24341464 Free PMC article.
-
Are larvae of demersal fishes plankton or nekton?Adv Mar Biol. 2006;51:57-141. doi: 10.1016/S0065-2881(06)51002-8. Adv Mar Biol. 2006. PMID: 16905426 Review.
-
Why are there so few freshwater fish species in most estuaries?J Fish Biol. 2015 Apr;86(4):1227-50. doi: 10.1111/jfb.12641. Epub 2015 Mar 5. J Fish Biol. 2015. PMID: 25739335 Review.
References
-
- Agrawal N, Mittal AK, 1992. Structure and histochemistry of the epithelia of lips and associated structures of a catfish Rita rita. Jpn J Ichthyol 39:93–102.
-
- Bae J, Kwon H, Park SR, Lee J, Song I, 2006. Explicit correlation coefficients among random variables, ranks, and magnitude ranks. IEEE T Inform Theory 52:2233–2240.
-
- Bolotovskiy AA, Levin BA, 2018. Effects of thyroid hormones on vertebral numbers in two cyprinid fish species: Rutilus rutilus (Linnaeus, 1758) and Abramis brama (Linnaeus, 1758). J Appl Ichthyol 34:449–454.
-
- Chen YY, 1998. Fauna Sinica, Osteichrhtes Cypriniformes II. Beijing: Science Press.
LinkOut - more resources
Full Text Sources
Research Materials