. 2023;5(8):933-946.
doi: 10.1038/s42256-023-00702-9. Epub 2023 Aug 10.

Prediction of mechanistic subtypes of Parkinson's using patient-derived stem cell models

Affiliations

Prediction of mechanistic subtypes of Parkinson's using patient-derived stem cell models

Karishma D'Sa et al. Nat Mach Intell. 2023.

Abstract

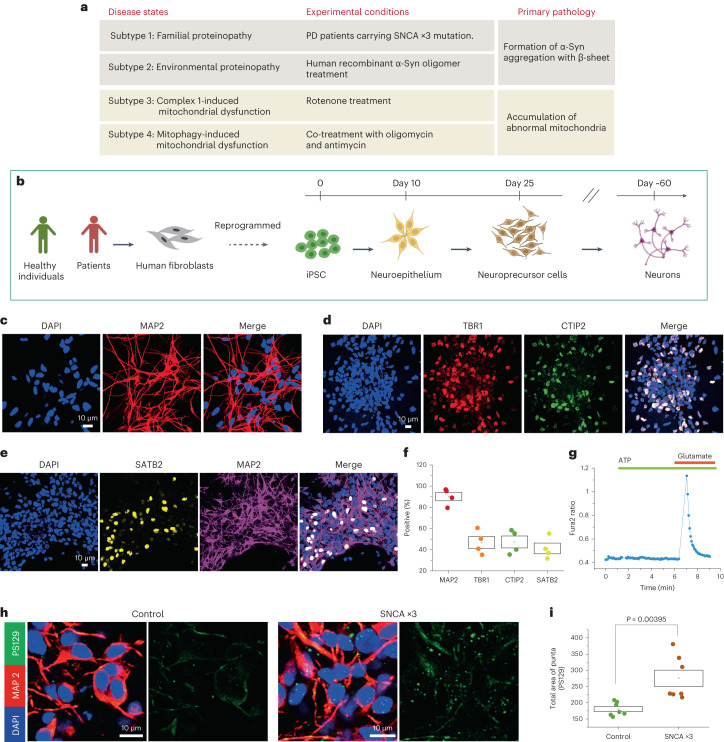
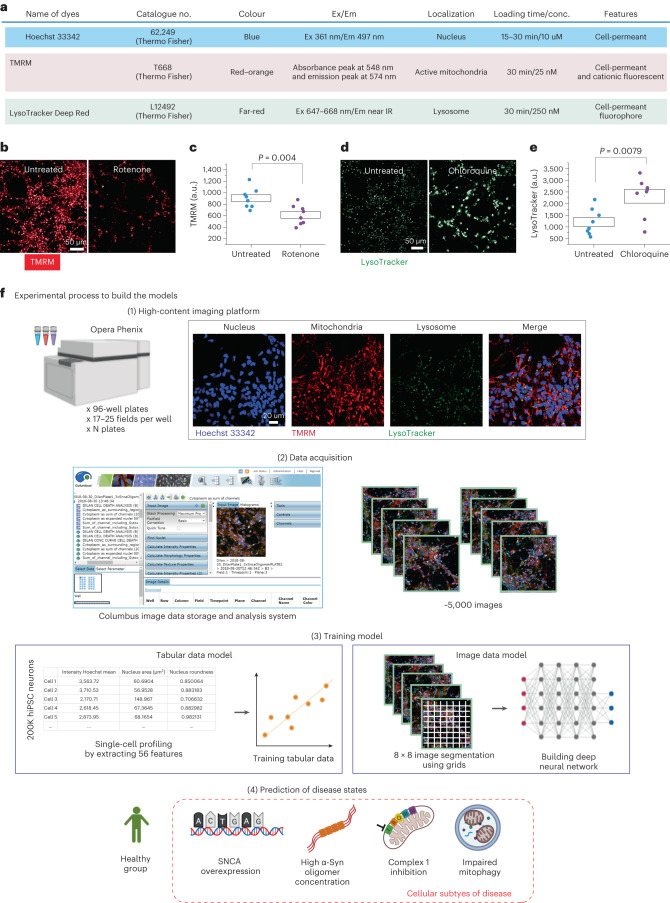
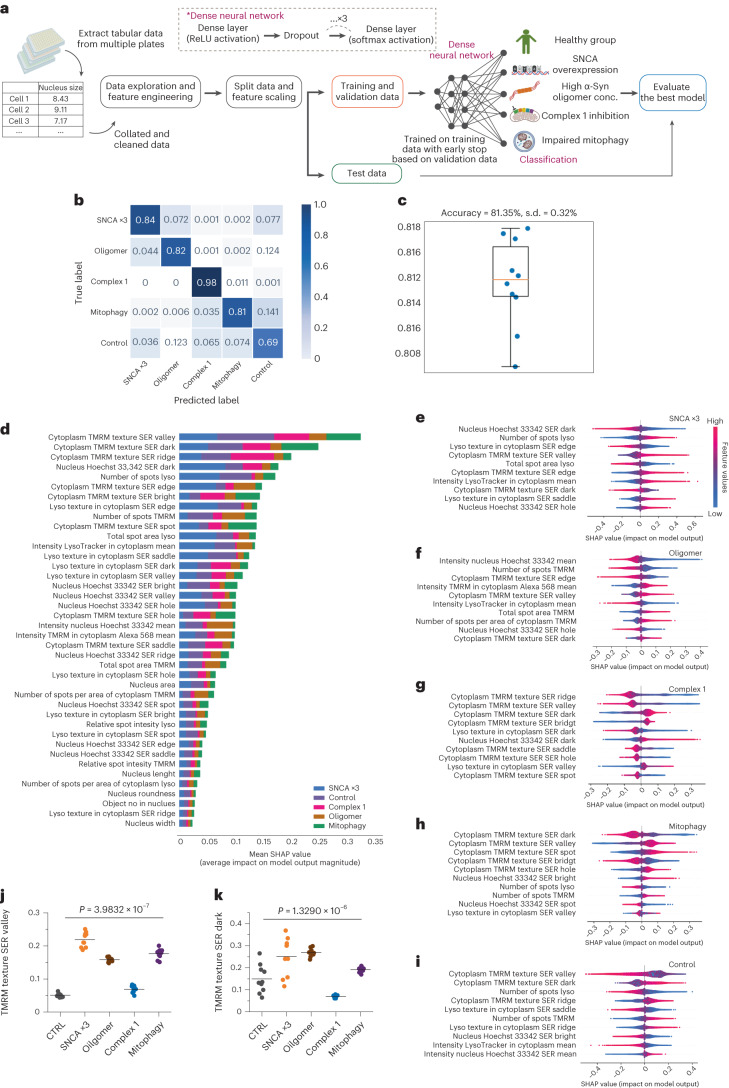
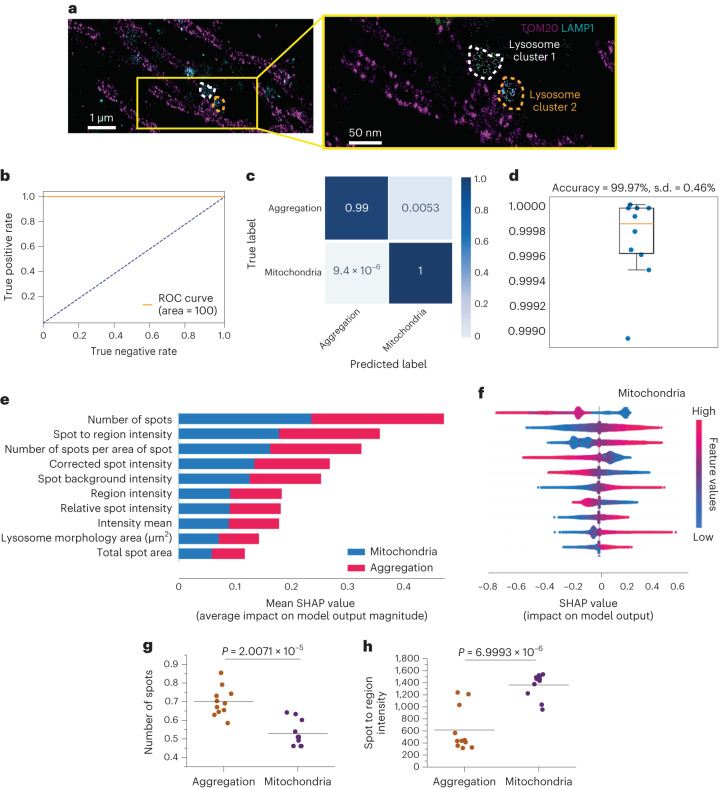
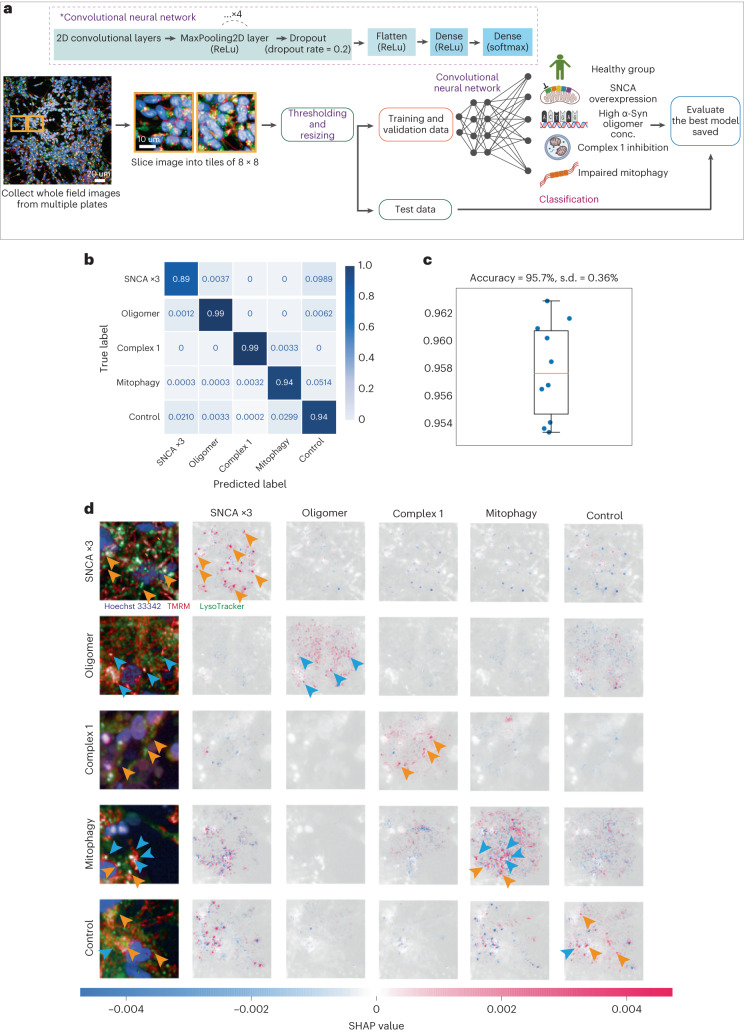
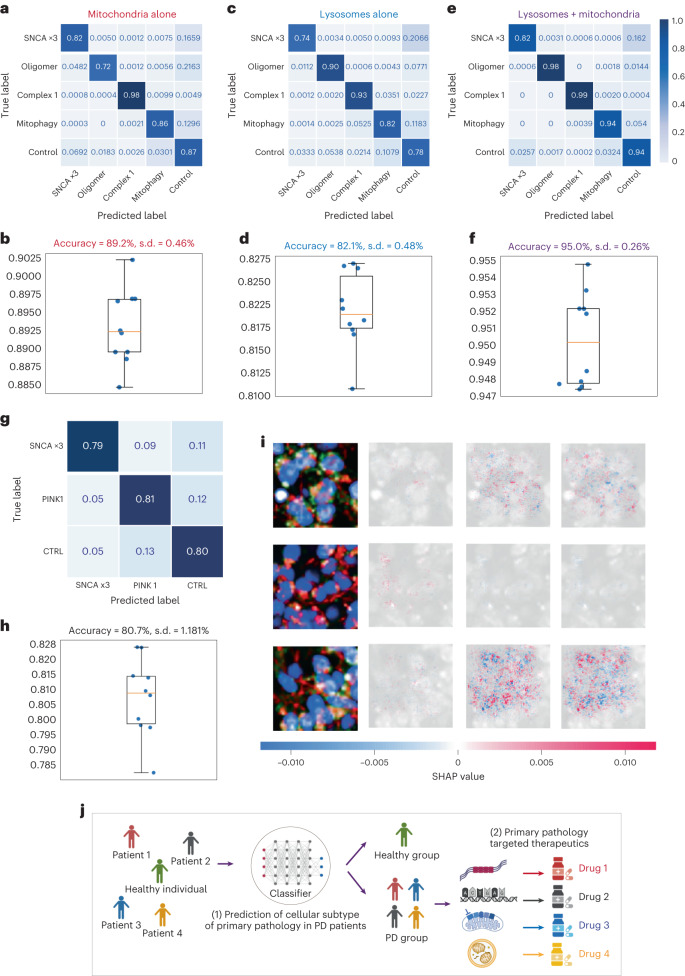
Parkinson's disease is a common, incurable neurodegenerative disorder that is clinically heterogeneous: it is likely that different cellular mechanisms drive the pathology in different individuals. So far it has not been possible to define the cellular mechanism underlying the neurodegenerative disease in life. We generated a machine learning-based model that can simultaneously predict the presence of disease and its primary mechanistic subtype in human neurons. We used stem cell technology to derive control or patient-derived neurons, and generated different disease subtypes through chemical induction or the presence of mutation. Multidimensional fluorescent labelling of organelles was performed in healthy control neurons and in four different disease subtypes, and both the quantitative single-cell fluorescence features and the images were used to independently train a series of classifiers to build deep neural networks. Quantitative cellular profile-based classifiers achieve an accuracy of 82%, whereas image-based deep neural networks predict control and four distinct disease subtypes with an accuracy of 95%. The machine learning-trained classifiers achieve their accuracy across all subtypes, using the organellar features of the mitochondria with the additional contribution of the lysosomes, confirming the biological importance of these pathways in Parkinson's. Altogether, we show that machine learning approaches applied to patient-derived cells are highly accurate at predicting disease subtypes, providing proof of concept that this approach may enable mechanistic stratification and precision medicine approaches in the future.

Keywords: High-throughput screening; Neurodegeneration.


Conflict of interest statement

Competing interestsThe authors declare no competing interests.

Figures

Fig. 1
Fig. 1. Pathological cellular subtypes of PD and the generation of a human PD model using hiPSCs.
a, Details on the cellular subtypes. Subtype 1: cells generated with SNCA ×3 mutation represent familial proteinopathy. Subtype 2: environmental proteinopathy was induced by exposing cells to exogenous protein aggregates. Subtype 3: toxin-induced mitochondrial dysfunction was achieved by exposing cells to rotenone, a complex 1 inhibitor. Subtype 4: mitophagy was induced using stimulation with oligomycin/antimycin. b, Schematic showing hiPSC-derived neuronal differentiation strategy. Fibroblasts from patients with PD or healthy donors are reprogrammed into hiPSCs and differentiated into cortical neurons using a protocol adapted from ref. . cf, Characterization of iPSC-derived neurons using immunohistochemistry for the representative images of MAP2, a neuronal marker (c); TBR1 and CTIP2, deep cortical layers (d); SATB2, the upper cortical layer (e); and quantification (f; n = 4 number of wells per group). g, Calcium imaging measured with Fura-2 shows that the hiPSC-derived cortical neurons exhibit calcium signals in response to physiological concentrations (5 µM) of glutamate. h,i, hiPSC-derived neurons from PD patients with SNCA ×3 mutation display an increase in phosphorylated α-Syn (a pathological form of α-Syn) (n = 6 or 7 number of wells per group). Statistical details are found in Supplementary Table 4. The data in i are presented as data ± s.e.m. Source data
Fig. 2
Fig. 2. Workflow to develop a classifier to make a prediction of cellular subtypes in PD.
a, Experimental details for live-cell imaging. be, High-throughput imaging enables visualization of mitochondrial depolarization by complex 1 inhibitor, rotenone (5 µM; b,c, n = 8 number of wells per group) and lysosomal dysfunction by chloroquine (1 µM; d,e, n = 8 number of wells per group). The statistical details are found in Supplementary Table 4. Data in c and e are presented as data ± s.e.m. f, A schematic illustration to describe the experimental process of building the models. First, live-cell imaging with an Opera Phenix High-Content Screening System (PerkinElmer); cells are loaded with live-cell imaging dyes. Representative images for the three channels: Hoechst 33342 (nucleic labelling within 387/11 nm excitation and 417–447 nm emission); TMRM (mitochondrial labelling within 505 nm excitation and 515 nm emission); and LysoTracker deep red (lysosomal labelling within 614 nm excitation and 647 nm emission). Second, a Columbus Image Data Storage and Analysis System (PerkinElmer) was used to extract 56 morphological features (Extended Data Figs. 1a and 2a) and whole images. Third, models are trained on tabular data extracted from cell profiling features or images uniformly gridded by 8 × 8 segmented cropped images and categorically labelled and fed into the neural network. Fourth, the learned model enables the prediction of the healthy group or the four disease subtypes. Source data
Fig. 3
Fig. 3. A classifier trained on cell profiles of key organelles predicts disease states with 82% accuracy.
a, An illustration of workflow for machine learning with tabular data. b,c, Classification performance by a confusion matrix (b) and the stratified K-fold cross-validation (c) on an unseen test set, trained on cell profile tabular data (n = 10 folds fit and evaluated; data are presented as mean values ± s.d.). d, Feature ranking based on their SHAP values coloured by their importance for each class. ei, A SHAP summary plot for the top ten most important features based on their SHAP values for each of the classes: SNCA ×3 (e), oligomer (f), complex 1 (g), mitophagy (h) and control (i). Dots are coloured according to the values of features for each cell; red and blue represent high and low feature values, respectively. A positive SHAP indicates an increased probability of predicting each state (positive impact on the output) and vice versa. j,k, Random selection of ten wells to test top two features shows an effect of cellular subtype across five groups (one-way ANOVA P < 0.0005, n = 10 number of wells per group). The statistical details are found in Supplementary Table 4. Data are presented as data and mean. Control, healthy group; SNCA ×3, SNCA mutation; oligomer, treatment with α-Syn oligomer; complex 1, treatment with mitochondrial complex 1 inhibition; mitophagy, co-treatment with antimycin and oligomycin to induce mitophagy. Source data
Fig. 4
Fig. 4. Interaction between cellular organelle networks classifies aggregation and mitochondrial toxicity phenotypes.
a, Images of mitochondrial and lysosomal co-localization were obtained using super-resolution direct stochastic optical reconstruction microscopy to visualize the contact between the mitochondria and lysosome—organelles both affected in PD. Mitochondria and lysosomes are labelled with TOM20 and LAMP1, respectively (n = 2–3 fields of view, across two independent iPSC lines). b–d, Receiver operating characteristic–area under the ROC curve of classification performance (b); the confusion matrix (c); and stratified K-fold cross-validation of the model to identify aggregation versus the mitochondrial toxicity group (d) on an unseen test set, trained on the selected cell profile tabular data (mitochondria and lysosome contact; n = 10 folds fit and evaluated). Data are presented as mean values ± s.d. The selected tabular data from mitochondria and lysosome co-localization predict the two disease states of mitochondrial toxicity and aggregation with high accuracy (>99%). e, Feature ranking that drives the prediction of aggregation on the basis of their SHAP values, coloured by their importance for each class. f, A SHAP summary plot of top ten features to classify the groups into mitochondrial toxicity (the SHAP values of the aggregation group have the opposite colours to the mitochondrial group shown here and are therefore not presented). g,h, Random selection of eight wells to compare the top two lysosomal features that contact mitochondria showing that there is a statistical significance between mitochondrial toxicity and aggregation groups. The statistical details are presented in Supplementary Table 4. Data are presented as data and the mean. Aggregation, combining subtypes of SNCA ×3 and oligomer; mitochondrial toxicity, combining subtypes of complex 1 and mitophagy. Source data
Fig. 5
Fig. 5. A classifier trained by images using deep neural network accurately discriminates PD pathology.
a, Illustration of workflow for deep learning with images. b,c, Deep learning classification performance on an unseen test set trained on 8 × 8 tiled images by the confusion matrix (b) and the stratified K-fold cross-validation (c) (n = 10 folds fit and evaluated). Data are presented as mean values ± s.d. A sample is assigned to five classes with the maximum prediction accuracy (95%). d, A SHAP DeepExplainer plot summary. Rows show images from the test set—one from each class—and the columns represent each class. The SHAP value for each score is shown below. Orange and blue arrows indicate either LysoTracker (lysosome) or TMRM (mitochondria) positive areas, respectively.
Fig. 6
Fig. 6. Deep neural network using mitochondria images alone retains high prediction accuracy.
af, Deep learning classification performance: confusion matrices and stratified K-fold cross-validation for mitochondria alone (n = 10 folds fit and evaluated; data are presented as mean values ± s.d.) (a,b), lysosomes alone (c,d), and both together (e,f). g–i, The confusion matrix (g) and the stratified K-fold cross-validation (h) of the three-class genetic classifier (SNCA ×3, PINK1 and CTRL) on an unseen test set (n = 10 folds fit and evaluated; data are presented as mean values ± s.d.). A test sample is assigned to three classes with an overall prediction accuracy of 80.7%, and a SHAP DeepExplainer plot summary is shown (i). Rows of the SHAP DeepExplainer plot summary show images from the test set, one from each class, and the columns represent each class. The SHAP value for each score is shown below. j, A schematic illustration demonstrates how machine learning-based classifiers can be applied to improve the approach to PD therapeutics. f(1). Our classifier can classify individuals into PD and healthy groups. The PD-diagnosed individuals can be further classified based on their mechanistic subtype. f(2). Mechanism-specific targeting drugs could be matched with PD patients based on their own disease subtypes.
Extended Data Fig. 1
Extended Data Fig. 1. Characterization of α-Syn oligomers using SAVE imaging.
(a) Representative SAVE images of early oligomers (4 h), late oligomers (8 h), and fibrils (24 h). The length and intensity of each detected aggregate were determined, and are presented in histograms of lengths (b) and intensities (c). 25 SAVE images were taken for each time point.
Extended Data Fig. 2
Extended Data Fig. 2. Representative images of the plates used.
Representative images show similar image quality across the plates.
Extended Data Fig. 3
Extended Data Fig. 3. Supportive data for Fig. 3.
a. The features regarding three key organelles, nucleus (Hoechst3337), mitochondria (TMRM) and lysosome (Lyso) used to train tabular data. Morphologically defined features are included such as cell area, expression intensity, the number of spots, roundness, length and width. SER texture features are also included defined as Spot, Hole, Edge, Ridge, Valley, Saddle, Bright and Dark which measure local patterns of pixel intensity providing the structural information of the organelle loading (reviewed here (Di Cataldo and Ficarra, ) (Cretin et al., ). b. The Loss and Accuracy curve (training and validation).
Extended Data Fig. 4
a. Cell profiling features for the lysosomal features that contact mitochondria. b. The plot shows the average scaling factor, with standard deviation, for control distribution across plates (n = 541,300 cells) for the lysosomal features that contact mitochondria in the training dataset. Data are presented as mean values ± SD. The features were scaled per control in each plate using the Power Transformer scaler. Those with a high variance in the scaling factor, lambda, (>50) in the training dataset, such as ‘Lysosome texture SER Hole’ feature were excluded from the training, validation and test dataset. c. ROC-AUG (ci) and the Loss and Accuracy curve (training and validation. d. Confusion matrix of 5-class model training on the selected data from the mitochondrial and lysosomal co-localization.
Extended Data Fig. 5
Extended Data Fig. 5. Supportive data for the main Fig. 5.
a. Examples of 8x8 tiled images with merge of Hoechst, TMRM and Lysotracker images from the test set that are predicted above 99.99% accuracy from each class. SNCA x3 (n = 7983), Oligomer (n = 8307), Complex 1 (n = 11875), Mitophagy (n = 13692), and one control group (n = 22,461) that contained 1–20 cells per sliced image. b. The Loss and Accuracy curve (training and validation).
Extended Data Fig. 6
Extended Data Fig. 6. Supportive data for the main Fig. 6.
a–c. The loss and accuracy curve (training and validation) of the tile-based images of mitochondria alone (a), lysosome alone (b) and both together (c).
Extended Data Fig. 7
Extended Data Fig. 7. Five top features of newly added line of SNCA.
a–e, Bar graphs showing the top 5 organellar disease features (Nucleus HOECHSST SER Dark, a; Number of Spots Lyso, b; Lyso texture SER edge, e; TMRM texture SER Valley, d; Total Spot area Lyso, e) for subtype 1 (SNCA x3) (mainly lysosomal) using a different SNCA x3 hiPSC clone and controls. The data points are colour-coded to show independent plates, across control and SNCA x3 neurons (n = 40 wells per genotype across 2 independent plates. The statistical details are found in Supplementary Table 4. Data are presented as data and the mean. Source data
Extended Data Fig. 8
Extended Data Fig. 8. Five top features of newly added line of PINK1.
a–e, Bar graphs showing the top 5 organellar disease features (TMRM texture SER Ridge, a; TMRM texture SER Valley, b; TMRM texture SER Dark, c; TMRM texture SER Bright, d; Lyso texture in cytoplasm SER Dark, e) for subtype 3 (Complex 1) (mainly mitochondrial) using a hiPSC line from a patient with a PINK1 mutation (ILE368ASN). The data points are color-coded to show independent plates, across control and PINK1 PD neurons (n = 90 wells per genotype across 3 independent plates. The statistical details are found in Supplementary Table 4. Data are presented as data and the mean. Source data

References

    1. Braak H, et al. Staging of brain pathology related to sporadic Parkinson’s disease. Neurobiol. Aging. 2003;24:197–211. doi: 10.1016/S0197-4580(02)00065-9. - DOI - PubMed
    1. Spillantini MG, et al. α-Synuclein in Lewy bodies. Nature. 1997;388:839–840. doi: 10.1038/42166. - DOI - PubMed
    1. Weinreb PH, Zhen W, Poon AW, Conway KA, Lansbury PT., Jr. NACP, a protein implicated in Alzheimer’s disease and learning, is natively unfolded. Biochemistry. 1996;35:13709–13715. doi: 10.1021/bi961799n. - DOI - PubMed
    1. Cheng HC, Ulane CM, Burke RE. Clinical progression in Parkinson disease and the neurobiology of axons. Ann. Neurol. 2010;67:715–725. doi: 10.1002/ana.21995. - DOI - PMC - PubMed
    1. Kusumoto D, Yuasa S. The application of convolutional neural network to stem cell biology. Inflamm. Regen. 2019;39:14. doi: 10.1186/s41232-019-0103-3. - DOI - PMC - PubMed