. 2023;5(8):830-844.
doi: 10.1038/s42256-023-00689-3. Epub 2023 Jul 27.

Resolution enhancement with a task-assisted GAN to guide optical nanoscopy image analysis and acquisition

Affiliations

Resolution enhancement with a task-assisted GAN to guide optical nanoscopy image analysis and acquisition

Catherine Bouchard et al. Nat Mach Intell. 2023.

Abstract

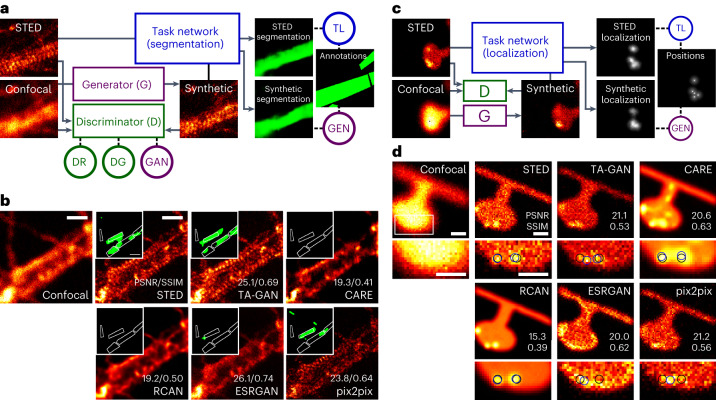
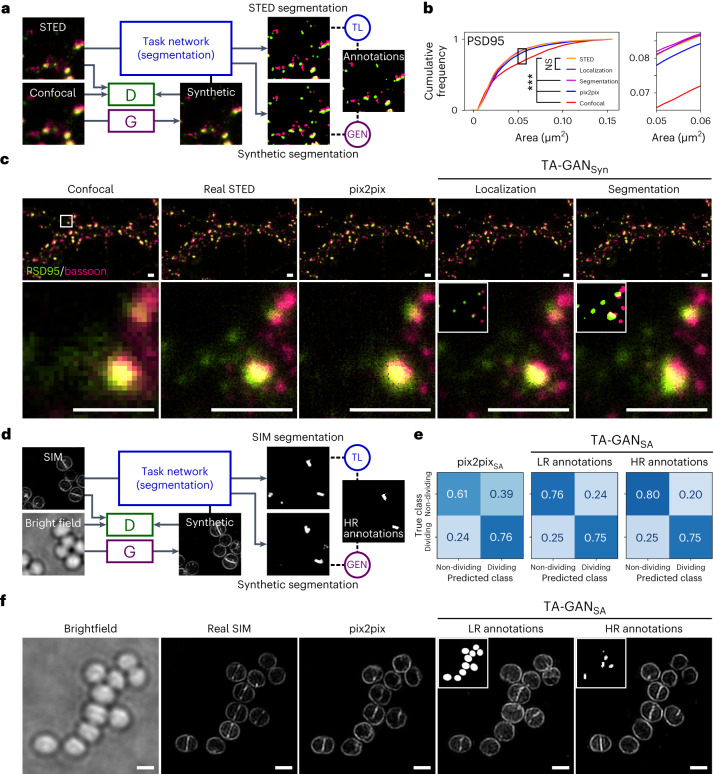
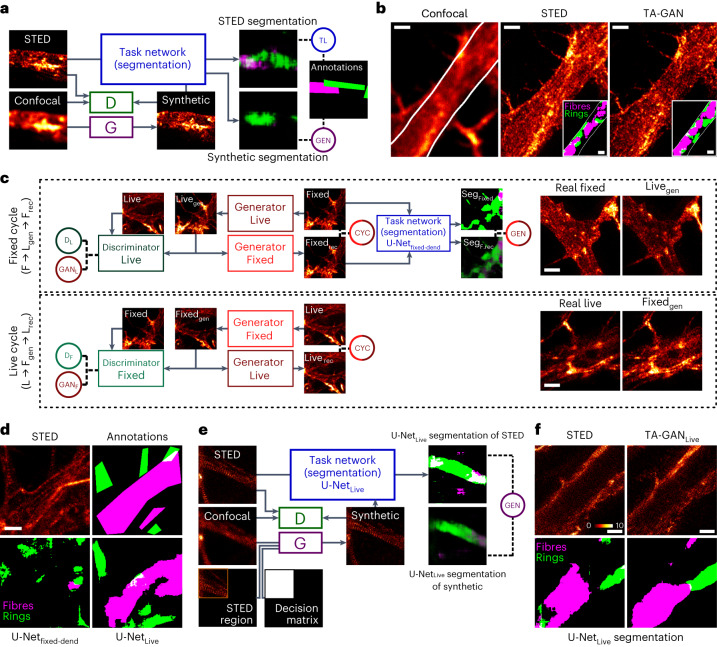
Super-resolution fluorescence microscopy methods enable the characterization of nanostructures in living and fixed biological tissues. However, they require the adjustment of multiple imaging parameters while attempting to satisfy conflicting objectives, such as maximizing spatial and temporal resolution while minimizing light exposure. To overcome the limitations imposed by these trade-offs, post-acquisition algorithmic approaches have been proposed for resolution enhancement and image-quality improvement. Here we introduce the task-assisted generative adversarial network (TA-GAN), which incorporates an auxiliary task (for example, segmentation, localization) closely related to the observed biological nanostructure characterization. We evaluate how the TA-GAN improves generative accuracy over unassisted methods, using images acquired with different modalities such as confocal, bright-field, stimulated emission depletion and structured illumination microscopy. The TA-GAN is incorporated directly into the acquisition pipeline of the microscope to predict the nanometric content of the field of view without requiring the acquisition of a super-resolved image. This information is used to automatically select the imaging modality and regions of interest, optimizing the acquisition sequence by reducing light exposure. Data-driven microscopy methods like the TA-GAN will enable the observation of dynamic molecular processes with spatial and temporal resolutions that surpass the limits currently imposed by the trade-offs constraining super-resolution microscopy.

Keywords: Cellular neuroscience; Image processing; Machine learning; Super-resolution microscopy.


Conflict of interest statement

Competing interestsThe authors declare no competing interests.

Figures

Fig. 1
Fig. 1. The TA-GAN method.
a, Architecture of the TA-GANAx. The losses (circles) are backpropagated to the networks of the same colour: the generator (violet), the discriminator (green) and the task network (blue). DG, discriminator loss for generated images; GEN, generation loss; GAN, GAN loss; DR, discriminator loss for real images; TL, task loss. The TA-GANAx is applied to the axonal F-actin dataset using the segmentation of F-actin rings as an auxiliary task to optimize the generator. b, Representative example chosen out of 52 test images for the comparison of the TA-GANAx and algorithmic super-resolution baselines on the axonal F-actin dataset. The confocal image is the low-resolution input and the STED image is the aimed ground truth. Insets: segmentation of the axonal F-actin rings (green) predicted by the U-Netfixed-ax with the bounding boxes (white line) corresponding to the manual expert annotations. PSNR and SSIM metrics are written on the generated images. Scale bars, 1 μm. c, The TA-GANNano is trained on the simulated nanodomain dataset using the localization of nanodomains as the auxiliary task. d, Representative example chosen out of 75 test images for the comparison of the TA-GANNano with the baselines for nanodomain localization. The black circles represent the position of the nanodomains on the ground-truth datamap and the blue circles represent the nanodomains identified by an expert on images from the test set (Methods). The intensity scale is normalized for each image by its respective minimum and maximum values. Scale bars, 250 nm.
Fig. 2
Fig. 2. Dataset-specific tasks drive reliable resolution enhancement with the TA-GAN approach.
a, Two TA-GAN models designed for the synaptic protein dataset are trained using one of two auxiliary tasks: the segmentation of the protein clusters (shown) or the localization of the weighted centroids (Supplementary Fig. 6). b, Comparison between the different approaches for the characterization of synaptic cluster morphological features. Shown is the cumulative distribution of the cluster area for PSD95 (see Supplementary Fig. 7 for other features). Statistical analysis: two-sided two-sample Kolmogorov–Smirnov test for the null hypothesis that the continuous distribution underlying the results for each baseline is the same as the one underlying the STED results (***P < 0.001, not significant (NS) P > 0.05). c, Representative crop chosen from one of the nine test images for the generation of synthetic two-colour images of PSD95 and bassoon using the non-task-assisted baseline (pix2pix), the TA-GANSyn with the localization task and the TA-GANSyn with the segmentation task. Insets: localization and segmentation annotations used to train the two TA-GANSyn models. Scale bars, 1 μm. Each crop is normalized to the 98th percentile of its pixel values for better visualization of dim clusters. d, The TA-GANSA models designed for the S. aureus dataset are trained using a segmentation task with annotations requiring only the LR bright-field image or annotations requiring the HR SIM image. e, Confusion matrices for the classification of dividing and non-dividing cells on the test set of the S. aureus dataset (n = 410 cells in five images). The TA-GANSA trained with HR annotations achieves better performance in generating the boundaries between dividing bacterial cell, a morphological feature visible only with SIM microscopy, compared with pix2pix and the TA-GANSA trained with LR annotations. f, Representative crop chosen from one of the five test images of the S. aureus dataset generated with pix2pix and the TA-GANSA trained with LR and HR annotations. Insets: LR and HR annotations used to train the two TA-GANSA models. Scale bars, 1 μm. Source data
Fig. 3
Fig. 3. Domain adaptation.
a, The semantic segmentation of F-actin rings (green) and fibres (magenta) is used as the auxiliary task to train the TA-GANDend. b, Example of confocal, real STED and TA-GANDend synthetic images chosen among 26 test images. Insets: the regions identified as rings and fibres by the U-Netfixed-dend trained on real STED images. White solid line shows the border of the dendritic mask generated from the MAP2 channel, following the methods presented in ref. . c, The same semantic segmentation task is used to train the TA-CycleGAN. The reference to compute the TL is the segmentation of real fixed-cell STED images by U-Netfixed-dend. The fixed cycle (top) uses U-Netfixed-dend to encourage semantic consistency between the input fixed-cell image and the end-of-cycle reconstructed image. The live cycle (bottom) does not use a task network, enabling the use of non-annotated images from the live F-actin dataset. Once trained, the TA-CycleGAN can generate domain-adapted datasets (right). DL, discriminator loss for live-cell images; DF, discriminator loss for fixed cell images; GANL, GAN loss for live-cell images; GANF, GAN loss for fixed cell images; CYC, cycle loss; GEN, generation loss; Lrec, live reconstructed; Lgen, live generated; Frec, fixed reconstructed; Fgen, fixed generated; Livegen, generated live-cell image; Fixedgen, generated fixed cell image. d, Representative example chosen among 28 annotated live-cell STED test images for the segmentation of F-actin nanostructures. The nanostructures on the live-cell STED images (top left) are not properly segmented by the U-Netfixed-dend (bottom left). The U-NetLive is trained with synthetic images generated by the TA-CycleGAN to segment the F-actin nanostructures on real live-cell STED images. The segmentation predictions generated by the U-NetLive (bottom right) are similar to the manual expert annotations (top right). e, The semantic segmentation task is used to train the TA-GANLive. The generator of the TA-GANLive takes as input the confocal image as well as an STED subregion and a decision matrix indicating the position of the STED subregion in the FOV (Methods). f, Representative example of real and synthetic live-cell STED images of F-actin generated with TA-GANLive, chosen among the initial images from 159 imaging sequences. The annotations of both real and synthetic images are obtained with the U-NetLive. Colour bar: raw photon counts. Scale bars, 1 μm.
Fig. 4
Fig. 4. Monitoring change with the TA-GANLive.
a, Step-by-step imaging-assistance pipeline using the TA-GANLive in the live-cell acquisition loop. b, Live-cell imaging of dendritic F-actin before (initial), during (frames 1–15) and after (final) application of a stimulation solution (0 Mg2+/Gly/2.4 mM Ca2+). Shown are the confocal (red, top row), synthetic (purple, middle row) and real (orange, middle row) STED images when acquired, and corresponding segmentation masks for F-actin fibres (magenta, bottom row). The series was chosen as a representative example from a total of 72 series. Colour bars: raw photon counts. c, The DC at each time point measured between the current synthetic image and the last acquired reference STED image for the sequence shown in b. Dark grey points indicate that the last acquired real STED (used as reference) is from a previous time step and light grey points connected with a vertical dashed line indicate that a new STED is acquired at this time step, and the DC is recomputed with this new reference. d, Proportion of dendritic F-actin fibres at each time point segmented by the U-NetLive on either the real STED (orange) or the synthetic STED (purple) images. When a real STED acquisition is triggered, the proportion of fibres in both images is compared (dotted line). Initial and final reference STED images (empty orange circles) are acquired at each round. e, The DC is computed for the F-actin fibre segmentation on control sequences of two consecutive real STED images (time points t and t + 1)). The segmentation of the STEDt image is used as reference and the DC is computed with the segmentation mask on the STEDt+1 image. When a real STED image acquisition would not have been triggered by the threshold-based approach, the DC between the segmentation masks of the two real STED is higher. n = 60 control sequences of two consecutive confocal–STED pairs. Violin plots show the minimum, maximum and mean. Statistical analysis: two-sided Mann–Whitney U test for the null hypothesis that the two distributions are the same (***P = 0.0004). Scale bars, 1 μm. Source data
Fig. 5
Fig. 5. Monitoring prediction variability with the TA-GANLive.
a, Live-cell imaging of dendritic F-actin using the same stimulation as in Fig. 4. The TA-GANLive variability maps are shown on the bottom row. The series was chosen as a representative example from a total of 87 series. Colour bars: raw photon counts. b, Example histograms of the pixel-level positive counts over the segmentation of ten synthetic images (top) and high- and low-variability pooling. On the left, the VS is below 0.5 (dashed line, no trigger); on the right, the VS is above 0.5 (STED triggered). c, The VS at each time point for the sequence shown in a. When the VS is above 0.5, the number of high-variability pixels exceeds the number of low-variability pixels (b, VS > 0.5, right), which triggers the acquisition of a real STED image (orange circles). d, The DC is computed between the segmentation masks of synthetic and real STED image from the same time point (n = 168 pairs of real and synthetic images). When an STED acquisition would have been triggered using the VS criterion, the DC between the two corresponding images is lower. Violin plots show the minimum, maximum and mean. Statistical analysis: two-sided Mann–Whitney U test for the null hypothesis that the two distributions are the same (*P = 0.014). Scale bars, 1 μm. Source data
Extended Data Fig. 1
Extended Data Fig. 1. Generation accuracy of TA-GANAx. compared with resolution enhancement baselines.
Comparison of TA-GANAx. with the resolution enhancement baselines using three image evaluation metrics : 1) Mean squared error (MSE), 2) Structural Similarity Index Measure (SSIM), 3) Peak Signal to Noise Ratio (PSNR), and two segmentation evaluation metrics : 1) Dice Coefficient (DC), 2) Intersection over Union (IOU). For the image metrics, images are normalized to 0-1 using min-max normalization. The segmentation predictions are computed with the U-Netfixedax. on the synthetic images generated with each approach. Metrics are computed using the real STED image and its segmentation by U-Netfixedax. as the reference. The score for DC and IOU is 1 if both the reference and prediction are empty. The performance of the TA-GAN is significantly better than all baseline for both segmentation metrics. For the image similarity metrics, TA-GAN performs significantly better than CARE and RCAN, and is similar to ESRGAN and pix2pix. Statistical analysis: Mann-Whitney U test for the two-sided hypothesis that the distribution underlying the results for each baseline is the same as the distribution underlying the TA-GAN results. Violin plots show the minimum, maximum and mean of each distribution.(*** p < 0.001, n.s. p > 0.05). n=52 independent images. Source data
Extended Data Fig. 2
Extended Data Fig. 2. U-NetLive example results for the segmentation of F-actin nanostructures in live-cell STED images.
Segmentation predictions by U-Netfixeddend. and U-NetLive on 8 representative images chosen from 28 annotated live-cell STED test images. Annotations were created for testing purposes and were not used for training U-NetLive. The U-NetLive trained only on synthetic images from the Translated F-actin dataset succeeds in segmenting F-actin nanostructures on real STED images. Scale bars: 1 μm.
Extended Data Fig. 3
Extended Data Fig. 3. Comparison of photobleaching effects for consecutive confocal and STED acquisitions.
Normalized fluorescence intensity after 15 confocal acquisitions (red, N=45 regions) and, associated synthetic STED signal (purple, N=45 regions) over the central ROI (300 × 300 pixels) in comparison to acquisitions using the STED modality at each frame (orange, N=45 regions). Dots show the average and shaded regions cover the standard deviation. The TA-GANLive predictions compensate for the fluorescence intensity decrease in the synthetic STED images. The 15th consecutive STED image has 36 ± 12 % of the initial STED image intensity and 92 ± 16 % for the sequence of confocal images for the corresponding TA-GAN generated images. Source data
Extended Data Fig. 4
Extended Data Fig. 4. Observation of F-actin remodeling in living cells.
a, Kernel density estimate of the F-actin fibres and rings dendritic area distribution for after 30 minutes in a solution reducing neuronal activity (high Mg2+/low Ca2+, blue) or following a stimulation (0Mg2+/Glu/Ca2+, from t = 1-15min, red). b, Bootstrapped distributions of the results shown in a,. Shown are the regions comprising 95%, 99% and 99.9% of the data point distribution. Following the 0Mg2+/Glu/Ca2+ stimulation, we observe a small increase in the proportion of F-actin fibres and a decrease in the proportion of rings. High Mg2+ N=21, 0Mg2+/Glu/Ca2+ N=21. Source data
Extended Data Fig. 5
Extended Data Fig. 5. Graphical abstract.
The proposed model has two general use cases: TA-GAN, for paired datasets, and TA-CycleGAN, for unpaired datasets. Top-left: The TA-GAN uses a task adapted to each dataset for accurate resolution enhancement. The generation loss (GEN circle) is computed from the comparison between the output of the task network for the synthetic high-resolution image (THR) and the labels obtained from the ground truth image (LHR). The loss is backpropagated to the generator (dashed arrow). Middle-left: The generated synthetic STED images are used to analyze the distribution of nanostructures that were not resolved in the original confocal image. Top-right: Domain adaptation using the TA-CycleGAN enables the generation of large annotated synthetic image datasets from a new domain, even if labels are only available in one domain. The generation loss (GEN circle) is computed from the comparison between the output of the task network for the image and the synthetic version (TA) and the labels obtained from the input domain A image (LA). The loss is backpropagated to the generator (dashed arrow).Middle-right: Labeled datasets from domain A (e.g fixed cells) are adapted to the unlabeled domain B (e.g live cells) to obtain a labeled dataset from domain B, which can be used to train a super-resolution TA-GAN. Bottom: Both models can be used for microscopy acquisition guidance. The TA-GAN model, trained using a TA-CycleGAN generated dataset, can automatically identify regions and frames of interest from the low-resolution images. Automatic switching between low- and high-resolution imaging modalities is guided by the TA-GANLive predictions. Scale bars: 1 μm.

References

    1. Sahl S, Hell S, Jakobs S. Fluorescence nanoscopy in cell biology. Nat. Rev. Mol. Cell Biol. 2017;18:685–701. doi: 10.1038/nrm.2017.71. - DOI - PubMed
    1. Hell S, Wichmann J. Breaking the diffraction resolution limit by stimulated emission: stimulated-emission-depletion fluorescence microscopy. Optics Lett. 1994;19:780–782. doi: 10.1364/OL.19.000780. - DOI - PubMed
    1. Durand A, et al. A machine learning approach for online automated optimization of super-resolution optical microscopy. Nat. Commun. 2018;9:5247. doi: 10.1038/s41467-018-07668-y. - DOI - PMC - PubMed
    1. Laissue P, Alghamdi R, Tomancak P, Reynaud E, Shroff H. Assessing phototoxicity in live fluorescence imaging. Nat. Methods. 2017;14:657–661. doi: 10.1038/nmeth.4344. - DOI - PubMed
    1. Fang L, et al. Deep learning-based point-scanning super-resolution imaging. Nat. Methods. 2021;18:406–416. doi: 10.1038/s41592-021-01080-z. - DOI - PMC - PubMed