. 2023 Sep 4;155(9):e202213263.
doi: 10.1085/jgp.202213263. Epub 2023 Aug 24.

Mitochondrial morphology governs ATP production rate

Affiliations

Mitochondrial morphology governs ATP production rate

Guadalupe C Garcia et al. J Gen Physiol. .

Abstract

Life is based on energy conversion. In particular, in the nervous system, significant amounts of energy are needed to maintain synaptic transmission and homeostasis. To a large extent, neurons depend on oxidative phosphorylation in mitochondria to meet their high energy demand. For a comprehensive understanding of the metabolic demands in neuronal signaling, accurate models of ATP production in mitochondria are required. Here, we present a thermodynamically consistent model of ATP production in mitochondria based on previous work. The significant improvement of the model is that the reaction rate constants are set such that detailed balance is satisfied. Moreover, using thermodynamic considerations, the dependence of the reaction rate constants on membrane potential, pH, and substrate concentrations are explicitly provided. These constraints assure that the model is physically plausible. Furthermore, we explore different parameter regimes to understand in which conditions ATP production or its export are the limiting steps in making ATP available in the cytosol. The outcomes reveal that, under the conditions used in our simulations, ATP production is the limiting step and not its export. Finally, we performed spatial simulations with nine 3-D realistic mitochondrial reconstructions and linked the ATP production rate in the cytosol with morphological features of the organelles.


Figures

Figure 1.
Figure 1.
Schematic representation of a mitochondrion with its functional components and compartments. The OM is the external lipid bilayer that interfaces with the cytosol. The IM encapsulates the matrix and is composed of two functionally distinct regions, the inner boundary membrane (IBM; in close opposition to the OM) and the CM. The CM is the place where the protein complexes from the electron-transport chain (ETC) reside. At the apex of the CM and along the tubular cristae, ATP synthases are allocated. Through these protein complexes, ATP is synthesized in the matrix. ATP is further transported from the matrix through ANTs to the intermembrane space (IMS)—the space between the two membranes—to finally cross the OM at the VDAC into the cytosol.
Figure 2.
Figure 2.
Kinetic diagram of the modules of the mitochondria model. (A–C) Kinetic diagram of the ATP synthase model (Pietrobon and Caplan, 1985). (A) The model consists of six states, representing different protein configurations. ATP molecules are represented as T, ADP molecules as D, phosphate as Pi, ATP synthase as E, and H+ as protons. The model considers the binding of ATP and ADP from the matrix and the IMS. (B) Each state is associated with a number from 1 to 6. A clockwise cycle, starting from state 6 corresponds to the binding of three protons from the IMS (6 → 5), followed by their transport to the matrix (5 → 4) and subsequent binding of ADP and Pi (4 → 3), to the synthesis of ATP (3 → 2), and unbinding of three protons in the matrix (2 → 1). Each transition has an associated rate constant kij. The list of all the reactions is in Table 1 and the list of parameters is in Table 2. (C) The cycles are considered positive in the counterclockwise direction and named a, b, and c. (D) Membrane potential considered in the ATP synthase model. ΔΨ = Ψ4 − Ψ1 is the electrical potential difference between the matrix and IMS (or cytosol), ΔΨm is the electrical potential difference across the membrane, ΔΨbin and ΔΨbex are the phase-boundary potentials. (E–G) Kinetic diagram of the ANT model. (E) The model consists of 11 states, L represents the free protein, and YLX is a triple molecular state with one X molecule bound from the matrix side and one Y molecule bound from the IMS. X and Y represent ATP or ADP molecules, respectively. The model has been adapted from previous work (Metelkin et al., 2006). (F) In this representation, the binding and unbinding of ATP and ADP are explicitly shown, molecules from the IMS side are in green, and those from the matrix side are in purple. (G) The cycles are considered positive going from the matrix to the IMS.
Figure S1.
Figure S1.
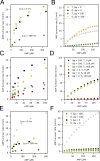
Qualitative reproduction of experimental fluxes from published work (Krämer and Klingenberg, 1982). (A and B) ATP uptake rate vs. external ATP concentration for a membrane potential (ΔΨ) of 0 and 180 mV in yellow and green, respectively. Black and grey points describe the ADP uptake rate vs. external ADP concentration for a membrane potential of 0 and 180 mV. (A and B) Transformed data from Krämer and Klingenberg (1982) (A; we followed the same approach as in Metelkin et al. [2006]), and our simulations (B), the flux was computed calculating an average over 30 s. ANP stands for ATP for the yellow and green points, and for ADP for black and grey points. (C and D) ADP uptake rate vs. external ADP concentration for membrane potential (ΔΨ) of 180 mV and ATP concentrations outside the liposomes (To) of 0, 100, 400 µM shown in black, light grey, and yellow points, respectively. Green, grey, and red points describe the dependency with the membrane potential of 0 mV and concentrations of ATP concentrations outside the liposomes (To) of 0, 20, 100 µM, respectively. The concentrations of ADP and ATP inside the liposomes were 5 mM. (E) ATP uptake rate vs. ATP concentration, yellow and green points for a membrane potential (ΔΨ) of 0 and 180 mV, respectively, and ADP concentration equal to the ATP concentration. (F) ADP uptake rate vs. ADP concentration, black and grey points for a membrane potential of 0 and 180 mV, respectively, and ATP concentration equal to the ADP concentration.
Figure S2.
Figure S2.
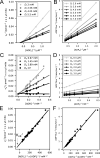
Qualitative reproduction of the experimental results from published work (Duyckaerts et al., 1980). (A and B) Reciprocal of the initial rate of ADP exchange as a function of the reciprocal of the external ADP concentration. The initial rate was measured for 3 external-ADP concentrations and 11 internal-ADP concentrations (only four are shown). The lines were calculated by the method of least squares. Experimental data reproduced from (A) Duyckaerts et al. (1980) and (B) our simulations. (C and D) Reciprocal of the initial rate of ADP exchange as a function of the reciprocal of the internal-ADP concentration. The initial rate was measured for 3 external ADP concentrations and 11 internal-ADP concentrations. Data reproduced from (C) Duyckaerts et al. (1980) and (D) our simulations. (E and F) Reciprocal of the initial rate of ADP exchange as a function of the reciprocal of [ADP]i[ADP]o. Data reproduced from (E) Duyckaerts et al. (1980), the parameter value KAB is 26.5 × 10⁻³ mM2, and (F) our simulations; our estimation of KAB from our simulations is 27.06 × 10⁻³ mM2.
Figure S3.
Figure S3.
Comparison with ANT model developed by Bohnensack (1982). (A) ATP flux dependence on the ATP to ADP ratio on the matrix. (B) ATP flux dependence on the ATP to ADP ratio in the IMS at a constant membrane potential of 180 mV.
Figure S4.
Figure S4.
ATP production rate in the cytosol for all reconstructions, considering the same number of ATP synthases (204). The first five reconstructions belong to the globular set and the last four to the elongated one. On average the ATP production rate is also higher for the globular set under these conditions.
Figure S5.
Figure S5.
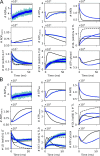
Comparison to our already-published model (Garcia et al., 2019). (A and B) Average traces of the number of molecules in the different compartments (in blue), a single trace (in cyan), and results of the ODEs (in black) on the left (A), results of our current version of the model and on the right (B) results for the same conditions for the old version of the model (Garcia et al., 2019), for reconstruction #1.
Figure 3.
Figure 3.
ATP synthase steady-state flux analysis. We analyzed the dependence on the fluxes through ATP synthases at constant concentrations of adenine nucleotides in the different compartments. We analyzed how the flux changes with the driving forces of the cycles (Eq. 26). (A) ATP net flux through ATP synthases for different concentrations of ADP in the matrix and different membrane potentials. A counterclockwise cycle is defined as positive, favoring ATP hydrolysis. For membrane potentials above 160 mV and larger ADPm concentrations, ATP is synthesized. (B) ATP net flux through ATP synthases for different pH and membrane potentials (for fixed concentrations of adenine nucleotides).
Figure 4.
Figure 4.
ANT steady-state flux analysis. We analyzed the dependence on the fluxes through ANTs at constant concentrations of adenine nucleotides in the different compartments and at a constant membrane potential of 180 mV. We analyzed how the flux changes with the driving forces of the cycles (Eq. 33). (A) ADPi − ATPm net flux through ANTs for different ATP to ADP ratios in the matrix. (B) ADPi − ATPm net flux through ANTs for different ratios of ATP and ADP in the IMS.
Figure 5.
Figure 5.
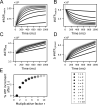
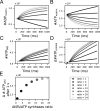
Parameter exploration for the ANT model at a constant membrane potential of 180 mV. We employed the ODE model to explore the impact of faster ANTs on ATP production, and for that, we changed the rate constants of the ANTs. We multiplied the rate constants kp, kcp, kt, and kd by a factor of r, where r takes values between 1 and 10. The ADP concentration in the IMS was kept constant in these simulations. (A–C) Number of molecules measured over time in the different compartments. (D) Number of ATP molecules measured over time in the cytosol relative to the initial number of molecules. (E) Percentage increment of the number of ATP molecules in the cytosol after 1 s relative to the slowest ones (r = 1), for all ANTs considered from the slowest (r = 1) ones to the fastest ones (r = 10).
Figure 6.
Figure 6.
What is the limiting factor, export through ANTs or production of ATP through ATP synthases? We changed the ratio of ANTs to ATP synthases to answer this question and used the ODE model to estimate the impact on ATP production, for a constant concentration of ADP in the IMS and a constant membrane potential of 180 mV. (A–C) Number of molecules measured over time in the different compartments. (D) Number of ATP molecules measured over time in the cytosol relative to the initial number. (E) Number of ATP molecules in the cytosol after 1 s relative to the initial number of molecules, for different ratios of ANTs/ATP synthases. Ratios go from 1 to 24, the number of ATP synthases is kept constant, and the number of ANTs increases (fast ANTs were considered r = 10).
Figure 7.
Figure 7.
Effect of the number of VDACs on ATP efflux to the cytosol at a constant membrane potential of 180 mV. (A–C) Number of molecules measured over time in different compartments. (D) Number of ATP molecules measured over time in the cytosol relative to the initial concentration. (E) Percentage increase of ATP in the cytosol after 1 s for different numbers of VDACs in the OM. The number of VDACs goes from 100 to 1,500 (in these simulations fast ANTs were considered, r = 10).
Figure 8.
Figure 8.
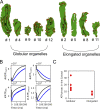
Spatial simulations: linking structure to function. (A) CM of the nine mitochondrial reconstructions considered with ATP synthases (in red) distributed in the areas of high curvature. (B) Comparison of the ODEs simulations with the average traces of the spatial simulations for elongated mitochondrial reconstruction #2. (C) ATP production rate in the cytosol for all reconstructions grouped accordingly to the structural features.

Similar articles

Cited by

References

    1. Acehan, D., Malhotra A., Xu Y., Ren M., Stokes D.L., and Schlame M.. 2011. Cardiolipin affects the supramolecular organization of ATP synthase in mitochondria. Biophys. J. 100:2184–2192. 10.1016/j.bpj.2011.03.031 - DOI - PMC - PubMed
    1. Afzal, N., Lederer W.J., Jafri M.S., and Mannella C.A.. 2021. Effect of crista morphology on mitochondrial ATP output: A computational study. Curr. Res. Physiol. 4:163–176. 10.1016/j.crphys.2021.03.005 - DOI - PMC - PubMed
    1. Alberts, B., Roberts K., Lewis J., Bray D., Hopkin K., Johnson A.D., Walter P., and Raff M.. 2015. Essential Cell Biology. Fourth edition. Garland Science, New York City.
    1. Austin, J., and Aprille J.R.. 1984. Carboxyatractyloside-insensitive influx and efflux of adenine nucleotides in rat liver mitochondria. J. Biol. Chem. 259:154–160. 10.1016/S0021-9258(17)43634-9 - DOI - PubMed
    1. Balbir, T. 2007. A model of mitochondrial calcium induced calcium release. PhD thesis. Doctoral dissertation The Ohio State University, Columbus, OH. 134 pp.

Publication types

Substances