

Novel QTL for Lateral Root Density and Length Improve Phosphorus Uptake in Rice (Oryza sativa L.)
- PMID: 37615779
- PMCID: PMC10449758
- DOI: 10.1186/s12284-023-00654-z
Novel QTL for Lateral Root Density and Length Improve Phosphorus Uptake in Rice (Oryza sativa L.)
Abstract
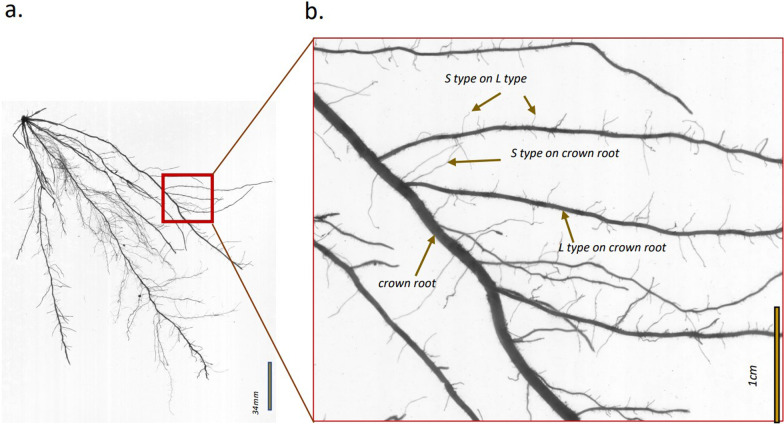
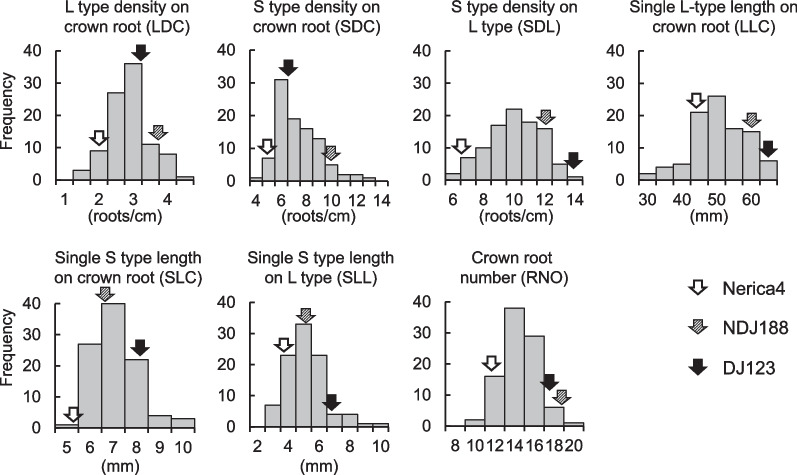
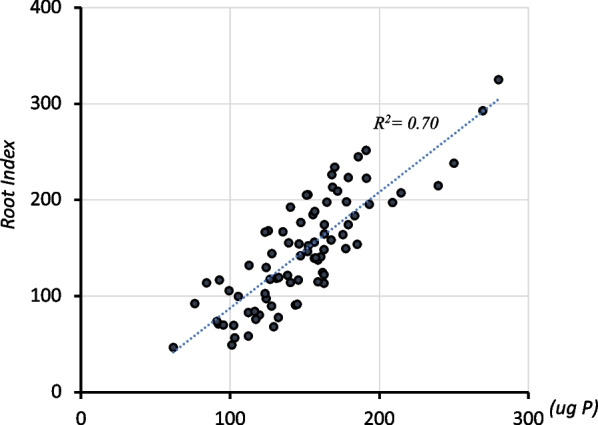
The rice root system consists of two types of lateral roots, indeterminate larger L-types capable of further branching, and determinate, short, unbranched S-types. L-type laterals correspond to the typical lateral roots of cereals whereas S-type laterals are unique to rice. Both types contribute to nutrient and water uptake and genotypic variation for density and length of these laterals could be exploited in rice improvement to enhance adaptations to nutrient and water-limited environments. Our objectives were to determine how best to screen for lateral root density and length and to identify markers linked to genotypic variation for these traits. Using different growing media showed that screening in nutrient solution exposed genotypic variation for S-type and L-type density, but only the lateral roots of soil-grown plants varied for their lengths. A QTL mapping population developed from parents contrasting for lateral root traits was grown in a low-P field, roots were sampled, scanned and density and length of lateral roots measured. One QTL each was detected for L-type density (LDC), S-type density on crown root (SDC), S-type density on L-type (SDL), S-type length on L-type (SLL), and crown root number (RNO). The QTL for LDC on chromosome 5 had a major effect, accounting for 46% of the phenotypic variation. This strong positive effect was confirmed in additional field experiments, showing that lines with the donor parent allele at qLDC5 had 50% higher LDC. Investigating the contribution of lateral root traits to P uptake using stepwise regressions indicated LDC and RNO were most influential, followed by SDL. Simulating effects of root trait differences conferred by the main QTL in a P uptake model confirmed that qLDC5 was most effective in improving P uptake followed by qRNO9 for RNO and qSDL9 for S-type lateral density on L-type laterals. Pyramiding qLDC5 with qRNO9 and qSDL9 would be possible given that trade-offs between traits were not detected. Phenotypic selection for the RNO trait during variety development would be feasible, however, the costs of doing so reliably for lateral root density traits is prohibitive and markers identified here therefore provide the first opportunity to incorporate such traits into a breeding program.
Keywords: Crown root; L-type lateral roots; P uptake simulation; Root system architecture; S-type lateral roots.
© 2023. Springer Science+Business Media, LLC, part of Springer Nature.
Conflict of interest statement
The authors declare that they have no competing interests.
Figures

Similar articles
-
A functional-structural model of upland rice root systems reveals the importance of laterals and growing root tips for phosphate uptake from wet and dry soils.Ann Bot. 2020 Sep 14;126(4):789-806. doi: 10.1093/aob/mcaa120. Ann Bot. 2020. PMID: 32597468 Free PMC article.
-
Cost-Benefit Analysis of the Upland-Rice Root Architecture in Relation to Phosphate: 3D Simulations Highlight the Importance of S-Type Lateral Roots for Reducing the Pay-Off Time.Front Plant Sci. 2021 Mar 12;12:641835. doi: 10.3389/fpls.2021.641835. eCollection 2021. Front Plant Sci. 2021. PMID: 33777076 Free PMC article.
-
Enhancing phosphorus and zinc acquisition efficiency in rice: a critical review of root traits and their potential utility in rice breeding.Ann Bot. 2013 Jul;112(2):331-45. doi: 10.1093/aob/mcs217. Epub 2012 Oct 15. Ann Bot. 2013. PMID: 23071218 Free PMC article. Review.
-
Root hair formation in rice (Oryza sativa L.) differs between root types and is altered in artificial growth conditions.J Exp Bot. 2016 Jun;67(12):3699-708. doi: 10.1093/jxb/erw115. Epub 2016 Mar 14. J Exp Bot. 2016. PMID: 26976815
-
Molecular Mechanisms of Root Development in Rice.Rice (N Y). 2019 Jan 10;12(1):1. doi: 10.1186/s12284-018-0262-x. Rice (N Y). 2019. PMID: 30631971 Free PMC article. Review.
Cited by
-
Characterization of quantitative trait loci from DJ123 (aus) independently affecting panicle structure traits in indica rice cultivar IR64.Mol Breed. 2024 Sep 2;44(9):57. doi: 10.1007/s11032-024-01494-5. eCollection 2024 Sep. Mol Breed. 2024. PMID: 39228865 Free PMC article.
-
Rice breeding for low input agriculture.Front Plant Sci. 2024 Jun 21;15:1408356. doi: 10.3389/fpls.2024.1408356. eCollection 2024. Front Plant Sci. 2024. PMID: 38974981 Free PMC article. Review.
-
Genome-Wide Association Analyses Identify Hydrogen Peroxide-Responsive Loci in Wheat Diversity.Plant Direct. 2025 Apr 17;9(4):e70067. doi: 10.1002/pld3.70067. eCollection 2025 Apr. Plant Direct. 2025. PMID: 40248189 Free PMC article.
-
Transcriptional corepressor OsTPR1 regulates tillering and lateral root development in rice.Sci Rep. 2025 Jul 21;15(1):26430. doi: 10.1038/s41598-025-10224-6. Sci Rep. 2025. PMID: 40691201 Free PMC article.
-
Fertile interspecific diploid hybrids between the Asian and African rice species facilitated by tetraploidization and its reduction.Theor Appl Genet. 2025 Jun 27;138(7):161. doi: 10.1007/s00122-025-04901-3. Theor Appl Genet. 2025. PMID: 40576682 Free PMC article.
References
-
- Ali ML, Pathan MS, Zhang J, Bai G, Sarkarung S, Nguyen HT. Mapping QTLs for root traits in a recombinant inbred population from two indica ecotypes in rice. Theor Appl Genet. 2000;101:756–766. doi: 10.1007/s001220051541. - DOI
Grants and funding
LinkOut - more resources
Full Text Sources
Miscellaneous
