. 2023 Nov 6;220(11):e20221388.
doi: 10.1084/jem.20221388. Epub 2023 Aug 24.

Trained immunity of alveolar macrophages enhances injury resolution via KLF4-MERTK-mediated efferocytosis

Affiliations

Trained immunity of alveolar macrophages enhances injury resolution via KLF4-MERTK-mediated efferocytosis

Sreeparna Chakraborty et al. J Exp Med. .

Abstract

Recent studies suggest that training of innate immune cells such as tissue-resident macrophages by repeated noxious stimuli can heighten host defense responses. However, it remains unclear whether trained immunity of tissue-resident macrophages also enhances injury resolution to counterbalance the heightened inflammatory responses. Here, we studied lung-resident alveolar macrophages (AMs) prechallenged with either the bacterial endotoxin or with Pseudomonas aeruginosa and observed that these trained AMs showed greater resilience to pathogen-induced cell death. Transcriptomic analysis and functional assays showed greater capacity of trained AMs for efferocytosis of cellular debris and injury resolution. Single-cell high-dimensional mass cytometry analysis and lineage tracing demonstrated that training induces an expansion of a MERTKhiMarcohiCD163+F4/80low lung-resident AM subset with a proresolving phenotype. Reprogrammed AMs upregulated expression of the efferocytosis receptor MERTK mediated by the transcription factor KLF4. Adoptive transfer of these trained AMs restricted inflammatory lung injury in recipient mice exposed to lethal P. aeruginosa. Thus, our study has identified a subset of tissue-resident trained macrophages that prevent hyperinflammation and restore tissue homeostasis following repeated pathogen challenges.


Conflict of interest statement

Disclosures: The authors declare no competing interests exist.

Figures

None
Graphical abstract
Figure 1.
Figure 1.
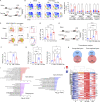
Phenotypic characteristics of AMs generated via repeated LPS challenges. (A) Schematic showing immune training in the inhaled LPS acute lung injury mouse model. (B) tSNE map derived from CyTOF analysis of lung CD45+ cells from naïve and trained mice at baseline (i.e., naïve baseline and 7 d-LPS after recovery baseline) and the acute 72-h LPS injury time points (i.e., 72 h and 7 d + 72 h). CD64 (upper panel) and F4/80 (lower panel) expressions are highlighted by colored gradient expression; three macrophage clusters (i.e., Mac1–3) and one monocyte cluster (i.e., mono) were manually gated (left panel). The differentially expressed markers for individual clusters are shown in the figure. In the right panel, the graph shows cluster abundance (% of total). Data were collected from four independent experiments, and the cells were combined from three mice per group with n = 9–12 samples and were analyzed by ANOVA with Bonferroni’s multiple comparisons test. (C) Flow cytometric plot shows CD45+CD64+Gr1CD11c+CD11b−/loSiglecF+ macrophage populations in basal conditions and 72 h after LPS in naïve and prechallenged mice. (D) Absolute number of CD45+CD64+Gr1CD11c+CD11blo/−SiglecF+ cells per lung was determined by flow cytometry. Data were collected from six independent experiments, (n = 6–8) and were analyzed by ANOVA with Bonferroni’s multiple comparisons test. (E) Schematic of long-term immune training (left panel). The right panel shows the absolute number of AM (CD45+CD64+Gr1CD11c+CD11blo/−SiglecF+) within the lung 72 h after LPS in naïve and long-term (28 d)-trained mice. Data were collected from three independent experiments (n = 3–5) and were analyzed by ANOVA with Bonferroni’s multiple comparisons test. (F) The graph shows the wet-to-dry lung weight ratio at the mentioned time points in naïve and trained mice. Data were collected from three independent experiments (n = 3–4) and were analyzed by ANOVA with Bonferroni’s multiple comparisons test. (G) The percentage of neutrophil (CD45+CD11b+Ly6g+) within CD45+ cells in the lung of naïve and prechallenged mice at basal and 72 h after LPS at 7-d intervals (upper panel) and 28-d intervals (lower panel) were shown. Data were collected from six independent experiments (n = 3–6) and were analyzed by ANOVA with Bonferroni’s multiple comparisons test. (H) Venn diagram represents shared upregulated and downregulated gene numbers between the homeostasis and post-LPS conditions in trained AMs as compared to naïve ones. (I) The enriched GO terms from upregulated genes between trained and naïve AMs in post-injury conditions. (J) Heatmap representation of differentially expressed genes, identified by comparing trained AMs to naïve AMs at homeostasis and 72 h after LPS challenge. The blue-to-white-to-red gradient represents the increased expression of the genes with blue representing minimal expression and red representing high expression. Data were collected from three independent experiments, and the cells were combined from two mice per group with n = 6 samples. Graphs show mean ± SD, with each dot representing an individual mouse data point. *P < 0.05, **P < 0.01, ***P < 0.001, ****P < 0.0001.
Figure S1.
Figure S1.
Phenotypic characteristics of in vivo generated trained AM. (A) The graph shows the relative mRNA expression of TNFα, Il-1β, and IL-6 in digested lung tissue from naïve and 7 d after LPS–challenged trained mice. Data were collected from three independent experiments (n = 3) and were analyzed by ANOVA with Bonferroni’s multiple comparisons test. (B) The flow cytometry quantification of percent neutrophil in BAL in naïve and trained mice at basal (C and 7 d) and 72 h after LPS challenge (72 h, 7 d + 72 h). Data were collected from three independent experiments (n = 3–6) and were analyzed by ANOVA with Bonferroni’s multiple comparisons test. Graphs show mean ± SD with each dot representing an individual mouse data. ***P < 0.001. (C) The gating strategy for CyTOF analysis of CD45+ cells in mice lungs. (D) Representative tSNE plots were generated by mass cytometry of 50,000 lung cells isolated from naïve mice following 72 h after LPS challenge by using 17 metal-labeled antibodies to different surface markers. The colored graded expression of markers are as follows: (i) CD4; (ii) CD8; (iii) CD19; (iv) NK1.1; (v) Ly6G; (vi) Ly6c; (vii) CD11c, MHCII, CD64, CD24, CX3CR1; (viii) SiglecF, CD11b, CD64 to gate the cell population CD4, CD8, B cell, NK cell, neutrophil, monocytes, DC, and eosinophil, respectively. (E) tSNE plots show the metaclusters (MC) generated by the unsupervised clustering algorithm FlowSOM, from 50,000 lung cells isolated from naïve and trained mice at the basal condition and 72 h after LPS challenge by using aforementioned 17 metal-labeled antibodies. (F) The tSNE plot shows gated major immune subsets identified above, and the graph represents the cluster abundance (% total) of different immune cells subpopulations other than macrophages. (G) The tSNE plots shows the gradient expression of SiglecF, CD11c, and CD11b in gated Mac1–3 clusters of naïve and trained mice lungs at 72 h after LPS challenge. (H) In the upper panel, tSNE plots show the unsupervised clustering algorithm FlowSOM metaclusters overlap with Mac1–3 cluster generated by the viSNE in naïve and trained mice (72 h after LPS). In the bottom panel, heatmaps show expression of SiglecF, CD11c, CD11b, and CX3CR1 markers in the different clusters of macrophages in naïve and trained mice at basal (C and 7 d) and 72 h after LPS challenge (72 h and 7 d + 72 h). For above mentioned CyTOF experiments, the representative plots were generated with cells from n = 3 mice per group.
Figure S2.
Figure S2.
AM dynamics in naïve vs. trained LPS challenged mice. (A) Flow cytometry gating strategy for analysis of lung macrophages. (B) The representative flow cytometry plots show the dynamic changes in the phenotypic profile of AM at different stages of injury. Red lines mark the position of CD11c+CD11b naïve AM. In the right panel, the histogram overlay shows the SiglecF expression within CD45+CD64+Gr1CD11bloCD11c+ gated population in the above condition. (C) The graph represents the percentage of AMs (CD45+CD64+Gr1CD11c+CD11blo/−SiglecF+) within the total lung macrophage (CD45+CD64+Gr1 cells pre-gated) population at basal and different stages of after LPS challenge. Data were collected from eight independent experiments (n = 5–20) and were analyzed by ANOVA with Bonferroni’s multiple comparisons test. (D) The graph shows the absolute numbers of IMs (CD45+CD64+Gr1CD11cCD11b+SiglecF) in naïve and trained mice at basal (C and 7 d) and 72 h after LPS challenge condition (72 h, 7 d + 72 h). Data were collected from six independent experiments (n = 4–7) and were analyzed by ANOVA with Bonferroni’s multiple comparisons test. (E) The percentage of AM in BAL was analyzed by flow cytometry. Data were collected from six independent experiments (n = 7–9) and were analyzed by ANOVA with Bonferroni’s multiple comparisons test. (F) The flow cytometry plots show the BrdU positivity of naïve and trained AMs (CD45+CD64+CD11b−/loCD11c+SiglecF+) at basal (C and 7 d) conditions. (G) The Ki67 positivity of naïve and trained AMs at basal and 72 h after LPS was analyzed and quantified by flow cytometry. Data were collected from three independent experiments (n = 3) and were analyzed by ANOVA with Bonferroni’s multiple comparisons test. (H) In the upper panel, representative flow cytometry plots show the percent CX3CR1 positivity within lung macrophages (CD45+CD64+ pre-gated) cells. Proportion of IM (CD11b+SiglecF−/lo) and AM (CD11bSiglecF+) within the CX3CR1-tdTomato+ cells was shown in the bottom panel. (I) The flow cytometry dot plot shows circulating monocytes (CD115+CD11b+) within the CD45+Ly6GCD11b+ pre-gated population in untreated and i.v. clodronate liposome injected mice (left panel) and analyzed (right panel). Data were collected from three independent experiments (n = 3) and were analyzed by unpaired t test. (J) The graphs show the delta CT values of the respective mRNA expression in naïve and trained AMs to show overall mRNA expression levels. PPAI (peptidylprolyl isomerase A) has been used as the internal control in qPCR. Data were collected from three independent experiments (n = 3–4). Graphs show mean ± SD with each dot representing an individual mouse data. *P < 0.05, **P < 0.01, ****P < 0.0001.
Figure 2.
Figure 2.
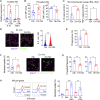
Increased resilience of trained tissue-resident AMs following repeated inflammatory challenges. (A) Flow cytometry plot shows AM proliferation by quantifying BrdU uptake within the AM population (CD45+CD64+CD11c+CD11blo/−SiglecF+ gated) in naïve and trained mice 72 h after LPS (left panel). The right panel shows quantification of percent BrdU-positive AM within all lung macrophages (CD45+CD64+ gated). Data were collected from four independent experiments (n = 5) and analyzed by unpaired t test. (B) Schematic representation of lineage-tracing monocyte-derived AM after injury. (C) Graph in the left panel shows the percentage of total CX3CR1+ cells within CD45+ gated myeloid cells in naïve and prechallenged mice lungs at baseline condition and 72 h after LPS. In the right panel, the percent CX3CR1 positivity among CD45+CD64+CD11b+SiglecF (IM) and CD45+CD64+CD11b−/loSiglecF+ (AM) gated populations was determined by flow cytometry. Data were collected from five independent experiments (n = 3–7) and were analyzed by ANOVA with Bonferroni’s multiple comparisons test. (D) Schematic representation of clodronate liposome delivery in naïve and prechallenged mice. (E) Graph shows percentage of AM within all lung macrophages (CD45+CD64+Gr1pre-gated) in i.v. clodronate untreated or treated mice. Data were collected from three independent experiments (n = 3–5) and were analyzed by ANOVA with Bonferroni’s multiple comparisons test. (F) The schematic shows the training of CCR2−/− mice by successive LPS challenges (left panel). In the right panel, the absolute number of AMs (CD45+CD64+Gr1CD11b−/loSiglecF+) was determined. Data were collected from four independent experiments (n = 4–6) and were analyzed by ANOVA with Bonferroni’s multiple comparisons test. (G) The percentage of neutrophils in CCR2−/− mice in basal conditions as well as 72 h after LPS challenge was determined. Data were collected from four independent experiments (n = 4–6) and were analyzed by ANOVA with Bonferroni’s multiple comparisons test. (H) Flow cytometric plot shows CD45+CD64+Gr1CD11cCD11b+/loSiglecF+ macrophage populations at 24 h after LPS in naïve and prechallenged mice (left panel). Absolute number of CD45+CD64+Gr1CD11c+CD11blo/−SiglecF+ cells per lung (7 and 28 d interval training) was determined (right panel). Data were collected from six independent experiments (n = 3–5). Data were collected from four independent experiments (n = 4–6) and were analyzed by ANOVA with Bonferroni’s multiple comparisons test. (I) Graph shows percentage of annexin V positivity within AM (CD45+CD64+Gr1CD11c+CD11blo/−SiglecF+ gated) at naïve and 24 h after LPS in naïve and trained mice. Data were collected from six independent experiments (n = 3–7) and were analyzed by ANOVA with Bonferroni’s multiple comparisons test. (J) The percentages of active caspase-3 positivity within gated AMs in the above-mentioned conditions were determined by flow cytometry. Data were collected from three independent experiments (n = 3–4) and were analyzed by ANOVA with Bonferroni’s multiple comparisons test. (K) Relative mRNA expression of pro-apoptotic (Bax) and anti-apoptotic (MCL1) genes in flow-sorted naïve, untrained, and trained AMs at 24 h after LPS injury was analyzed by qPCR. Data were collected from three independent experiments (n = 3–4) and were analyzed by ANOVA with Bonferroni’s multiple comparisons test. (L) Schematic of the long-term training model (upper panel). Relative mRNA expression of Bax and MCL1 in naïve, untrained, and long-term (28 d) trained AMs at 24 h after second LPS challenge is shown. PPIA (peptidylprolyl isomerase A) was used as the internal control in qPCR. Data were collected from three independent experiments (n = 3) and were analyzed by ANOVA with Bonferroni’s multiple comparisons test. Graphs show mean ± SD, with each dot representing an individual mouse data. *P < 0.05, **P < 0.01, ***P < 0.001, ****P < 0.0001.
Figure 3.
Figure 3.
Trained AMs exhibit enhanced efferocytosis. (A) Relative mRNA expression of IL-10 and TNFα was analyzed from flow-sorted AM from naïve and trained mice at 72 h after injury. Data were collected from four independent experiments (n = 3–4) and were analyzed by ANOVA with Bonferroni’s multiple comparisons test. (B) MFI (mean fluorescence intensity) of TNFα and IL-10 protein within naïve and trained AMs (CD45+CD64+CD11blo/−SiglecF+ pre-gated) at 72 h after LPS was analyzed by flow cytometry. Data were collected from three independent experiments (n = 3–4) and were analyzed by unpaired t test. (C) The levels of IL-10 and TNFα were measured in BAL fluid by ELISA in the afore-mentioned conditions. Data were collected from three independent experiments (n = 3) and analyzed by unpaired t test. (D) Confocal microscopy shows the ex vivo phagocytosis of E. coli–GFP by naïve and trained AMs, isolated at 72 h after LPS injury, and the number of E. coli internalized by AMs as quantified. Scale bar, 10 µm. Data were collected from three independent experiments (n = 3) and were analyzed by unpaired t test. (E) Percent uptake of E. coli–GFP by AMs (CD45+CD64+CD11b−/loSiglecF+ gated) was analyzed by flow cytometry. Data were collected from three independent experiments, (n = 3) and were analyzed by unpaired t test. (F) Percent uptake of dead neutrophils by naïve and trained AMs, isolated at 72 h after LPS, was quantified by flow cytometry (left panel). Data were collected from three independent experiments, (n = 3) and were analyzed by unpaired t test. Representative confocal image shows the efferocytosis in the aforementioned conditions (right panel). Scale bar, 10 µm. (G) Percentage of Annexin V+ neutrophil at 24 h after LPS (left panel) and 72 h after LPS (right panel) in naïve and trained mice was analyzed by flow cytometry. Data were collected from six independent experiments (n = 5) and were analyzed by unpaired t test. (H) In the left panel, flow cytometry histogram plot shows tdTomato positivity within AM (CD45+CD64+CD11c+ CD11blo/SiglecF+gated). In the right panel, the percent uptake of neutrophils (tdTomato+) by naïve and trained AMs at 24 and 72 h after LPS challenge was analyzed by flow cytometry. Data were collected from three independent experiments (n = 3–4) and were analyzed by ANOVA with Bonferroni’s multiple comparisons test. Graphs show mean ± SD, with each dot representing individual mice. *P < 0.05, **P < 0.01, ***P < 0.001, ****P < 0.0001.
Figure 4.
Figure 4.
Training upregulates key efferocytosis mediators in tissue-resident AMs. (A) The relative mRNA levels for phagocytosis and efferocytosis genes (CLEC7a, CD16, SCARB1, FCGR2B, TYRO3, AXL, OLR1, MERTK, TIM3, TIM4, CD36, SIPRα) in naïve and trained AM at 72 h after LPS challenge are shown. Data were collected from four independent experiments (n = 4) and were analyzed by unpaired t test. (B) In the left panel, histogram overlay shows MERTK expression in AM (CD45+CD64+CD11blo/−SiglecF+ gated) in naïve and trained mice at 72 h after LPS. In the right panel, the graph shows the percentage of MERTKhi AMs (CD11b−/loSiglecF+MERTKhi) subset within all lung macrophages (CD45+CD64+Gr1 pre-gated) in above-mentioned conditions. Data were collected from four independent experiments, (n = 6–7) and were analyzed by unpaired t test. (C) The absolute number of MERTKhi AMs (CD11b−/loSiglecF+MERTKhi) subset within all lung macrophages (CD45+CD64+Gr1 pre-gated) was quantified. Data were collected from three independent experiments (n = 5) and were analyzed by unpaired t test. (D) Relative mRNA expression of SOCS3 and DUSP1 in naïve and trained AMs, isolated at after 72 h LPS, were analyzed by qPCR. Data were collected from three independent experiments (n = 3–5) and were analyzed by ANOVA with Bonferroni’s multiple comparisons test. (E) In the left panel, histogram overlay shows MERTK expression in AM (CD45+CD64+CD11blo/−SiglecF+ gated) in naïve and trained CCR2−/− mice at 72 h after LPS. In the right panel, graph shows the absolute number of MERTKhi AMs (CD11b−/loSiglecF+MERTKhi) subset within all lung macrophages (CD45+CD64+Gr1 pre-gated) in above-mentioned conditions. Data were collected from four independent experiments (n = 4–6) and were analyzed by ANOVA with Bonferroni’s multiple comparisons test. For all qPCR experiments PPIA was used as the internal control. Graphs show mean ± SD, with each dot representing individual mice. *P < 0.05, **P < 0.01, ***P < 0.001, ****P < 0.0001.
Figure S3.
Figure S3.
Sub-population of lung macrophages in trained mice. (A) The gating strategy used to enrich the macrophage population for further analysis in CyTOF. (B) The represented tSNE plots show the metaclusters, generated by the unsupervised clustering algorithm FlowSOM in naïve and trained macrophages at 72 h after LPS challenge. (C) Heatmap showing expression of 28 proteins that generated 15 metaclusters of naïve or trained macrophages. The representative heatmap was generated from individual samples using log2 ratio of mean intensity as the Z score. For all represented tSNE plots are analyzed with cells from n = 3 mice per group and repeated independently three times. (D) Representative viSNE plot shows the overlay of FlowSOM-metacluster_5,7 with AM cluster 1,2. (E–I) The representative histogram overlay shows the mean expression of (E) MERTK, (F) Marco, (G) F4/80, (H) CD163, (I) active caspase-3 in FlowSOM metacluster_5 (i.e., AM 1) and FlowSOM metacluster_7 (i.e., AM 2/MERTKhi) in trained mice at 72 h after LPS challenge. All the representative histogram plots are analyzed with cells from n = 3 mice per group and repeated independently three times.
Figure 5.
Figure 5.
Mass cytometry analysis of training-induced lung macrophage heterogeneity. (A) tSNE map was derived by tSNE algorithm from CyTOF data of lung macrophages (CD45+CD64+Gr1 gated) from naïve and trained mice at 72 h after LPS. Plots show the colored gradient expression of CD11c, SiglecF, CD11b, and CX3CR1 in different clusters. AM (CD45+CD64+Gr1CD11c+SiglecF+CD11bloCX3CR1) clusters are highlighted by gating. (B) CyTOF data of lung macrophages (CD45+CD64+Gr1 gated) is analyzed by the automated unsupervised hierarchical cell clustering algorithm CITRUS. The representation of CITRUS-tree with colored gradient expression of SiglecF and CD11b. The cluster nodes belonging to AM (CD45+CD64+Gr1CD11c+ CD11bloSiglecF+) are marked with a gate. (C) Colored gradient expression of MERTK is represented in CITRUS-tree and higher expressing cluster nodes are highlighted with a red circle. (D) The violin plot shows the relative abundances of MERTKhi cluster in naïve and trained mice at 72 h after LPS. (E) The tSNE plot shows the colored gradient expression and percentage of MERTKhi cluster (2) within pre-gated AM (CD45+CD64+Gr1CD11bloSiglecF+) in above-mentioned condition (left panel). In the right panel, the histogram overlay shows the mean expression of MERTK within cluster 1 and cluster 2 in trained AMs. (F–H) In the left panel, CITRUS-tree shows colored gradient expression of Marco, CD163, and F4/80; MERTKhi clusters node is highlighted with red circles. In the right panel, representative viSNE plot shows the colored gradient expression of the above within pre-gated AM (CD45+CD64+Gr1CD11bloSiglecF+) in trained mice at 72 h after LPS challenge. The histogram overlay shows the mean expression of Marco, CD163, and F4/80 within cluster 1 and cluster 2 (MERTKhi) of pre-gated AM (CD45+CD64+Gr1CD11bloSiglecF+) in above mentioned condition. (I) The histogram overlay shows the mean expression of active caspase-3 within cluster 2 (MERTKhi) of pre-gated AM (CD45+CD64+Gr1CD11bloSiglecF+) in naïve and trained mice at 72 h after LPS challenge. For all CyTOF data, representative tSNE plots are analyzed with cells from n = 3 mice per group obtained from three independent experiments with a total n = 9 samples. Statistical analysis was performed using CITRUS.
Figure S4.
Figure S4.
Transcriptional regulation of trained AMs. (A) ATAC-seq TSS reads coverage heatmap of all samples. Within the heatmap, each line represents a transcript. The reads coverage is summarized with a color code from red to blue. Red indicates no coverage; blue indicates the maximum coverage observed. All the TSS were aligned in the middle, with a 2 kb account the TSS displayed. On top of the heatmap, is the mean coverage signal distribution around TSS. The left two panels represent the naïve AM replicates, and the right two panels represent the trained AM replicates. (B) ATAC-seq fragment length distribution of all samples is shown. Distribution of read length for QC. X axis represents the fragment length in base pair. Y axis represents the normalized read density. The small figure is the log-transformed density distribution. Reads <100 bp represent the nucleosome-free region. (C) Principal component analysis (PCA) plot of ATAC-seq of all samples. ATAC-seq analysis generates peak file for each replicate. Each sample was characterized by the peak count table. After normalization and log-transformation, samples were grouped by biological condition. Red represents replicates from the naïve group. Blue represents replicates from the trained group. (D) The IGV (Integrative Genomics Viewer) snapshot shows the open chromatin regions within the KLF4 promoter from basal AMs (control). The black short stretch region shows the amplicon region for the primers used for ATAC-qPCR. (E–H) Sequence conservation of the KLF4-binding sites (E) −188 bp, (F) −250 bp, (G) −352 bp, and (H) −592 bp in MERTK promoter between human, mouse, monkey, and rat was analyzed by CLUSTALW.
Figure 6.
Figure 6.
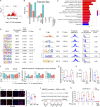
TF KLF4 is upregulated during training and promotes MERTKhi AM expansion. (A) The volcano plot shows the DARs from ATAC-seq analysis. X axis indicates the log2 fold change. Y axis is a log10-transformed adjusted P value using DESeq2 analysis. Red indicated significant with FDR <0.05. (B) The bar plot shows the distribution of the genomic location of DARs. DARs genomic annotation were grouped into promoter, intron, exon, distal intergenic, 5′ UTR and -3′ UTR, and downstream ≤300 bp. Red indicates log2 fold change is larger in the naïve group, and blue indicates log2 fold change is larger in the basal group. (C) GO enrichment analysis of the genes with promoter more open in the trained group is represented. Fisher’s exact test was applied with a FDR <0.05. X axis is the gene number; y axis is the corresponding GO term. The color shades represent the adjusted P value from the enrichment analysis. (D) The TF motif enrichment was analyzed by Homer. The top 10 TF motifs were enriched from the more open promoter DARs from the trained group using Homer. FDR <0.05 were applied. Each row is a TF motif, with sequence logo details. (E) The TF motif enrichment was performed using MEME. The top six TF motifs were enriched from the more open promoter DARs from the trained group using MEME. Each row is a TF motif, with sequence logo details. Data were collected from two independent experiments with two mice in each experiment with a total n = 4. (F) The bar diagram shows the KLF4- and NF-κB–binding motif enrichment in the differentially expressed genes between trained AMs and naïve AMs (left panel). In the right panel, bar diagrams represent the KLF4-binding motif enrichment in the upregulated genes associated with host defense, phagocytosis, and inflammatory injury resolution, respectively. Data were collected from three independent experiments, and cells were combined from two mice per group with n = 6 samples. (G) Relative mRNA expression of KLF4 in flow-sorted naïve and trained AMs at baseline and 72 h after LPS challenge was represented. PPIA was used as the internal control. Data were collected from three independent experiments (n = 4–5) and were analyzed by ANOVA with Bonferroni’s multiple comparisons test. (H) The graph shows the percent FE of chromatin accessibility of KLF4 promoter (−600 bp) in naïve and trained AMs isolated 72 h after LPS challenge, detected by ATAC-qPCR by designed primer (left panel). The DNA methylation of the KLF4 promoter was analyzed by methylation-specific PCRethylation-specific PCR)-qPCR in the above-mentioned condition and shown graphically (right panel). Data were collected from six independent experiments, and cells were combined from two mice per group with n = 6–8 samples and analyzed by unpaired t test. (I) KLF4 colocalization with DAPI in naïve and trained AMs, isolated from 72 h post-LPS challenge lung (left panel), was measured by confocal microscopy. Scale bar, 10 µm. Pearson’s r was quantified by ImageJ and represented graphically (right panel). Data were collected from three independent experiments (n = 4) and were analyzed by unpaired t test. (J) The upper panel shows putative binding sites of KLF4 on MERTK promoter (−1,000 to +100 bp relative to TSS), and the bottom panel shows the primer sets used for ChIP-qPCR. (K) FE of KLF4 binding on MERTK promoter in isolated 72-h post-LPS naïve and trained AMs was analyzed by ChIP-qPCR. Data were collected from five independent experiments (n = 3–5) and were analyzed by ANOVA with Bonferroni’s multiple comparisons test. Graphs show mean ± SD with each dot representing individual mouse data. *P < 0.05, **P < 0.01, ****P < 0.0001.
Figure S5.
Figure S5.
Training in KLF4-depleted AM. (A) Representation of breeding scheme of LyzM-Cre+/−;KLFfl/fl (KOLyzM-Cre) mice. (B) Relative mRNA expression of KLF4 in KOLyzM-Cre and WT (littermate control) in trained AM. Data were collected from four independent experiments (n = 4) and were analyzed by unpaired t test. (C) Training scheme of KOLyzM-Cre and littermate control mice. (D) Representation of breeding scheme of Csf1R-CreERT2+/−;KLFfl/fl (KOCsf1R-CreERT2) mice. (E) Relative mRNA expression of KLF4 in KOCsf1R-CreERT2 and WT (littermate control) in trained AM. Data were collected from four independent experiments (n = 4) and were analyzed by unpaired t test. (F) Training scheme of KOCsf1R-CreERT2 and littermate control mice. (G and H) The graphs show the prepared liposome size analyzed by dynamic light scattering (G) and the zeta potential of empty liposome and shRNA-liposome (H), as studied by Malvern Zetasizer. (I) The graph represents the KLF4-mRNA expression in isolated trained AMs in the presence of scramble/KLF4-shRNA-liposomes. Data were collected from three independent experiments (n = 4–5) and were analyzed by unpaired t test. (J) The histogram overlay shows the GFP expression in the gated neutrophils in green (CD45+Ly6G+) and gated AMs (CD45+CD64+CD11bSiglecF+) in red (left panel) in KLF4-shRNA–treated trained mice. The KLF4 mRNA expression in isolated neutrophils from KLF4-shRNA–treated and corresponding control mice in the 7 d + 72 h condition was measured. Data were collected from three independent experiments (n = 4) and were analyzed by unpaired t test. PPAI has been used as the internal control in qPCR. Graphs show mean ± SD with each dot representing an individual mouse data. **P < 0.01, ****P < 0.0001.
Figure 7.
Figure 7.
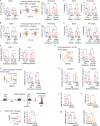
KLF4 is required for MERTKhi AM expansion in trained mice. (A) The left panel shows the absolute AM number at the basal condition in naïve (C) and trained (7 d) KOlyzM-cre mice and WT littermate control mice. In the middle panel, the representative flow cytometry plots show the percentage of AMs (CD45+CD64+CD11b−/loSiglecF+) within CD45+CD64+ (lung macrophages) pre-gated population in LPS (7 d)-trained WT littermate control and KOlyzM-cre at 72 h after LPS challenge. The graph in the right panel represents the absolute AM number in above mentioned conditions. Data were collected from six independent experiments (n = 3–6) and were analyzed by ANOVA with Bonferroni’s multiple comparisons test. (B) The left panel shows the absolute AM number at the basal condition in naïve (C) and trained (7 d) KOCsf1R-CreERT2 and WT littermate control mice. In the middle panel, the representative flow cytometry plots show the percentage of AMs (CD45+CD64+CD11b−/loSiglecF+) within CD45+CD64+ (lung macrophages) pre-gated population, in LPS (7 d)-trained WT littermate control (WT) and KOCsf1R-CreERT2 at 72 h after LPS challenge. The graph in the right panel represents the absolute AM number in the above-mentioned conditions. Data were collected from six independent experiments (n = 4–5) and were analyzed by ANOVA with Bonferroni’s multiple comparisons test. (C) The graph shows the percentages of neutrophils in KOlyzM-Cre and WT littermate control mice at basal conditions (C and 7 d; left panel) and at 72-h post-LPS challenge conditions. Data were collected from six independent experiments (n = 3–7) and were analyzed by ANOVA with Bonferroni’s multiple comparisons test. (D) The percentages of neutrophils in KOCsf1R-CreERT2 and WT littermate control mice at basal conditions (C and 7 d; left panel) and 72 h after LPS challenge were represented (right panel). Data were collected from six independent experiments (n = 3–5) and were analyzed by ANOVA with Bonferroni’s multiple comparisons test. (E) The relative mRNA expression of TNFα and IL1β in total lung tissue isolated from untrained and trained WT littermate control and KOCsf1R-CreERT2 mice 72 h after LPS challenge. Data were collected from six independent experiments (n = 3) and were analyzed by ANOVA with Bonferroni’s multiple comparisons test. (F) The histogram overlay shows the MERTK expression and percent positivity within pre-gated AM (CD45+CD64+CD11b−/loSiglecF+) in trained littermate control (WT) and KOlyzM-Cre at 72 h after LPS challenge (left panel). The graph in the right panel shows the absolute number of MERTKhi AM in untrained and trained KOlyzM-Cre and WT mice at 72 h after LPS challenge. Data were collected from six independent experiments (n = 3–6) and were analyzed by ANOVA with Bonferroni’s multiple comparisons test. (G) The histogram overlay shows the MERTK expression and percent positivity within pre-gated-AM (CD45+CD64+CD11b−/loSiglecF+) in trained littermate control (WT) and KOCsf1R-CreERT2 mice at 72 h after LPS challenge (left panel). The absolute number of MERTKhi AM in untrained and trained KOCsf1R-CreERT2 and WT mice at 72 h after LPS challenge is shown in the right panel. Data were collected from six independent experiments (n = 4) and were analyzed by ANOVA with Bonferroni’s multiple comparisons test. (H) The relative Marco mRNA expression in isolated 72 h after LPS–challenged untrained (left panel) and LPS (7 d)-trained AM (right panel) in KOlyzM-Cre and KOCsf1R-CreERT2 mice and respective littermate controls (WT) is represented. Data were collected from six independent experiments (n = 3–4) and were analyzed by ANOVA with Bonferroni’s multiple comparisons test. (I) Schematic representation of KLF4-shRNA-liposome delivery experiment in trained mice (left panel). In the right panel, representative histogram overlay shows the mean expression of GFP (KLF4-shRNA) in AM (CD45+CD64+CD11c+CD11blo/−SiglecF+) pre-gated cells in untreated and KLF4-shRNA-liposome–injected trained mice. (J) Absolute numbers of MERTKhi AM within the whole lung of scrambled- and KLF4 shRNA-liposome–injected trained mice were shown. Data were collected from three independent experiments (n = 4) and were analyzed by unpaired t test. (K) Neutrophil percentage within all lung immune cells (CD45+ gated) was analyzed in the aforementioned condition. Data were collected from five independent experiments (n = 10) and were analyzed by unpaired t test. (L) Histogram overlay shows the mean expression of CD11b in pre-gated neutrophils (CD45+Ly6G+) in the absence or presence of KLF4 shRNA-liposome (left panel) and mean fluorescence intensity (MFI) are statistically analyzed (right panel). Data were collected from three independent experiments (n = 6) and were analyzed by unpaired t test. (M) In trained catchup mice, the percent uptake of tdTomato-labeled neutrophil by AMs in the absence or presence of KLF4-shRNA-liposomes was analyzed by flow cytometry (left panel). Data were collected from five independent experiments (n = 10) and were analyzed by unpaired t test. Flow cytometry analysis of annexin V positivity of neutrophil (CD45+Ly6G+) in above-mentioned conditions is represented graphically (right panel). Data were collected from three independent experiments, (n = 3) and were analyzed by unpaired t test. For all qPCR experiments, PPIA was used as the internal control. Graphs show mean ± SD, with each dot representing individual mouse data. *P < 0.05, **P < 0.01, ***P < 0.001, ****P < 0.0001.
Figure 8.
Figure 8.
Adoptive transfer of trained AMs confers protection in recipient mice with PA-induced pneumonia. (A) Schematic showing training in PA-induced pneumonia model. One group of mice received a sublethal dose of PA (1 × 10⁴ CFU) intranasally to induce pneumonia. After 14 d, along with a naïve group of mice, PA-challenged mice were again challenged with a lethal dose of PA (2 × 10⁶ CFU) and after 72 h, all mice were sacrificed for further analysis. (B) In the left panel, representative flow cytometry plots show the naïve and trained AM population (CD45+CD64+CD11b−/loSiglecF+) in the 72 h post-acute PA insult (72 h and 14 d + 72 h). In the right panel, AM absolute numbers were quantified. Data were collected from three independent experiments, (n = 3–7) and were analyzed by unpaired t test. (C) The survival curve shows the percent survival of naïve and trained mice after counter PA (2 × 10⁶ CFU) challenge. Data were collected from three independent experiments (n = 21) and were analyzed by Kaplan–Meier survival analysis. (D) Graph shows the percentage of neutrophils (CD45+Ly6G+) within total lung immune cells (CD45+ pre-gated) in naïve and trained mice at 72 h after the second PA insult. Data were collected from three independent experiments (n = 3–7) and were analyzed by unpaired t test. (E) The histogram overlay shows the MERTK positivity within pre-gated AM in naïve and PA-trained mice (left panel). In the right panel, the absolute number of MERTKhi AM is shown. Data were collected from three independent experiments (n = 3–7) and were analyzed by unpaired t test. (F) The relative mRNA expression of MERTK and KLF4 in isolated AMs from naïve and trained mice following a PA challenge. Data were collected from three independent experiments (n = 3) and were analyzed by ANOVA with Bonferroni’s multiple comparisons test. (G) Schematic showing the adoptive transfer of naïve and trained AMs. Trained AMs were collected from PA (1 × 10⁴ CFU) pre-challenged mice, and naïve AMs were collected from naïve mice. Three groups of naïve mice were inoculated with PA (1 × 10⁶ CFU). After 4 h, either 2 × 10⁵ trained AMs or 2 × 10⁵ naïve AMs were injected i.t., whereas a third group of mice received no cell therapy (PA). Then, after 24 h, all mice were sacrificed for further analysis. (H) H&E staining of lung sections show the lung histology of PA-infected untreated mice, naïve AM treated, and trained AM treated mice which were exposed to lethal PA. Scale bar, 100 µm. The box section has been enlarged to show the highlighted region in the bottom panel. Arrowhead shows the perivascular accumulation of leukocytes and perivascular edema. (I and J) The level of IL-10 and TNFα was measured from BAL fluid by ELISA in the aforementioned group of mice. Data were collected from three independent experiments (n = 4–5) and were analyzed by ANOVA with Bonferroni’s multiple comparisons test. (K) Flow cytometry quantification of the percentage of neutrophil (CD45+Ly6G+) within all lung immune cells was compared between PA-infected untreated (PA), naïve AM-treated (+naïve AM) and trained AM-treated (+trained AM) mice. Data were collected from three independent experiments (n = 4–10) and were analyzed by ANOVA with Bonferroni’s multiple comparisons test. Graphs show mean ± SD, with each dot representing an individual mouse data point. *P < 0.05, **P < 0.01, ***P < 0.001, ****P < 0.0001.

References

    1. Aegerter, H., Kulikauskaite J., Crotta S., Patel H., Kelly G., Hessel E.M., Mack M., Beinke S., and Wack A.. 2020. Influenza-induced monocyte-derived alveolar macrophages confer prolonged antibacterial protection. Nat. Immunol. 21:145–157. 10.1038/s41590-019-0568-x - DOI - PMC - PubMed
    1. Akalu, Y.T., Mercau M.E., Ansems M., Hughes L.D., Nevin J., Alberto E.J., Liu X.N., He L.Z., Alvarado D., Keler T., et al. . 2022. Tissue-specific modifier alleles determine Mertk loss-of-function traits. Elife. 11:e80530. 10.7554/eLife.80530 - DOI - PMC - PubMed
    1. Amir, el-A.D., Davis K.L., Tadmor M.D., Simonds E.F., Levine J.H., Bendall S.C., Shenfeld D.K., Krishnaswamy S., Nolan G.P., and Pe’er D.. 2013. viSNE enables visualization of high dimensional single-cell data and reveals phenotypic heterogeneity of leukemia. Nat. Biotechnol. 31:545–552. 10.1038/nbt.2594 - DOI - PMC - PubMed
    1. Ampomah, P.B., Cai B., Sukka S.R., Gerlach B.D., Yurdagul A. Jr, Wang X., Kuriakose G., Darville L.N.F., Sun Y., Sidoli S., et al. . 2022. Macrophages use apoptotic cell-derived methionine and DNMT3A during efferocytosis to promote tissue resolution. Nat. Metab. 4:444–457. 10.1038/s42255-022-00551-7 - DOI - PMC - PubMed
    1. Aran, D., Looney A.P., Liu L., Wu E., Fong V., Hsu A., Chak S., Naikawadi R.P., Wolters P.J., Abate A.R., et al. . 2019. Reference-based analysis of lung single-cell sequencing reveals a transitional profibrotic macrophage. Nat. Immunol. 20:163–172. 10.1038/s41590-018-0276-y - DOI - PMC - PubMed

Publication types