. 2023 Oct 16;133(20):e166644.
doi: 10.1172/JCI166644.

Peroxisome disruption alters lipid metabolism and potentiates antitumor response with MAPK-targeted therapy in melanoma

Affiliations

Peroxisome disruption alters lipid metabolism and potentiates antitumor response with MAPK-targeted therapy in melanoma

Fan Huang et al. J Clin Invest. .

Abstract

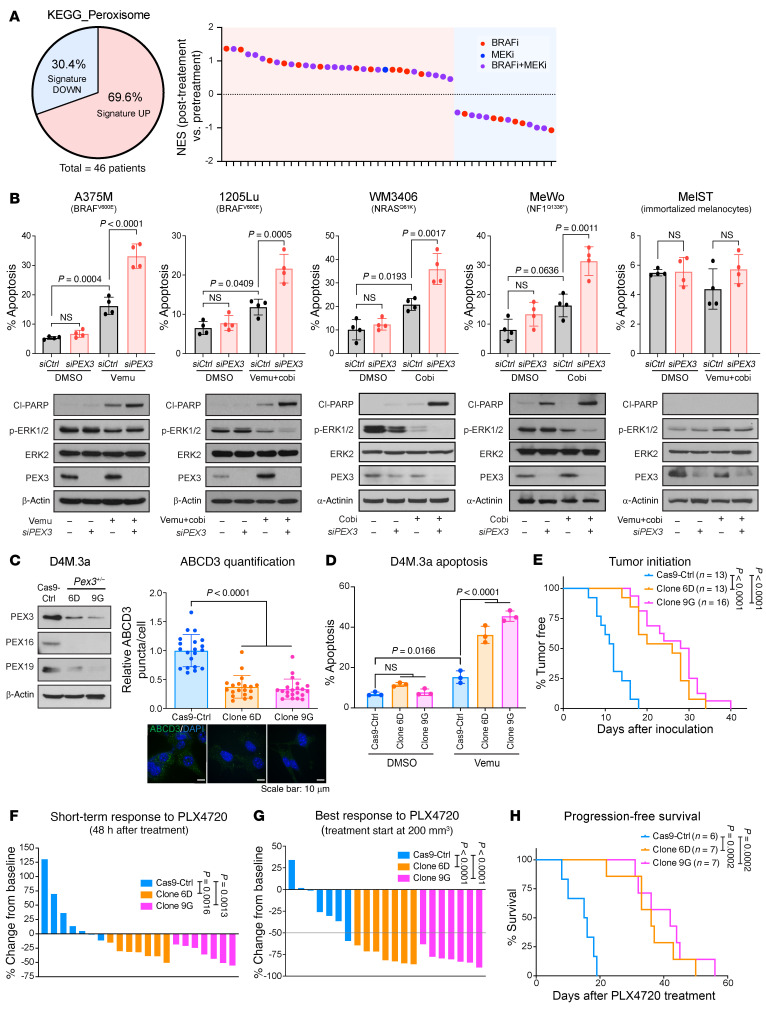
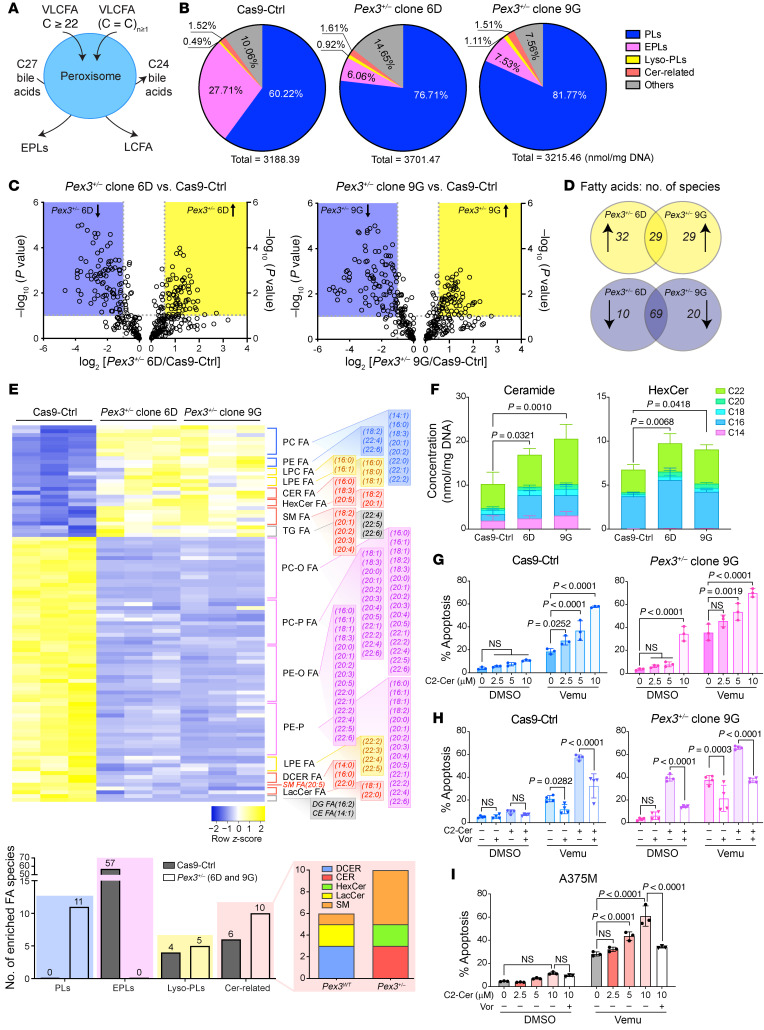
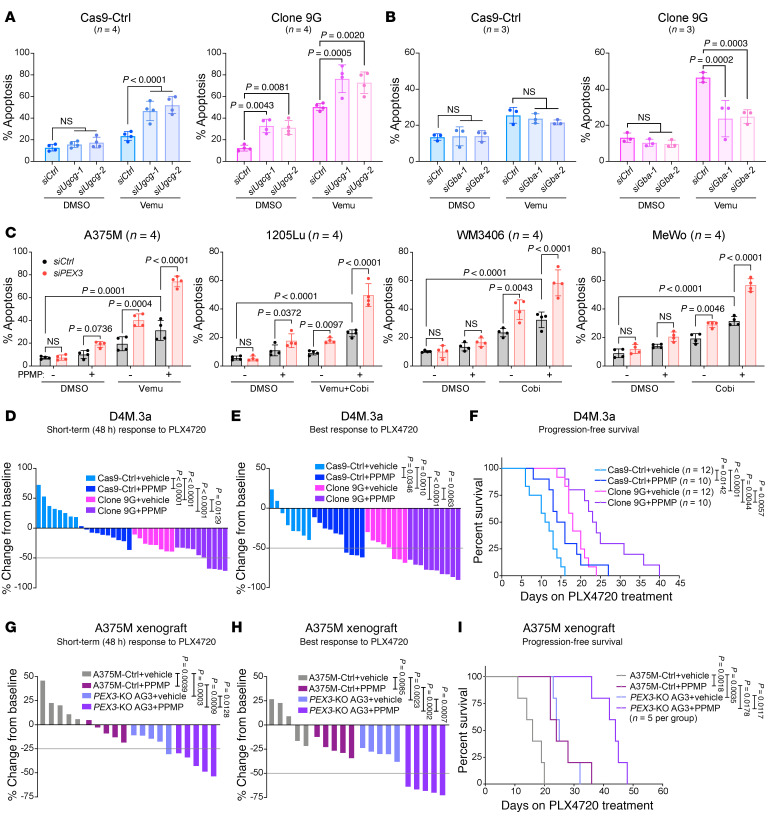
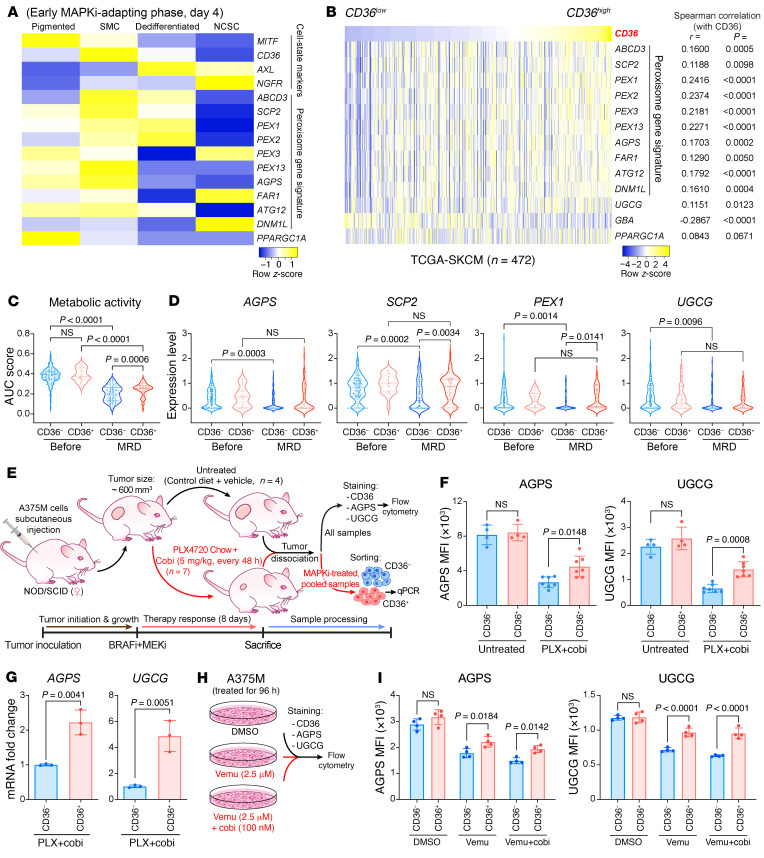
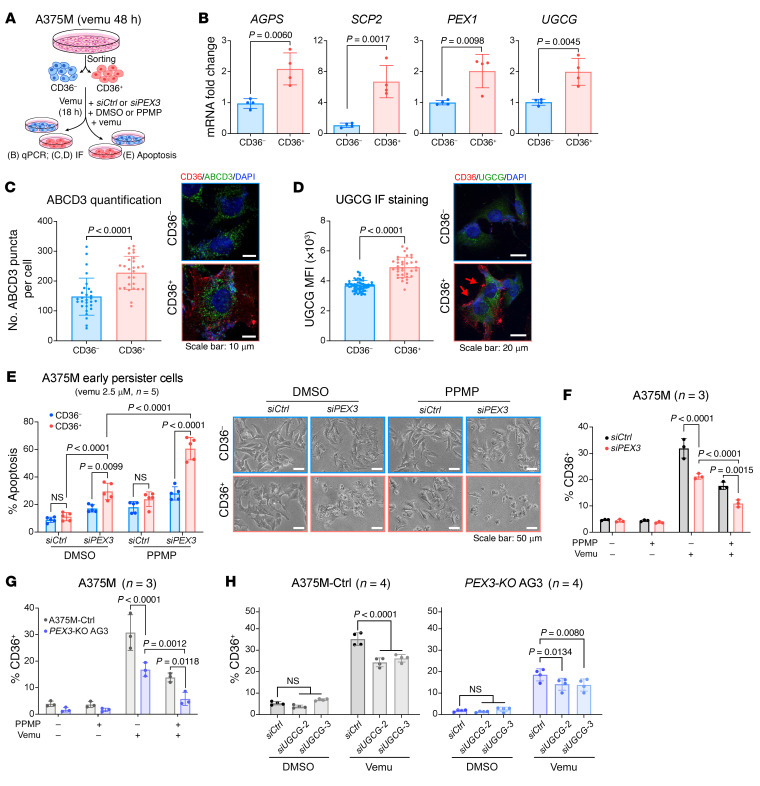
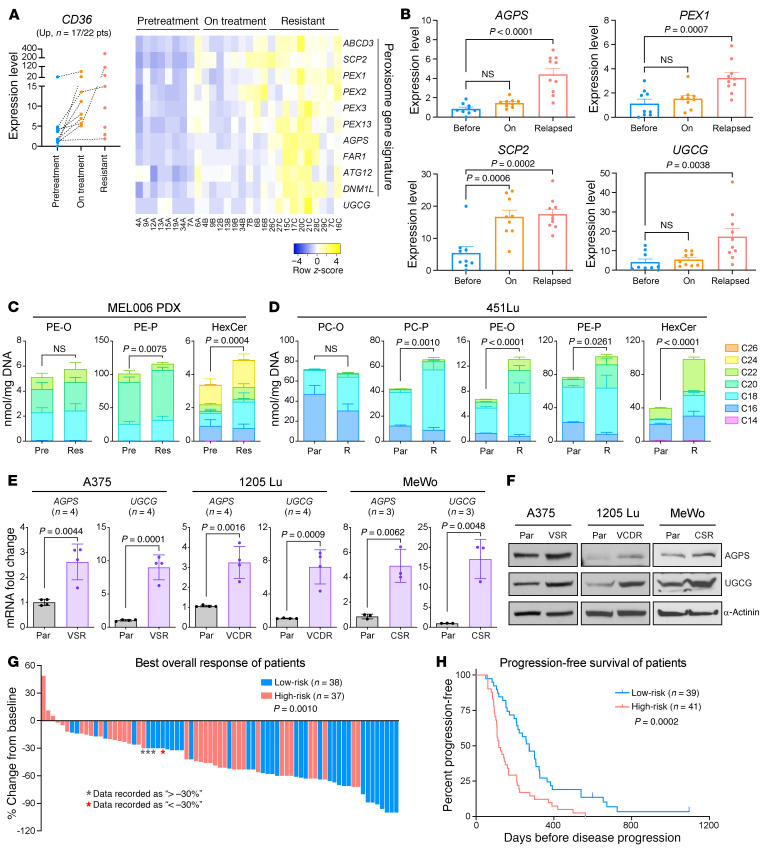
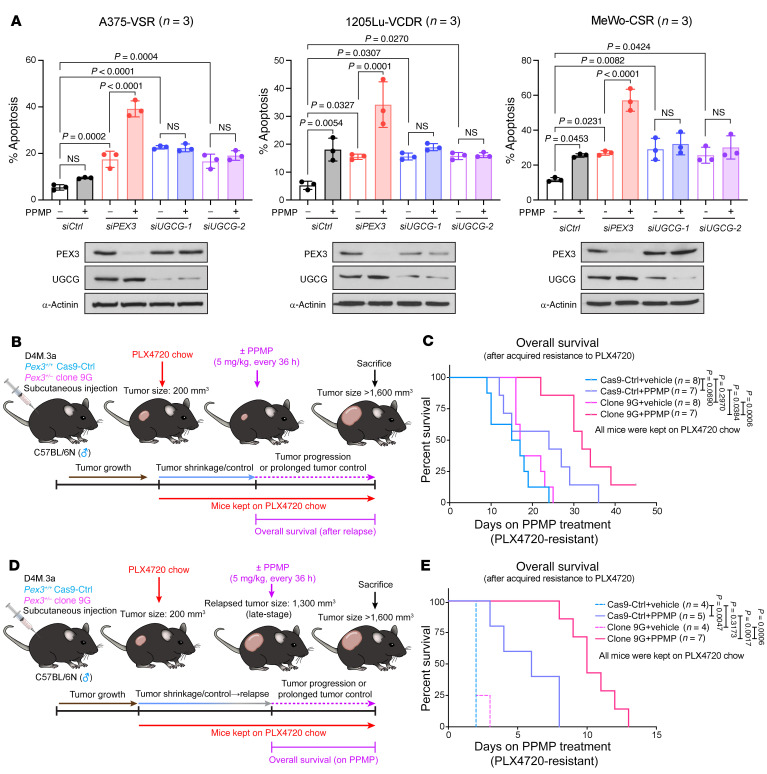
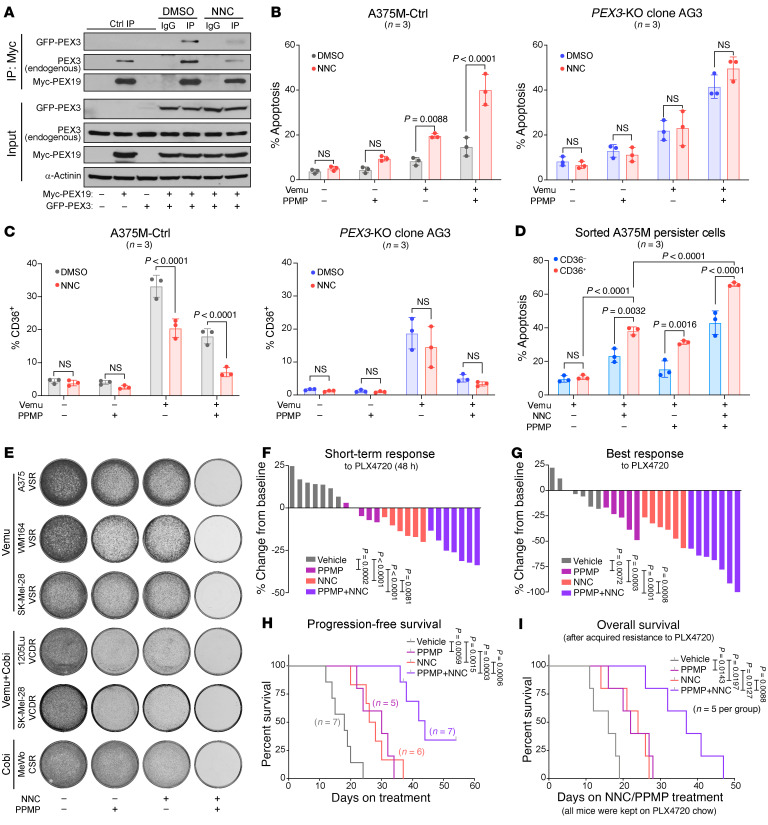
Melanomas reprogram their metabolism to rapidly adapt to therapy-induced stress conditions, allowing them to persist and ultimately develop resistance. We report that a subpopulation of melanoma cells tolerate MAPK pathway inhibitors (MAPKis) through a concerted metabolic reprogramming mediated by peroxisomes and UDP-glucose ceramide glycosyltransferase (UGCG). Compromising peroxisome biogenesis, by repressing PEX3 expression, potentiated the proapoptotic effects of MAPKis via an induction of ceramides, an effect limited by UGCG-mediated ceramide metabolism. Cotargeting PEX3 and UGCG selectively eliminated a subset of metabolically active, drug-tolerant CD36+ melanoma persister cells, thereby sensitizing melanoma to MAPKis and delaying resistance. Increased levels of peroxisomal genes and UGCG were found in patient-derived MAPKi-relapsed melanomas, and simultaneously inhibiting PEX3 and UGCG restored MAPKi sensitivity in multiple models of therapy resistance. Finally, combination therapy consisting of a newly identified inhibitor of the PEX3-PEX19 interaction, a UGCG inhibitor, and MAPKis demonstrated potent antitumor activity in preclinical melanoma models, thus representing a promising approach for melanoma treatment.

Keywords: Melanoma; Oncology.


Conflict of interest statement

Conflict of interest: The authors have declared that no conflict of interest exists.

Figures

Figure 1
Figure 1. Compromising PEX3 sensitizes melanoma to MAPK inhibition.
(A) Left: Pie chart showing percentage of patients (n = 46) with increased or decreased transcript levels of peroxisome-related genes (KEGG_Peroxisome) after treatment with MAPK-targeted therapies. Right: Normalized enrichment scores (NESs) assessing increase (positive) or decrease (negative) of KEGG_Peroxisome gene set in samples from each patient collected before versus after treatment with indicated MAPK inhibitors. (B) Top: Percentage apoptotic cells as measured by the sum of PI/Annexin V double-positive and Annexin V–positive staining. Bottom: Western blot analysis of the indicated proteins in human melanoma cells or immortalized melanocytes (MelST) following PEX3 knockdown (or siCtrl transfection) and treatment with indicated MAPK inhibitors (n = 4). Equal volumes of DMSO were added to the control groups. Detailed treatment and timeline are presented in Supplemental Table 1. Two-way ANOVA. Cl-PARP, cleaved poly(ADP-ribose) polymerase. (C) Western blot analysis of the indicated proteins (left) and relative number of ABCD3 puncta (right) in D4M.3a Cas9-Ctrl, Pex3+/– clone 6D, and Pex3+/– clone 9G cells. Representative immunofluorescent staining for ABCD3 (green) and DAPI nuclear stain (blue) are presented (n = 3). Scale bars: 10 μm. One-way ANOVA. (D) Percentage apoptosis detected in D4M.3a Cas9-Ctrl, 6D, and 9G cells following vemurafenib (vemu) or DMSO treatment for 24 hours (n = 3). Two-way ANOVA. (E) Kaplan-Meier curves showing initiation of D4M.3a Cas9-Ctrl–, 6D-, and 9G-derived melanomas. Log-rank test. (F and G) Waterfall plots showing (F) the short-term response (STR, 48-hour treatment) and (G) the best response (BR) of D4M.3a Cas9-Ctrl–, 6D-, and 9G-derived melanomas to PLX4720. Values represent percentage volume change of each tumor from baseline. One-way ANOVA. (H) Kaplan-Meier curves showing progression-free survival of mice bearing D4M.3a Cas9-Ctrl–, 6D-, and 9G-derived melanomas, fed with PLX4720 chow. Log-rank test. Data in BD represent mean ± SD. Number of biological replicates is indicated in each graph.
Figure 2
Figure 2. Pex3+/– D4M.3a melanoma cells have altered lipidomes.
(A) Schematic of peroxisome-mediated lipid metabolism. VLCFA, very-long-chain fatty acids. (B) Pie charts showing lipid composition (relative abundance of each lipid family in percentage total) in D4M.3a Cas9-Ctrl, Pex3+/– clone 6D, and Pex3+/– clone 9G cells. Concentrations of each lipid family (normalized to mg DNA) are indicated (n = 3). (C) Volcano plots comparing abundance of lipid species in clone 6D versus Cas9-Ctrl (left) and clone 9G versus Cas9-Ctrl (right). Yellow and blue shades highlight respective increased (≥1.5-fold) and decreased (≤1.5-fold) lipid species in Pex3+/– cells relative to Cas9-Ctrl D4M.3a cells. (D) Venn diagrams showing lipid species that were significantly increased (top) or decreased (bottom) in D4M.3a clone 6D and clone 9G cells, compared with Cas9-Ctrl cells. (E) Top: Heatmap showing lipid species that were commonly altered in D4M.3a Pex3+/– (6D and 9G) cells compared with Cas9-Ctrl cells. Bottom: Number of lipid species, categorized by family, enriched in D4M.3a Cas9-Ctrl or Pex3+/– (6D and 9G) cells. PC, phosphatidylcholine; PE, phosphatidylethanolamine; LPC, lysophosphatidylcholine; LPE, lysophosphatidylethanolamine; TG, triglyceride; PE-O, 1-alkyl,2-acylphosphatidylethanolamine; PC-O, 1-alkyl,2-acylphosphatidylcholine; PC-P, 1-alkenyl,2-acylphosphatidylcholine; PE-P, 1-alkenyl,2-acylphosphatidylethanolamine; DG, diacylglyceride; CE, cholesterol ester. (F) Concentrations of ceramides (left) and hexosylceramides (HexCer, right) detected in D4M.3a Cas9-Ctrl, 6D, and 9G cells (n = 3). Two-way ANOVA. (GI) Percentage apoptosis (PI+/Annexin V+, PI/Annexin V+) detected in DMSO- or vemu-treated (G and H) D4M.3a Cas9-Ctrl (left) or Pex3+/– clone 9G (right) or (I) A375M cells. Cells were pretreated with (G and I) C2-ceramide (C2-Cer) at escalated doses or with (H and I) C2-Cer (10 μM) and vorinostat (Vor, 1 μM) 24 hours prior to vemu treatment (n = 4 for H, n = 3 for G, I). Two-way ANOVA. All data represent mean ± SD.
Figure 3
Figure 3. Dual blockade of PEX3 and UGCG sensitized melanoma to MAPK inhibition.
(A and B) Percentage apoptosis detected in D4M.3a Cas9-Ctrl (left) or Pex3+/– clone 9G (right) cells, following (A) Ugcg or (B) Gba knockdown and treatment with vemu or DMSO control (n = 4 for A, n = 3 for B). (C) Percentage apoptosis detected in human melanoma cells following PEX3 knockdown and treatment with indicated MAPK inhibitors and/or D,L-threo-PPMP (PPMP). Equal volumes of DMSO were added to the control groups (n = 4). Detailed treatment and timeline are presented in Supplemental Table 1. Data in AC represent mean ± SD. (D and E) Waterfall plots showing (D) the STR and (E) the BR of D4M.3a Cas9-Ctrl– or 9G-derived melanomas to PLX4720 alone or PLX4720 combined with PPMP. (F) Kaplan-Meier curves showing PFS of mice bearing D4M.3a Cas9-Ctrl– or 9G-derived melanomas, treated with PLX4720 alone or PLX4720 combined with PPMP. (G and H) Waterfall plots showing (G) the STR and (H) the BR of A375M-Ctrl– or PEX3-KO AG3–derived melanomas to PLX4720 alone or in combination with PPMP. (I) Kaplan-Meier curves showing PFS of mice bearing A375M-Ctrl– or PEX3-KO AG3–derived melanomas, treated with PLX4720 alone or PLX4720 combined with PPMP. In DI, the number of biological replicates (mice) is indicated in each graph. Detailed experimental timelines are shown in Supplemental Figure 4, G and J. Values in D, E, G, and H represent percentage volume change of each tumor from baseline. Significance assessed with 2-way ANOVA (AE, G, and H) or log-rank test (F and I).
Figure 4
Figure 4. CD36+ MAPKi-tolerant melanoma cells have retained peroxisome levels and UGCG.
(A) Heatmap showing relative expression of indicated melanoma cell-state-specific markers, a panel of peroxisomal genes, and PPARGC1A in 4 drug-tolerant melanoma populations in the MEL006 PDX model during early dabrafenib+trametinib treatment (day 4). (B) Expression of CD36 and a peroxisomal gene signature, UGCG, GBA, and PPARGC1A (HTSeq-FPKM) in the GDC TCGA Melanoma data set (SKCM, n = 472). Spearman’s rank-order. (C and D) Violin plots of scRNA-seq data highlighting the distribution of (C) a gene signature indicating cancer cell metabolic activity and (D) indicated peroxisomal genes and UGCG in CD36 (<2.2) versus CD36+ (≥2.2) cells, before or after dabrafenib+trametinib treatment for 28 days (MRD). (E) Schematic of experimental design for panels F and G. (F) Relative expression of AGPS (left) and UGCG (right) in CD36 and CD36+ cell populations isolated from A375M melanoma xenografts following vehicle (n = 4) or PLX4720+cobi (n = 7) treatment for 8 days. (G) Fold change in AGPS (left) and UGCG (right) transcripts in CD36+ cells relative to CD36 cells isolated from A375M melanoma xenografts following PLX4720+cobi treatment for 8 days. RPLP0 was used as a reference gene. Cells from a total n = 7 tumors were pooled before sorting. Two-sided unpaired t test. (H) Schematic of experimental design for I. (I) Relative expression of AGPS (left) and UGCG (right) in CD36 versus CD36+ A375M cells following treatment with DMSO, vemu (2.5 μM), or vemu (2.5 μM) combined with cobi (100 nM) for 96 hours. Significance assessed with 2-way ANOVA (C, D, F, and I). Data in FI represent mean ± SD.
Figure 5
Figure 5. Peroxisomes and UGCG are required for survival of CD36+ MAPKi-tolerant melanoma cells.
(A) Schematic of experimental design for (BE). A375M cells were treated with vemu (2.5 μM) for 48 hours before CD36 staining and subsequent sorting. (B) Fold change in the indicated mRNAs in vemu-exposed CD36+ A375M cells relative to CD36 A375M cells, normalized to RPLP0 as a reference gene (n = 4). The SCP2 primers amplify the N-terminus of the transcript initiated from the proximal promoter, encoding the peroxisome-specific protein SCPx. (C) Number of ABCD3 puncta and (D) relative UGCG expression in vemu-exposed CD36+ versus CD36 A375M cells. Representative immunofluorescent staining for (C) CD36 (red), ABCD3 (green), and DAPI (blue) or (D) CD36 (red), UGCG (green), and DAPI (blue) are presented. Red arrows highlight cells stained positive for CD36. (E) Percentage apoptosis (left) and representative images (right) of vemu-exposed CD36+ versus CD36 A375M cells following PEX3 knockdown and/or PPMP treatment (n = 5). Scale bars: 10 μm (C), 20 μm (D), and 50 μm (E). (FH) Percentage of CD36+ populations in (F) A375M cells following PEX3 knockdown and the indicated treatment (n = 3), (G) A375M-Ctrl versus PEX3-KO AG3 cells upon indicated treatment (n = 3), or (H) A375M-Ctrl versus PEX3-KO AG3 cells following UGCG knockdown and subsequently treated with vemu (n = 4). Significance assessed by 2-sided unpaired t test (BD) or 2-way ANOVA (EH). Data represent mean ± SD.
Figure 6
Figure 6. Increased peroxisomal and UGCG activity commonly occurs in melanomas that rapidly acquire resistance to MAPK-targeted therapy.
(A) Normalized gene expression of CD36 (left), relative expression of a peroxisomal gene signature (right), and (B) expression of AGPS, SCP2, PEX1, and UGCG in a cohort of melanoma samples (n = 17 out of a total of 22 patients, Kwong 2015 data set) collected before, while on, or relapsed on MAPK-targeted therapy showing an overall trend of CD36 induction upon MAPKi. Data represent mean + SEM. One-way ANOVA. (C and D) Normalized abundance of indicated lipid species grouped by carbon chain length detected in (C) MEL006 PDX tumor samples collected before (Pre, n = 6) or relapsed (Res, n = 5) on dabrafenib+trametinib treatment, or (D) 451Lu parental (Par) cells versus vemu-resistant 451Lu-R cells (n = 3). Two-way ANOVA. PE-O, 1-alkyl,2-acylphosphatidylethanolamine; PC-O, 1-alkyl,2-acylphosphatidylcholine. (E) Fold change in AGPS and UGCG mRNA levels in a panel of MAPKi-resistant melanoma cells relative to their corresponding parental cells, normalized to ACTB as a reference gene (n = 4). Data in CE represent mean ± SD. (F) Western blot analysis of the indicated proteins in a panel of parental versus MAPKi-resistant melanoma cells. (G) Waterfall plots showing the best overall response and (H) Kaplan-Meier curves showing PFS of melanoma patients treated with MAPK-targeted therapy. Risk score ranging between 0 and 3 was calculated based on expression of CD36, AGPS, and UGCG before and after treatment (see Supplemental Table 5 for detailed information). Patients were subsequently grouped into high-risk (risk score ≥2) versus low-risk (risk score ≤1). Values in G represent percentage response of individual patient from baseline. Significance assessed by 2-sided unpaired t test (E and G) or log-rank test (H).
Figure 7
Figure 7. Dual inhibition of PEX3 and UGCG overcomes MAPKi resistance in melanoma.
(A) Percentage apoptosis detected in MAPKi-resistant cells following PEX3 or UGCG knockdown and treatment with PPMP. Equal volumes of DMSO were added to the control groups. Cells were maintained in the presence of indicated MAPKis (Supplemental Table 1). Detailed treatment and timeline are presented in Supplemental Table 1. Data represent mean ± SD (n = 3). Two-way ANOVA. (B and D) Schematic of detailed experimental design. (C and E) Kaplan-Meier curves showing overall survival (OS) of Cas9-Ctrl or Pex3+/– clone 9G tumor–bearing mice treated with PPMP or vehicle (C) after tumors relapsed on PLX4720, or (E) after relapsed tumor reached a volume of 1,300 mm3. All mice were kept on PLX4720 chow after PLX4720 treatment was initiated when individual tumor first reached a volume of 200 mm3. Number of biological replicates (mice) is indicated in each graph. Individual tumor growth curves are shown in Supplemental Figure 7, C and D. Log-rank test.
Figure 8
Figure 8. NNC 55-0396 disrupts PEX3-PEX19 interaction and cooperates with PPMP to sensitize melanoma to BRAF inhibition.
(A) Western blot analysis of PEX3 and PEX19 from Myc co-immunoprecipitation (co-IP) of HEK-293T cells cotransfected with GFP-PEX3– and Myc-PEX19–expressing plasmids, treated with DMSO or NNC 55-0396 (NNC, 4 μM, 24 hours). Left portion displays Myc co-IP of HEK-293T cells transfected with empty vector (EV), Myc-PEX19–, or GFP-PEX3–expressing plasmid alone. Immunoblots for inputs (10% of protein from IP) are shown below (representative of n = 3). (B) Percentage apoptosis or (C) percentage of CD36+ populations detected among A375M-Ctrl cells (left) or PEX3-KO AG3 cells (right) following indicated treatment with NNC (4 μM), vemu, and/or PPMP. (D) Percentage apoptosis detected in vemu-exposed CD36+ versus CD36 A375M cells following NNC and/or PPMP treatment (n = 3). Data in BD represent mean ± SD. (E) Colony formation assays of a panel of MAPKi-resistant melanoma cells cultured in the presence of indicated MAPKis and treated with NNC and/or PPMP for 5 days (representative of n = 3). (F and G) Waterfall plots showing (F) the STR and (G) the BR of A375M-derived melanomas to PLX4720 alone or in combination with NNC, PPMP, or NNC+PPMP. Values represent percentage volume change of each tumor from baseline. (H) Kaplan-Meier curves showing PFS of mice bearing A375M-derived melanomas, fed with PLX4720 chow and simultaneously treated with vehicle, NNC, PPMP, or NNC+PPMP. See detailed experimental design in Supplemental Figure 9A. (I) Kaplan-Meier curves showing OS of A375M tumor–bearing mice treated with vehicle, NNC, PPMP, or NNC+PPMP after relapsed (PLX4720-resistant) tumor reached a volume of 400 mm3. Detailed experimental design and individual tumor growth curves are shown in Supplemental Figure 9, C and D, respectively. In FI, the number of biological replicates (mice) is indicated in each graph. All mice were kept on PLX4720 chow when individual tumor first reached a volume of 200 mm3. Significance assessed by 2-way ANOVA (BD, F, and G) or log-rank test (H and I).
Figure 9
Figure 9. NNC 55-0396 and PPMP potentiate melanoma response to combined BRAF/MEK inhibition.
(A) Schematic of experimental design for BE. (B) Tumor growth curve and (C) waterfall plots showing the STR of A375M-derived melanomas to PLX4720+cobi treatment. Tumors were allowed to grow to a volume of 750 mm3 before indicated treatments started. (D) Percentage of CD36+ cells and (E) relative AGPS expression among total (CD45) tumor cells, isolated from A375M-derived melanomas following indicated treatment for 10 days. (F) Kaplan-Meier curves showing OS of mice bearing 1205Lu-VCDR–derived melanomas treated with NNC+PPMP or vehicle. All mice were kept on PLX4720 chow and simultaneously treated with cobi. NNC+PPMP treatment started when PLX4720/cobi dual-resistant tumors first reached a volume of 250 mm3. Detailed experimental design and individual tumor growth curves are shown in Supplemental Figure 9, E and F, respectively. In BF, the number of biological replicates (mice) is indicated in each graph. Data in B, D, and E represent mean ± SEM. Values in C represent percentage volume change of each tumor from baseline. Significance assessed by 2-way ANOVA (B), 2-sided unpaired t test (CE), or log-rank test (F).

References

    1. Curti BD, Faries MB. Recent advances in the treatment of melanoma. N Engl J Med. 2021;384(23):2229–2240. doi: 10.1056/NEJMra2034861. - DOI - PubMed
    1. Arozarena I, Wellbrock C. Phenotype plasticity as enabler of melanoma progression and therapy resistance. Nat Rev Cancer. 2019;19(7):377–391. doi: 10.1038/s41568-019-0154-4. - DOI - PubMed
    1. Huang F, et al. Melanoma plasticity: promoter of metastasis and resistance to therapy. Front Oncol. 2021;11:756001. doi: 10.3389/fonc.2021.756001. - DOI - PMC - PubMed
    1. Hanahan D, Weinberg RA. Hallmarks of cancer: the next generation. Cell. 2011;144(5):646–674. doi: 10.1016/j.cell.2011.02.013. - DOI - PubMed
    1. Zhang G, et al. Targeting mitochondrial biogenesis to overcome drug resistance to MAPK inhibitors. J Clin Invest. 2016;126(5):1834–1856. doi: 10.1172/JCI82661. - DOI - PMC - PubMed

Publication types

Grants and funding