. 2023 Oct 16;133(20):e152463.
doi: 10.1172/JCI152463.

A systematic analysis of the human immune response to Plasmodium vivax

Affiliations

A systematic analysis of the human immune response to Plasmodium vivax

Florian A Bach et al. J Clin Invest. .

Abstract

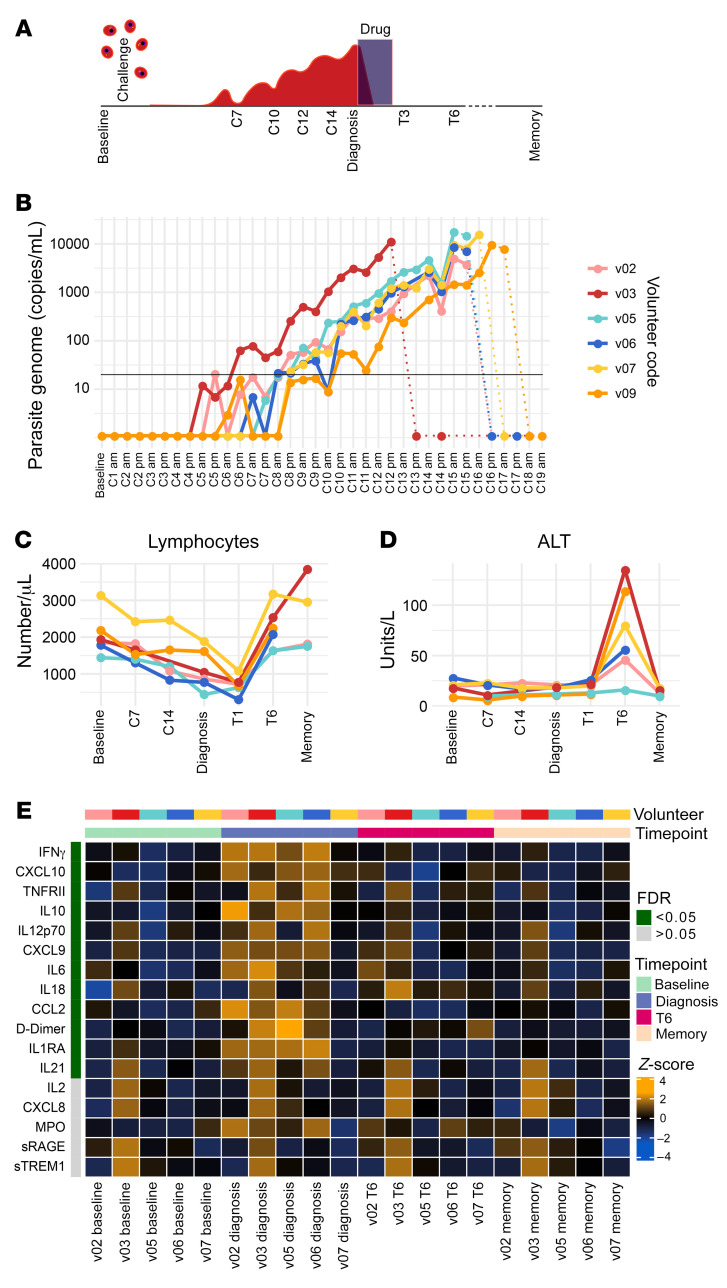
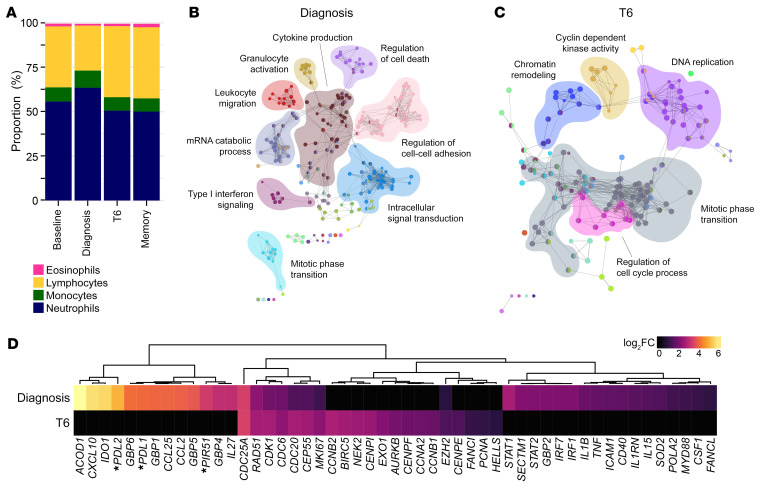
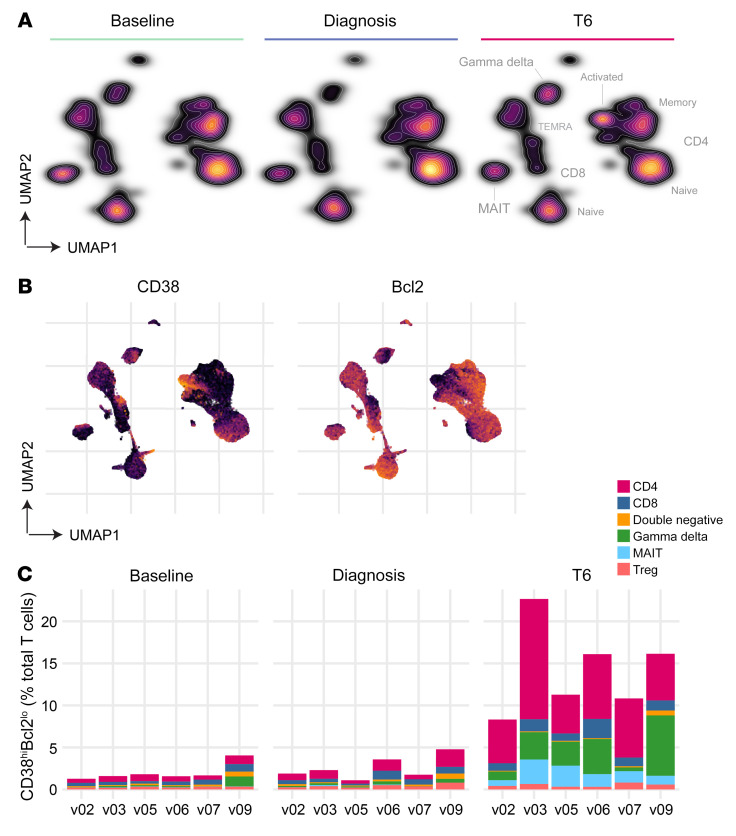
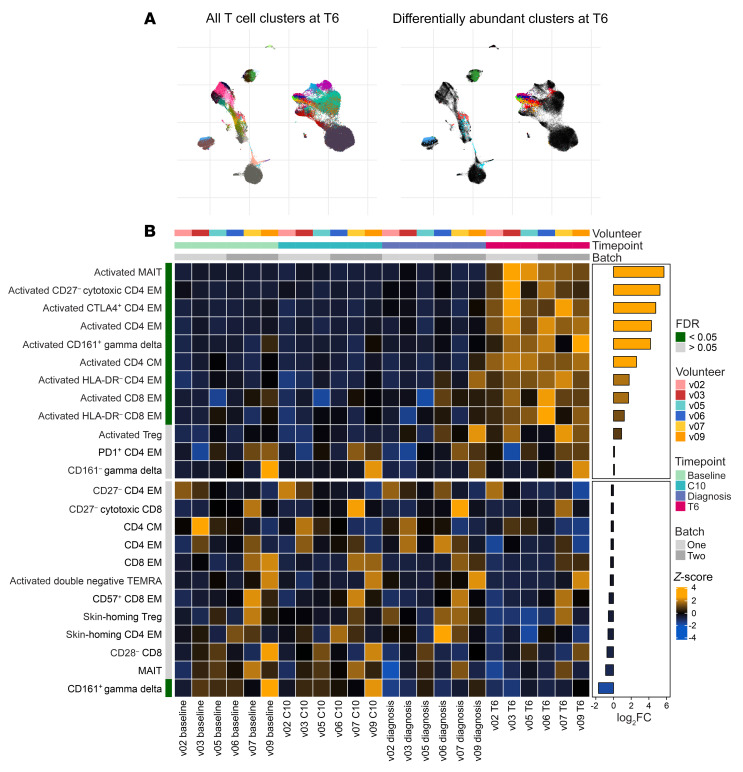
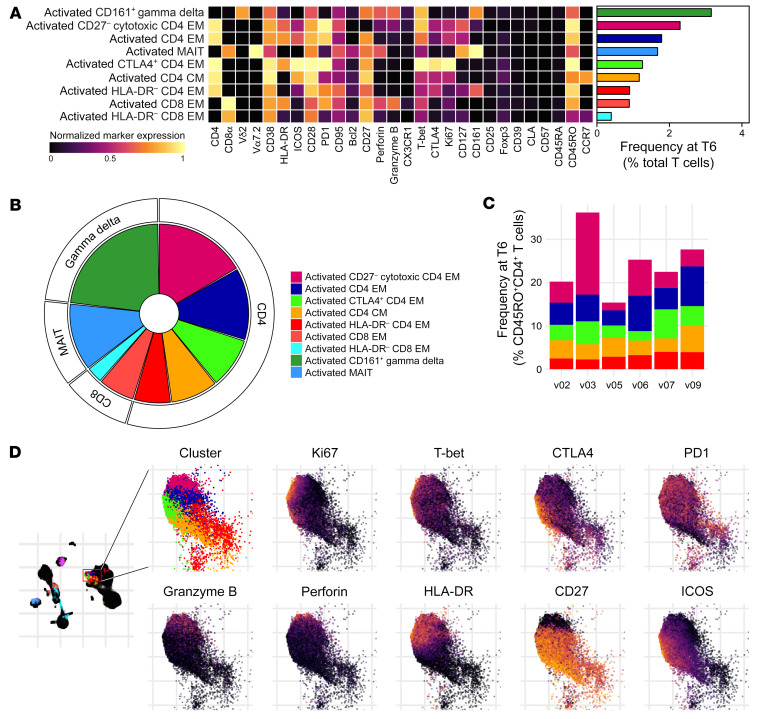
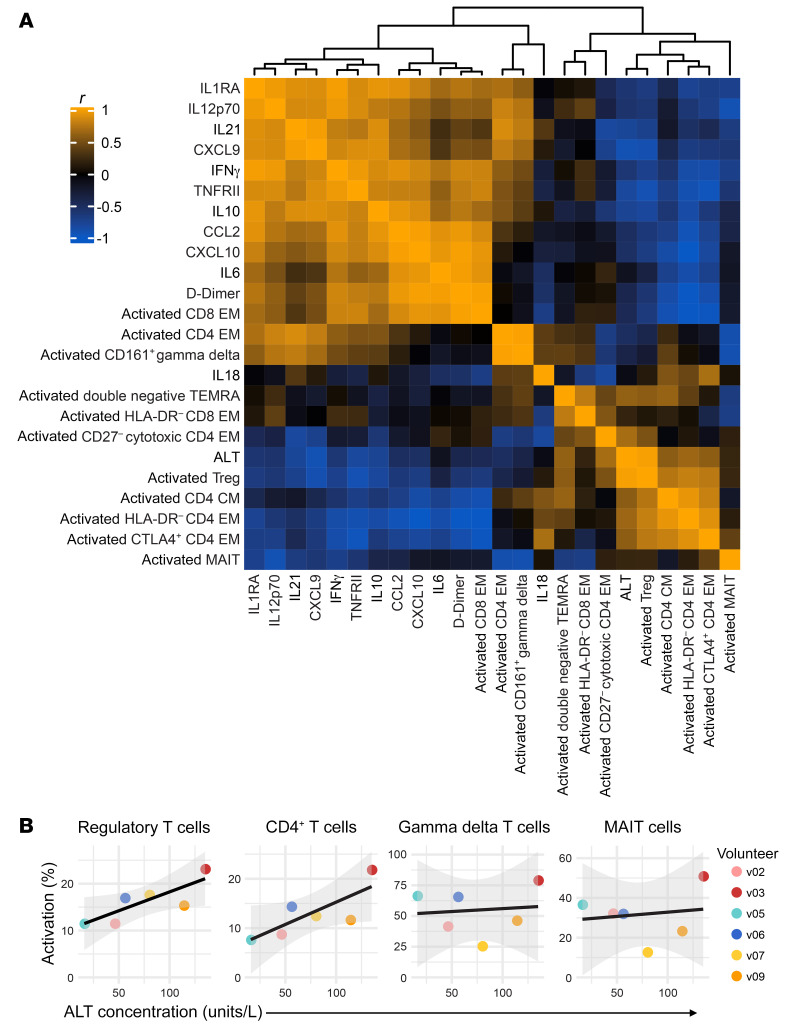
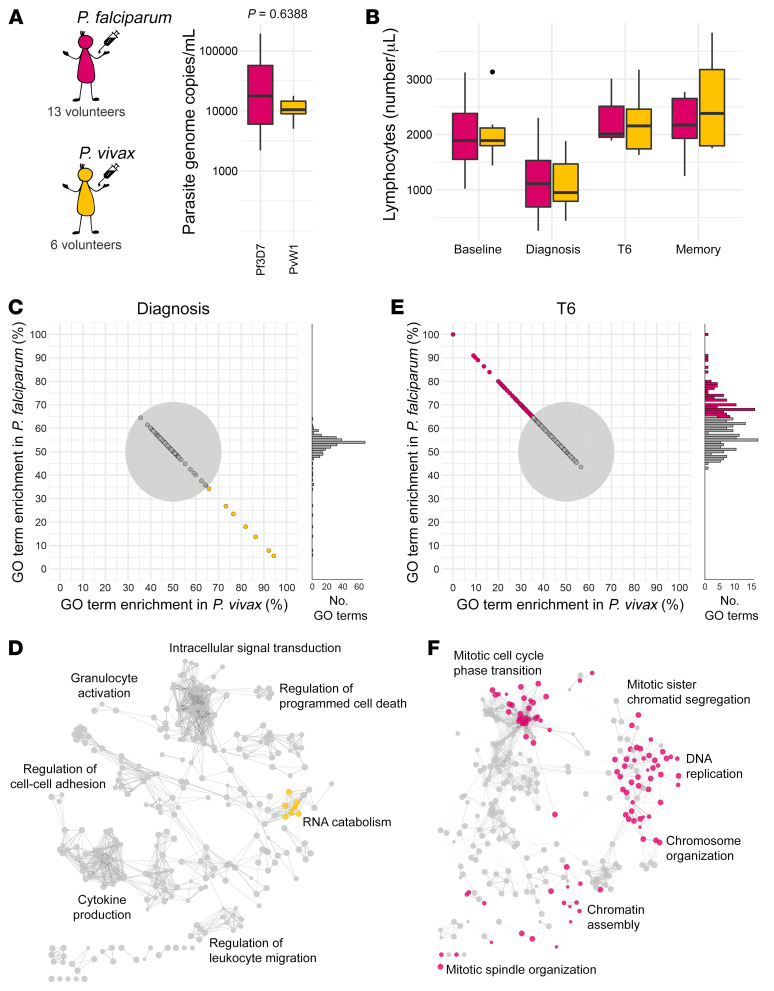
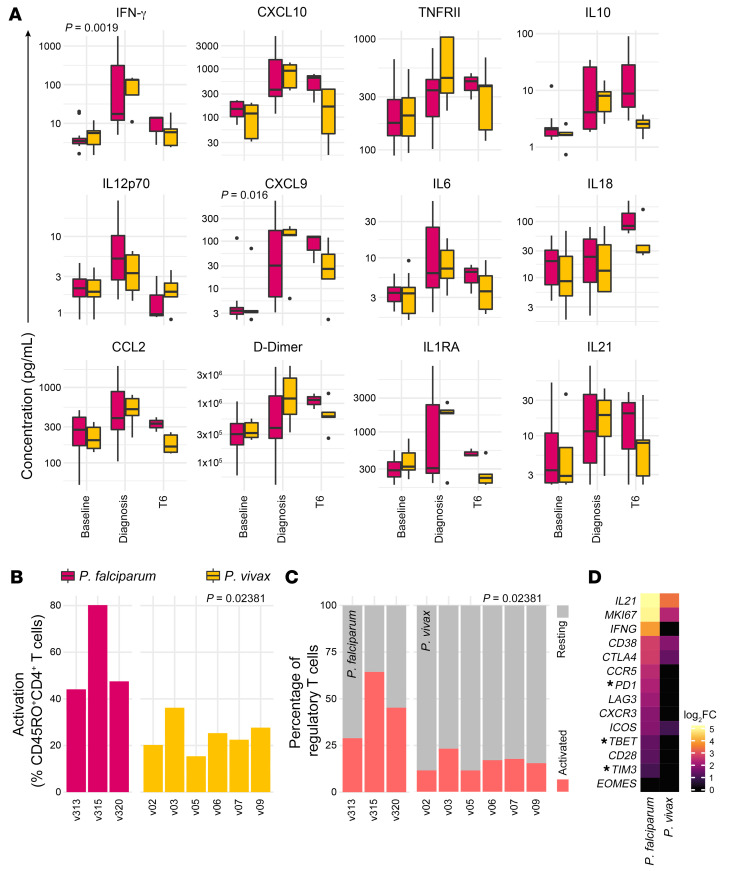
BACKGROUNDThe biology of Plasmodium vivax is markedly different from that of P. falciparum; how this shapes the immune response to infection remains unclear. To address this shortfall, we inoculated human volunteers with a clonal field isolate of P. vivax and tracked their response through infection and convalescence.METHODSParticipants were injected intravenously with blood-stage parasites and infection dynamics were tracked in real time by quantitative PCR. Whole blood samples were used for high dimensional protein analysis, RNA sequencing, and cytometry by time of flight, and temporal changes in the host response to P. vivax were quantified by linear regression. Comparative analyses with P. falciparum were then undertaken using analogous data sets derived from prior controlled human malaria infection studies.RESULTSP. vivax rapidly induced a type I inflammatory response that coincided with hallmark features of clinical malaria. This acute-phase response shared remarkable overlap with that induced by P. falciparum but was significantly elevated (at RNA and protein levels), leading to an increased incidence of pyrexia. In contrast, T cell activation and terminal differentiation were significantly increased in volunteers infected with P. falciparum. Heterogeneous CD4+ T cells were found to dominate this adaptive response and phenotypic analysis revealed unexpected features normally associated with cytotoxicity and autoinflammatory disease.CONCLUSIONP. vivax triggers increased systemic interferon signaling (cf P. falciparum), which likely explains its reduced pyrogenic threshold. In contrast, P. falciparum drives T cell activation far in excess of P. vivax, which may partially explain why falciparum malaria more frequently causes severe disease.TRIAL REGISTRATIONClinicalTrials.gov NCT03797989.FUNDINGThe European Union's Horizon 2020 Research and Innovation programme, the Wellcome Trust, and the Royal Society.

Keywords: Immunology; Infectious disease; Malaria.


Conflict of interest statement

Conflict of interest: YT is a contributor to intellectual property (ChAdOx1 nCOV-19 Clinical Data) licensed by Oxford University Innovation to AstraZeneca (no. 18003 DD002).

Figures

Figure 1
Figure 1. Plasmodium vivax triggers IFN-stimulated inflammation.
(A) Study design and sampling time points. (B) Circulating parasite density was determined twice daily by qPCR. Pretreatment measurements are shown as solid lines, posttreatment measurements as dotted lines. The limit of quantification (20 genome copies/mL) is shown by a black line. (C and D) Full blood counts and blood chemistry measured (C) lymphocyte frequencies and (D) the concentration of alanine aminotransferase (ALT) throughout infection and convalescence. In BD, each line represents 1 volunteer (n = 6). (E) Multiplexed plasma analytes were measured using a custom Legendplex assay. Each row in the heatmap is an analyte and each column a plasma sample. Samples from v09 were excluded after failing QC (n = 5). Linear regression was used to identify analytes that varied across the volunteer cohort at each time point (compared with baseline) and these are ordered by FDR. FDR < 0.05 was considered significant after adjusting for multiple testing (Benjamini-Hochberg). Only 17 of the 39 analytes measured are shown (those with the lowest FDR) and the color of each tile corresponds to the row-wise z score–transformed concentrations. In C and D, the memory time point is 90 days after challenge and in E, memory is 45 days after challenge.
Figure 2
Figure 2. Inflammation is followed by a transcriptional signature of proliferation.
(A) Proportion of lymphocytes, monocytes, neutrophils, and eosinophils in whole blood at baseline, diagnosis, T6, and 90 days after challenge (memory). The mean frequency is shown for each time point (n = 6). Note that the relative increase in abundance of myeloid cells between baseline and diagnosis is 13.6%. (B and C) Genes that were differentially expressed in whole blood at diagnosis (B) and T6 (C) (relative to baseline, Padj < 0.05 and fold-change > 1.5) were used to create a gene ontology (GO) network in ClueGO. Each node represents a GO term and node size is determined by enrichment-adjusted P value. GO terms that share more than 40% of genes are connected by a line and organized into discrete functional groups (each given a unique color). The major functional groups are highlighted and labeled with a representative GO term. (D) The log2(fold-change) (log2FC) of signature genes associated with IFN signaling, type I inflammation, and proliferation are shown in whole blood at diagnosis and T6 (relative to baseline). Genes are ordered by unsupervised hierarchical clustering (denoted by the dendrogram) and those that were not differentially expressed (Padj > 0.05) are shown with a fold-change of zero. Asterisks indicate that common gene names have been used. In BD, n = 6 per time point.
Figure 3
Figure 3. Proliferation coincides with the appearance of activated T cells.
Whole blood was preserved within 30 minutes of blood draw at baseline, C10, diagnosis, and T6. Samples were stained with a T cell–focused antibody panel (details in Supplemental Table 2) and acquired on a Helios mass cytometer. (A) UMAP plot colored by cell density and split by time point; labels indicating the location of each major T cell subset are shown (refer to Supplemental Figure 1 for the expression of lineage and memory markers). (B) Expression of CD38 and Bcl2 across the UMAP projection at T6; each marker is independently scaled for visualization. In A and B, data from all volunteers were concatenated and split by time point (n = 6). (C) Stacked bar chart showing the sum of activated (CD38hiBcl2lo) T cells at each time point; each bar represents 1 volunteer (n = 6) and bars are color-coded by lineage.
Figure 4
Figure 4. Plasmodiumvivax activates every T cell lineage.
(A) UMAP plot showing all 34 T cell clusters (left) and those that were differentially abundant at T6 (right) (relative to baseline, FDR < 0.05 and fold-change > 2). Data from all volunteers and time points were concatenated for clustering, and each cluster has a unique color. (B) Heatmap showing the relative abundance of T cell clusters through time. Each row is a T cell cluster and each column a sample; clusters are ordered by log2(fold-change) (log2FC) at T6 (relative to baseline). Only 24 of the 34 T cell clusters are shown (those with the lowest FDR) and tiles are colored according to row-wise z scores of (arcsine square root–transformed) cluster frequencies. In A and B, n = 6 per time point. EM, effector memory; CM, central memory.
Figure 5
Figure 5. Activated T cells are functionally heterogeneous.
(A) Heatmap showing normalized median expression values of all markers used for clustering in each of the 9 T cell clusters that were differentially abundant at T6. The horizontal bar chart shows the average frequency of each cluster across all volunteers. (B) Pie chart showing the relative size of each differentially abundant T cell cluster at T6. (C) Stacked bar chart showing the sum of activated CD4+ T cells at T6; each bar represents 1 volunteer. Data are shown as a proportion of the total non-naive CD45RO+CD4+ T cell pool. (D) UMAP plot showing the expression of activation, proliferation, and differentiation markers across each of the CD4+ T cell clusters that were differentially abundant at T6; each marker is independently scaled using arcsine-transformed signal intensity. The expression of these markers is shown across the entire UMAP plot in Supplemental Figure 5. In AD, n = 6 and T cell clusters are color-coded according to the legend in B. EM, effector memory; CM, central memory.
Figure 6
Figure 6. T cell activation is independent of systemic inflammation.
(A) Heatmap showing a Pearson’s correlation matrix of the log2-transformed fold-change of each activated T cell cluster and the 12 most variable plasma analytes (FDR < 0.05). The fold-change was calculated either at diagnosis or T6 (relative to baseline) according to when this was largest for each feature. The absolute concentration of plasma ALT at T6 (the peak of the response) is also included. The order of features was determined by hierarchical clustering and the associated dendrogram is shown at the top of the heatmap. (B) Correlation between ALT concentration and the frequency of activated (CD38hiBcl2lo) T cells at T6. Note that innate-like and adaptive T cell clusters belonging to the same lineage were merged to analyze their relationship with collateral tissue damage at a subset level. Regression lines are shown in black and the 95% confidence intervals in gray. In A and B, n = 6 per time point. EM, effector memory; CM, central memory.
Figure 7
Figure 7. The host response is shaped by parasite species.
(A) The maximum circulating parasite density in each volunteer during the VAC063/VAC063C CHMI trials (Plasmodium falciparum) and the VAC069A study (Plasmodium vivax). Significance between parasite species was assessed by 2-tailed Wilcoxon’s rank-sum exact test. (B) The total number of circulating lymphocytes through infection and convalescence; the memory time point is 90 days after challenge. In A and B, box (median and IQR) and whisker (1.5× upper or lower IQR) plots are shown with outliers as dots; n = 13 for P. falciparum and n = 6 for P. vivax (except at T6, where n = 3 for P. falciparum). (CF) Whole blood RNA sequencing was performed identically during the VAC063/VAC063C and VAC069A studies and lists of differentially expressed genes (Padj < 0.05 and fold-change > 1.5) were combined for GO analysis at diagnosis and T6. Importantly, for every GO term the fraction of associated genes derived from each volunteer cohort was retained. (C and E) Each GO term is represented by a single point and these are positioned according to the proportion of genes that were differentially expressed in volunteers infected with P. falciparum or P. vivax. The gray circle represents a 65% threshold that needed to be crossed to call a GO term as predominantly derived from 1 volunteer cohort; beyond this threshold GO terms are colored by enrichment as shown in A. (D and F) ClueGO networks reveal the functional organization of GO terms at diagnosis (D) and T6 (F); nodes are color-coded by enrichment (shared GO terms are shown in gray) and each of the major functional groups is labeled with a representative GO term. In C and D, n = 13 for P. falciparum and n = 6 for P. vivax and in E and F, n = 3 and 6, respectively.
Figure 8
Figure 8. Parasite species regulate T cell activation and differentiation.
(A) Multiplexed plasma analytes were measured in the VAC063/VAC063C and VAC069A CHMI studies using a custom Legendplex assay. Linear regression was used to identify analytes that vary significantly between volunteer cohorts at diagnosis and/or T6 (relative to baseline). After correcting for multiple comparisons (Benjamini-Hochberg), only 2 of 39 analytes were significant (Padj < 0.05 at diagnosis). The 12 plasma analytes shown all varied significantly through time in Plasmodium vivax–infected volunteers (as shown in Figure 1E). Box (median and IQR) and whisker (1.5× upper or lower IQR) plots are shown with outliers as dots; n = 12 for Plasmodium falciparum at baseline/diagnosis and n = 3 at T6; n = 5 for P. vivax at all time points. Note that samples from v1040 (VAC063) and v09 (VAC069A) were excluded after failing QC. (B and C) The proportion of non-naive CD45RO+CD4+ T cells (B) and Tregs (C) activated (CD38hiBcl2lo) at T6 in volunteers infected with P. falciparum or P. vivax. FlowSOM was used to identify activated T cell clusters independently in each volunteer cohort and the frequency of activated clusters were summed; each bar represents 1 volunteer. Significance between parasite species was assessed by 2-tailed Wilcoxon’s rank-sum exact test. (D) Heatmap of signature T cell genes showing their log2(fold-change) (log2FC) at T6 (relative to baseline) in whole blood analyzed by RNA sequencing; n = 3 for P. falciparum and n = 6 for P. vivax. Asterisks indicate that common gene names were used and genes that were not differentially expressed (Padj > 0.05) are shown with a fold-change of zero.

References

    1. Battle KE, et al. Mapping the global endemicity and clinical burden of Plasmodium vivax, 2000-17: a spatial and temporal modelling study. Lancet. 2019;394(10195):332–343. doi: 10.1016/S0140-6736(19)31096-7. - DOI - PMC - PubMed
    1. Thriemer K, et al. The risk of adverse clinical outcomes following treatment of Plasmodium vivax malaria with and without primaquine in Papua, Indonesia. PLoS Negl Trop Dis. 2020;14(11):e0008838. doi: 10.1371/journal.pntd.0008838. - DOI - PMC - PubMed
    1. Kho S, et al. Hidden biomass of intact malaria parasites in the human spleen. N Engl J Med. 2021;384(21):2067–2069. doi: 10.1056/NEJMc2023884. - DOI - PubMed
    1. Obaldia N, et al. Bone marrow is a major parasite reservoir in plasmodium vivax infection. mBio. 2018;9(3):e00625-18. doi: 10.1128/mBio.00625-18. - DOI - PMC - PubMed
    1. Rahimi BA, et al. Severe vivax malaria: a systematic review and meta-analysis of clinical studies since 1900. Malar J. 2014;13:481. doi: 10.1186/1475-2875-13-481. - DOI - PMC - PubMed

Publication types

Associated data