Policy abstraction as a predictor of cognitive effort avoidance
- PMID: 37616076
- PMCID: PMC10840644
- DOI: 10.1037/xge0001449
Policy abstraction as a predictor of cognitive effort avoidance
Abstract
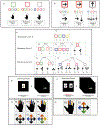
Consistent evidence has established that people avoid cognitively effortful tasks. However, the features that make a task cognitively effortful are still not well understood. Multiple hypotheses have been proposed regarding which task demands underlie cognitive effort costs, such as time-on-task, error likelihood, and the general engagement of cognitive control. In this study, we test the novel hypothesis that tasks requiring behavior according to higher degrees of policy abstraction are experienced as more effortful. Accordingly, policy abstraction, operationalized as the levels of contextual contingency required by task rules, drives task avoidance over and above the effects of task performance, such as time-on-task or error likelihood. To test this hypothesis, we combined two previously established cognitive control tasks that parametrically manipulated policy abstraction with the demand selection task procedure. The design of these tasks allowed us to test whether people avoided tasks with higher order policy abstraction while controlling for the contribution of factors such as time-on-task and expected error rate (ER). Consistent with our hypothesis, we observed that policy abstraction was the strongest predictor of cognitive effort choices, followed by ER. This was evident across both studies and in a within-subject cross-study analysis. These results establish at least one task feature independent of performance, which is predictive of task avoidance behavior. We interpret these results within an opportunity cost framework for understanding aversive experiences of cognitive effort while performing a task. (PsycInfo Database Record (c) 2023 APA, all rights reserved).
Figures


Similar articles
-
Neural systems of cognitive demand avoidance.Neuropsychologia. 2019 Feb 4;123:41-54. doi: 10.1016/j.neuropsychologia.2018.06.016. Epub 2018 Jun 23. Neuropsychologia. 2019. PMID: 29944865 Free PMC article.
-
Neural Mechanisms for Adaptive Learned Avoidance of Mental Effort.J Neurosci. 2018 Mar 7;38(10):2631-2651. doi: 10.1523/JNEUROSCI.1995-17.2018. Epub 2018 Feb 5. J Neurosci. 2018. PMID: 29431647 Free PMC article.
-
Do humans prefer cognitive effort over doing nothing?J Exp Psychol Gen. 2023 Apr;152(4):1069-1079. doi: 10.1037/xge0001320. Epub 2022 Nov 10. J Exp Psychol Gen. 2023. PMID: 36355768
-
On the social nature of abstraction: cognitive implications of interaction and diversity.Philos Trans R Soc Lond B Biol Sci. 2023 Feb 13;378(1870):20210361. doi: 10.1098/rstb.2021.0361. Epub 2022 Dec 26. Philos Trans R Soc Lond B Biol Sci. 2023. PMID: 36571125 Free PMC article. Review.
-
The unpleasantness of thinking: A meta-analytic review of the association between mental effort and negative affect.Psychol Bull. 2024 Sep;150(9):1070-1093. doi: 10.1037/bul0000443. Epub 2024 Aug 5. Psychol Bull. 2024. PMID: 39101924 Review.
Cited by
-
Binding of response-independent task rules.Psychon Bull Rev. 2024 Aug;31(4):1821-1832. doi: 10.3758/s13423-024-02465-9. Epub 2024 Feb 1. Psychon Bull Rev. 2024. PMID: 38302791 Free PMC article.
-
Cognitive Control.Annu Rev Psychol. 2025 Jan;76(1):167-195. doi: 10.1146/annurev-psych-022024-103901. Epub 2024 Dec 3. Annu Rev Psychol. 2025. PMID: 39378283 Free PMC article. Review.
-
Need for cognition moderates the relief of avoiding cognitive effort.PLoS One. 2023 Nov 16;18(11):e0287954. doi: 10.1371/journal.pone.0287954. eCollection 2023. PLoS One. 2023. PMID: 37972115 Free PMC article.
-
Wagers for work: Decomposing the costs of cognitive effort.PLoS Comput Biol. 2024 Apr 29;20(4):e1012060. doi: 10.1371/journal.pcbi.1012060. eCollection 2024 Apr. PLoS Comput Biol. 2024. PMID: 38683857 Free PMC article.
-
Distinct neural mechanisms for action access and execution in the human brain: insights from an fMRI study.Cereb Cortex. 2024 Apr 1;34(4):bhae163. doi: 10.1093/cercor/bhae163. Cereb Cortex. 2024. PMID: 38629799 Free PMC article.
References
-
- Alexander WH, & Brown JW (2015). Hierarchical error representation: a computational model of anterior cingulate and dorsolateral prefrontal cortex. Neural Computation, 27(11), 2354–2410. - PubMed
-
- Anderson DR, & Burnham KP (2002). Avoiding pitfalls when using information-theoretic methods. The Journal of wildlife management, 912–918.
MeSH terms
Grants and funding
LinkOut - more resources
Full Text Sources

