

Sequence-oriented sensitive analysis for PM2.5 exposure and risk assessment using interactive process mining
- PMID: 37616197
- PMCID: PMC10449204
- DOI: 10.1371/journal.pone.0290372
Sequence-oriented sensitive analysis for PM2.5 exposure and risk assessment using interactive process mining
Abstract
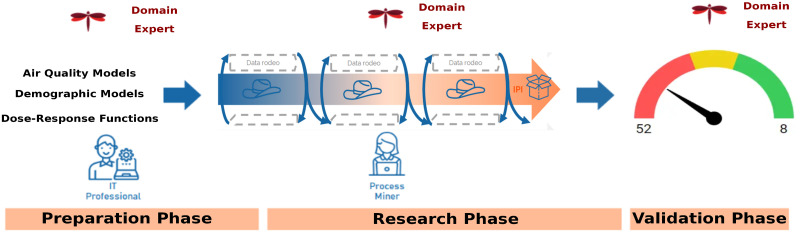
The World Health Organization has estimated that air pollution will be one of the most significant challenges related to the environment in the following years, and air quality monitoring and climate change mitigation actions have been promoted due to the Paris Agreement because of their impact on mortality risk. Thus, generating a methodology that supports experts in making decisions based on exposure data, identifying exposure-related activities, and proposing mitigation scenarios is essential. In this context, the emergence of Interactive Process Mining-a discipline that has progressed in the last years in healthcare-could help to develop a methodology based on human knowledge. For this reason, we propose a new methodology for a sequence-oriented sensitive analysis to identify the best activities and parameters to offer a mitigation policy. This methodology is innovative in the following points: i) we present in this paper the first application of Interactive Process Mining pollution personal exposure mitigation; ii) our solution reduces the computation cost and time of the traditional sensitive analysis; iii) the methodology is human-oriented in the sense that the process should be done with the environmental expert; and iv) our solution has been tested with synthetic data to explore the viability before the move to physical exposure measurements, taking the city of Valencia as the use case, and overcoming the difficulty of performing exposure measurements. This dataset has been generated with a model that considers the city of Valencia's demographic and epidemiological statistics. We have demonstrated that the assessments done using sequence-oriented sensitive analysis can identify target activities. The proposed scenarios can improve the initial KPIs-in the best scenario; we reduce the population exposure by 18% and the relative risk by 12%. Consequently, our proposal could be used with real data in future steps, becoming an innovative point for air pollution mitigation and environmental improvement.
Copyright: © 2023 Illueca Fernández et al. This is an open access article distributed under the terms of the Creative Commons Attribution License, which permits unrestricted use, distribution, and reproduction in any medium, provided the original author and source are credited.
Conflict of interest statement
The authors have declared that no competing interests exist.
Figures


References
-
- Organization WH, et al. Review of evidence on health aspects of air pollution: REVIHAAP project: technical report. World Health Organization. Regional Office for Europe; 2021. - PubMed
-
- Ortiz A, Guerreiro C, Soares J, et al.. Air quality in Europe-2020 report. Europea n Environment Agency. 2020; p. 164–164.
-
- Cohen AJ, Brauer M, Burnett R, Anderson HR, Frostad J, Estep K, et al.. Estimates and 25-year trends of the global burden of disease attributable to ambient air pollution: an analysis of data from the Global Burden of Diseases Study 2015. The lancet. 2017;389(10082):1907–1918. doi: 10.1016/S0140-6736(17)30505-6 - DOI - PMC - PubMed
