. 2023 Aug 24;21(8):e3002171.
doi: 10.1371/journal.pbio.3002171. eCollection 2023 Aug.

Maternal emulsifier consumption programs offspring metabolic and neuropsychological health in mice

Affiliations

Maternal emulsifier consumption programs offspring metabolic and neuropsychological health in mice

Maria Milà-Guasch et al. PLoS Biol. .

Abstract

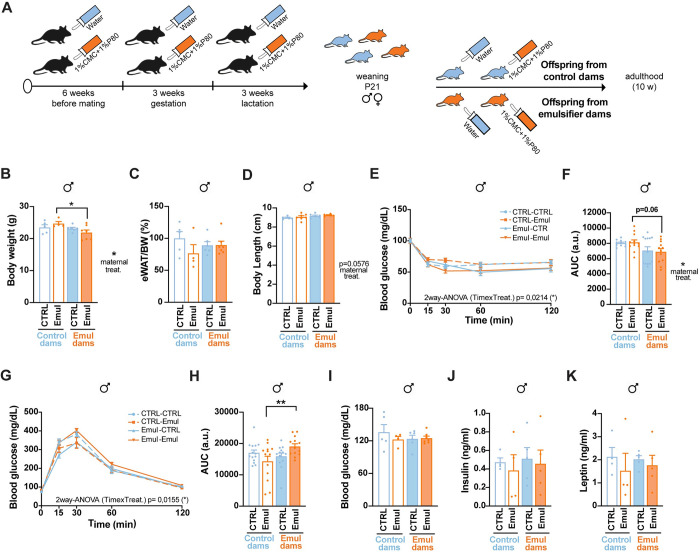
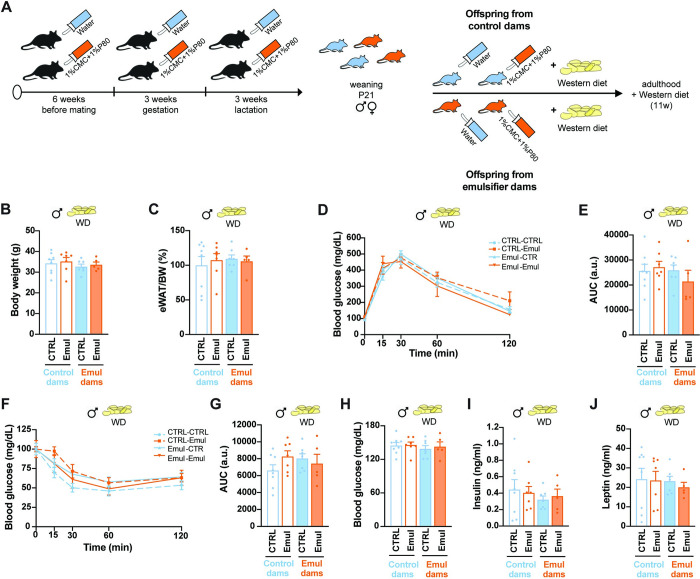
Modern lifestyle is associated with a major consumption of ultra-processed foods (UPF) due to their practicality and palatability. The ingestion of emulsifiers, a main additive in UPFs, has been related to gut inflammation, microbiota dysbiosis, adiposity, and obesity. Maternal unbalanced nutritional habits during embryonic and perinatal stages perturb offspring's long-term metabolic health, thus increasing obesity and associated comorbidity risk. However, whether maternal emulsifier consumption influences developmental programming in the offspring remains unknown. Here, we show that, in mice, maternal consumption of dietary emulsifiers (1% carboxymethyl cellulose (CMC) and 1% P80 in drinking water), during gestation and lactation, perturbs the development of hypothalamic energy balance regulation centers of the progeny, leads to metabolic impairments, cognition deficits, and induces anxiety-like traits in a sex-specific manner. Our findings support the notion that maternal consumption of emulsifiers, common additives of UPFs, causes mild metabolic and neuropsychological malprogramming in the progeny. Our data call for nutritional advice during gestation.


Conflict of interest statement

The authors have declared that no competing interests exist.

Figures

Fig 1
Fig 1. Emulsifiers induce mild glucose intolerance in female mice before the onset of pregnancy.
(A) Experimental design of maternal emulsifier consumption highlighting the period of maternal characterization. (B) Daily water consumption of control and emulsifier–treated females before mating (n = 5/group). (C) Daily food intake of control and emulsifier–treated females before mating (n = 5/group). (D) Body weight of control and emulsifier–treated females before mating (n = 10 CTRL and n = 10 Emul). (E) GTT and (F) AUC of control and emulsifier females before mating (n = 10 CTRL and n = 10 Emul). (G) Fasting blood glucose levels of control and emulsifier–supplemented females before mating (n = 10 CTRL and n = 10 Emul). (H) Plasma leptin levels after 6 h in fasting of control and emulsifier–treated females before mating (n = 8 CTRL and n = 8 Emul). Data are derived from 1 single experiment. Data are expressed as mean ± SEM. Statistical analysis was performed with an unpaired t test in B, C, D, F, G, H, and by two–way ANOVA followed by Sidak’s post hoc analysis in E. *p < 0.05. The data underlying this figure can be found at DOI:10.6084/m9.figshare.22742759. AUC, area under the curve; GTT, glucose tolerance test.
Fig 2
Fig 2. Maternal emulsifier consumption leads to mild metabolic impairments at weaning.
(A) Experimental design of maternal emulsifier consumption and offspring collection at weaning. (B) Body length at weaning of male (n = 9 CTRL and n = 6 Emul) and female (n = 13 CTRL and n = 6 Emul) offspring from control and emulsifier–exposed dams. (C) Body weight at weaning of male (n = 9 CTRL and n = 12 Emul) and female (n = 11 CTRL and n = 12 Emul) offspring from control and emulsifier–exposed dams. (D) Epididymal and gWAT weight normalized by total body weight and represented as % of control animals in male (n = 9 CTRL and n = 12 Emul) and female (n = 11 CTRL and n = 12 Emul) offspring from control and emulsifier–exposed dams at weaning. (E) GTT and (F) AUC in male (n = 20 CTRL and n = 19 Emul) offspring from control and emulsifier–exposed dams at weaning. (G) ITT and (H) AUC in male (n = 8 CTRL and n = 4 Emul) offspring from control and emulsifier–exposed dams at weaning. (I) Six–hour fasting blood glucose levels in male (n = 9 CTRL and n = 10 Emul) and female (n = 11 CTRL and n = 11 Emul) offspring from control and emulsifier–exposed dams at weaning. (J) Plasma insulin levels in male (n = 8 CTRL and n = 10 Emul) and female (n = 10 CTRL and n = 11 Emul) offspring from control and emulsifier–exposed dams at weaning after 6 h of fasting. (K) Plasma leptin levels in male (n = 8 CTRL and n = 8 Emul) and female (n = 10 CTRL and n = 11 Emul) offspring from control and emulsifier–exposed dams at weaning after 6 h of fasting. (L) Plasma leptin levels across postnatal development (P7–P10–P13–P21) (P7 n = 6 CTRL and n = 5 Emul; P10 n = 6 CTRL and n = 6 Emul; P13 n = 6 CTRL and n = 6 Emul; P21 n = 8 CTRL and n = 8 Emul) in male offspring from control and emulsifier–exposed dams. (M) Peak plasma leptin levels at P10 (n = 6 CTRL and n = 6 Emul) in male offspring from control and emulsifier–exposed dams. (N) GTT and (O) AUC in female (n = 19 CTRL and n = 21 Emul) offspring from control and emulsifier–exposed dams at weaning. (P) ITT and (Q) AUC in female (n = 5 CTRL and n = 5 Emul) offspring from control and emulsifier–exposed dams at weaning. (R) Plasma leptin levels across postnatal development (P7–P10–P13–P21) (P7 n = 6 CTRL and n = 4 Emul; P10 n = 6 CTRL and n = 4 Emul; P13 n = 6 CTRL and n = 4 Emul; P21 n = 10 CTRL and n = 11 Emul) in female offspring from control and emulsifier–exposed dams. Data in B, G, H, L, M, P, Q, and R are derived from 1 single experiment. Data in C, D, E, F, I, J, K, N, and O are pools from 2 different experiments. Data are expressed as mean ± SEM. Statistical analysis was performed by unpaired t test in B, C, D, F, H, I, J, K, M, O, and Q and two–way ANOVA followed by Sidak’s post hoc analysis in E, G, N, and P. Panels L and R were analyzed using a two–way ANOVA mixed effects. *p < 0.05; **p < 0.01. The data underlying this figure can be found at DOI:10.6084/m9.figshare.22742759. AUC, area under the curve; GTT, glucose tolerance test; gWAT, gonadal white adipose tissue; ITT, insulin tolerance test.
Fig 3
Fig 3. Hypothalamic feeding–related neuropeptides are altered upon maternal emulsifier consumption.
(A) Volcano plot of transcript expression in the MBH between control and emulsifier offspring at weaning. Threshold for FC (±1.5) and FDR (p < 0.05) was considered. DEGs upon maternal emulsifier consumption are depicted in blue (down–regulated) and orange (up–regulated). Unchanged genes are represented in black (n = 4 CTRL and n = 5 Emul). (B) Cytoscape plot of the down–regulated enriched pathways (p < 0.05) in the offspring of emulsifier–exposed dams. (C) Transcript expression of orexigenic and anorexigenic peptides in the MBH in male offspring from control and emulsifier–exposed dams at weaning (n = 4 CTRL and n = 5 Emul). (D) Transcript expression of orexigenic and anorexigenic peptides in the MBH in female offspring from control and emulsifier–exposed dams at weaning (n = 7 CTRL and n = 7 Emul). (E) Representative immunofluorescence images showing AgRP staining density in the PVH of control and emulsifier male offspring at weaning and integrated density quantification (n = 6 mice/group). (F) Representative immunofluorescence images showing α–MSH staining density in the PVH of control and emulsifier male offspring at weaning and integrated density quantification (n = 5 mice/group). Data in C and D are derived from 1 single experiment. Data in E and F are pools from 2 different experiments. Data are expressed as mean ± SEM. Statistical analysis was performed by unpaired t test in C, D, E, and F. *p < 0.05; ***p < 0.001. The data underlying this figure can be found at DOI:10.6084/m9.figshare.22742759. Pomc, pro–opiomelanocortin; Cart, cocaine–and amphetamine–regulated transcript; Agrp, agouti–related peptide; Npy, neuropeptide Y; Pcsk1, proprotein convertase 1; Mcr3, melanocortin 3 receptor; Mcr4, melanocortin 4 receptor; α–MSH, alpha–melanocyte–stimulating hormone; PVH, paraventricular hypothalamic nucleus; 3V, third ventricle; DEG, differentially expressed gene; FC, fold change; FDR, false discovery rate; MBH, mediobasal hypothalamus.
Fig 4
Fig 4. Maternal emulsifier consumption leads to mild long–term metabolic impairments in male offspring.
(A) Schematic illustration of offspring treatment until adulthood (10 weeks of age). (B) Body weight at 10 weeks of age (n = 5 CTRL–CTRL; n = 4 CTRL–Emul; n = 6 Emul–CTRL; n = 7 Emul–Emul). (C) eWAT weight normalized by total body weight and represented as % of control animals at 10 weeks of age (n = 5 CTRL–CTRL; n = 4 CTRL–Emul; n = 6 Emul–CTRL; n = 7 Emul–Emul). (D) Body length at 10 weeks of age (n = 5 CTRL–CTRL; n = 7 CTRL–Emul; n = 6 Emul–CTRL; n = 5 Emul–Emul). (E) ITT and (F) AUC (n = 11 CTRL–CTRL; n = 12 CTRL–Emul; n = 13 Emul–CTRL; n = 12 Emul–Emul) at 10 weeks of age. (G) GTT and (H) AUC (n = 14 CTRL–CTRL; n = 13 CTRL–Emul; n = 13 Emul–CTRL; n = 13 Emul–Emul) at 10 weeks of age. (I) Six–hour fasting blood glucose levels (n = 5 CTRL–CTRL; n = 4 CTRL–Emul; n = 6 Emul–CTRL; n = 7 Emul–Emul) at 10 weeks of age. (J) Plasma insulin levels after 6 h of fasting at 10 weeks of age (n = 4 CTRL–CTRL; n = 4 CTRL–Emul; n = 5 Emul–CTRL; n = 5 Emul–Emul). (K) Plasma leptin levels after 6 h of fasting at 10 weeks of age (n = 4 CTRL–CTRL; n = 4 CTRL–Emul; n = 5 Emul–CTRL; n = 5 Emul–Emul). Data in B, C, D, I, J, and K are derived from 1 single experiment. Data in E, F, G, and H are pools from 2 different experiments. Data are expressed as mean ± SEM. Statistical analysis was performed by two–way ANOVA followed by Sidak’s post hoc analysis. *p < 0.05; **p < 0.01. The data underlying this figure can be found at DOI:10.6084/m9.figshare.22742759. AUC, area under the curve; eWAT, epididymal white adipose tissue; GTT, glucose tolerance test; ITT, insulin tolerance test.
Fig 5
Fig 5. Metabolic impairments derived from western diet consumption are not exacerbated in male offspring from emulsifier–treated dams.
(A) Schematic illustration of offspring treatment until adulthood. (B) Body weight at 22 weeks of age, after 11 weeks of WD exposure (n = 8 CTRL–CTRL; n = 7 CTRL–Emul; n = 7 Emul–CTRL; n = 5 Emul–Emul). (C) eWAT weight normalized by total body weight and represented as % of control animals at 22 weeks of age, after 11 weeks of WD exposure (n = 8 CTRL–CTRL; n = 7 CTRL–Emul; n = 7 Emul–CTRL; n = 5 Emul–Emul). (D) GTT and (E) AUC (n = 8 CTRL–CTRL; n = 7 CTRL–Emul; n = 7 Emul–CTRL; n = 5 Emul–Emul) at 19 weeks of age, after 8 weeks of WD exposure. (F) ITT and (G) AUC (n = 8 CTRL–CTRL; n = 7 CTRL–Emul; n = 7 Emul–CTRL; n = 5 Emul–Emul) at 19 weeks of age, after 8 weeks of WD exposure. (H) Six–hour fasting blood glucose levels at 22 weeks of age, after 11 weeks of WD exposure (n = 8 CTRL–CTRL; n = 7 CTRL–Emul; n = 7 Emul–CTRL; n = 5 Emul–Emul). (I) Plasma insulin levels after 6 h of fasting at 22 weeks of age, after 11 weeks of WD exposure (n = 8 CTRL–CTRL; n = 7 CTRL–Emul; n = 7 Emul–CTRL; n = 5 Emul–Emul). (J) Plasma leptin levels after 6 h of fasting at 22 weeks of age, after 11 weeks of WD exposure (n = 8 CTRL–CTRL; n = 7 CTRL–Emul; n = 7 Emul–CTRL; n = 5 Emul–Emul). Data are derived from 1 single experiment. Data are expressed as mean ± SEM. Statistical analysis was performed by two–way ANOVA followed by Sidak’s post hoc analysis. The data underlying this figure can be found at DOI:10.6084/m9.figshare.22742759. AUC, area under the curve; eWAT, epididymal white adipose tissue; GTT, glucose tolerance test; ITT, insulin tolerance test; WD, western–style diet.
Fig 6
Fig 6. Metabolic outcomes derived from western diet consumption on female offspring from emulsifier–treated dams.
(A) Schematic illustration of offspring treatment until adulthood. (B) Six–hour fasting blood glucose levels at 22 weeks of age, after 11 weeks of WD exposure (n = 8 CTRL–CTRL; n = 10 CTRL–Emul; n = 8 Emul–CTRL; n = 8 Emul–Emul). (C) Plasma insulin levels after 6 h of fasting at 22 weeks of age, after 11 weeks of WD exposure (n = 8 CTRL–CTRL; n = 10 CTRL–Emul; n = 8 Emul–CTRL; n = 8 Emul–Emul). (D) Plasma leptin levels after 6 h of fasting at 22 weeks of age, after 11 weeks of WD exposure (n = 8 CTRL–CTRL; n = 10 CTRL–Emul; n = 8 Emul–CTRL; n = 8 Emul–Emul). (E) Body weight at 22 weeks of age, after 11 weeks of WD exposure (n = 8 CTRL–CTRL; n = 10 CTRL–Emul; n = 8 Emul–CTRL; n = 8 Emul–Emul). (F) gWAT weight normalized by total body weight and represented as % of control animals at 22 weeks of age, after 11 weeks of WD exposure (n = 8 CTRL–CTRL; n = 10 CTRL–Emul; n = 8 Emul–CTRL; n = 8 Emul–Emul). (G) GTT and (H) AUC (n = 8 CTRL–CTRL; n = 10 CTRL–Emul; n = 8 Emul–CTRL; n = 8 Emul–Emul) at 19 weeks of age, after 8 weeks of WD exposure. (I) ITT and (J) AUC (n = 8 CTRL–CTRL; n = 10 CTRL–Emul; n = 8 Emul–CTRL; n = 8 Emul–Emul) at 19 weeks of age, after 8 weeks of WD exposure. Data are derived from 1 single experiment. Data are expressed as mean ± SEM. Statistical analysis was performed by two–way ANOVA followed by Sidak’s post hoc analysis. *p < 0.05; **p < 0.01; ***p < 0.001. The data underlying this figure can be found at DOI:10.6084/m9.figshare.22742759. AUC, area under the curve; GTT, glucose tolerance test; gWAT, gonadal white adipose tissue; ITT, insulin tolerance test; WD, western–style diet.
Fig 7
Fig 7. Maternal emulsifier consumption disrupts offspring neuropsychological health.
(A–D) Open field performance in 23–week–old male (A and B) (n = 6 CTRL–CTRL; n = 6 CTRL–Emul; n = 6 Emul–CTRL; n = 5 Emul–Emul) and female (C and D) (n = 6 mice/group) offspring born of control and emulsifier–exposed mothers, including time spent per zone (A and C) and total distance traveled (B and D) after 12 weeks of WD exposure. (E, F) Time spent in the light compartment during the dark–light box test in 23–week–old male (E) (n = 6 CTRL–CTRL; n = 6 CTRL–Emul; n = 6 Emul–CTRL; n = 5 Emul–Emul) and female (F) (n = 6 mice/group) offspring born of control and emulsifier–exposed mothers after 12 weeks of WD exposure. (G–J) Short–term memory parameters in 24–week–old male (G and H) (n = 6 CTRL–CTRL; n = 6 CTRL–Emul; n = 6 Emul–CTRL; n = 5 Emul–Emul) and female (I and J) (n = 6 CTRL–CTRL; n = 5 CTRL–Emul; n = 5 Emul–CTRL; n = 4 Emul–Emul) offspring born of control and emulsifier–exposed mothers, after 13 weeks of WD exposure, including discrimination index (G and I) and exploratory time (H and J). Data are derived from 1 single experiment. Data are expressed as mean ± SEM. Statistical analysis was performed by two–way ANOVA followed by Sidak’s post hoc analysis. *p < 0.05; **p < 0.01. The data underlying this figure can be found at DOI:10.6084/m9.figshare.22742759. WD, western–style diet.

Comment in

References

    1. Blüher M. Obesity: global epidemiology and pathogenesis. Nat Rev Endocrinol. 2019;15:288–98. doi: 10.1038/s41574-019-0176-8 - DOI - PubMed
    1. Monteiro CA, Cannon G, Levy RB, Moubarac J– C, Louzada ML, Rauber F, et al.. Ultra–processed foods: what they are and how to identify them. Public Health Nutr. 2019;22:936–41. doi: 10.1017/S1368980018003762 - DOI - PMC - PubMed
    1. Hall KD, Ayuketah A, Brychta R, Cai H, Cassimatis T, Chen KY, et al.. Ultra–Processed Diets Cause Excess Calorie Intake and Weight Gain: An Inpatient Randomized Controlled Trial of Ad Libitum Food Intake. Cell Metab. 2019;30:67–77.e3. doi: 10.1016/j.cmet.2019.05.008 - DOI - PMC - PubMed
    1. Almarshad MI, Algonaiman R, Alharbi HF, Almujaydil MS, Barakat H. Relationship between Ultra–Processed Food Consumption and Risk of Diabetes Mellitus: A Mini–Review. Nutrients. 2022;14:2366. 10.3390/nu14122366. - DOI - PMC - PubMed
    1. Pagliai G, Dinu M, Madarena MP, Bonaccio M, Iacoviello L, Sofi F. Consumption of ultra–processed foods and health status: a systematic review and meta–analysis. Br J Nutr. 2021;125:308–18. doi: 10.1017/S0007114520002688 - DOI - PMC - PubMed

Publication types