. 2023 Aug 25;381(6660):851-857.
doi: 10.1126/science.ade0522. Epub 2023 Aug 24.

The gut microbiota reprograms intestinal lipid metabolism through long noncoding RNA Snhg9

Affiliations

The gut microbiota reprograms intestinal lipid metabolism through long noncoding RNA Snhg9

Yuhao Wang et al. Science. .

Abstract

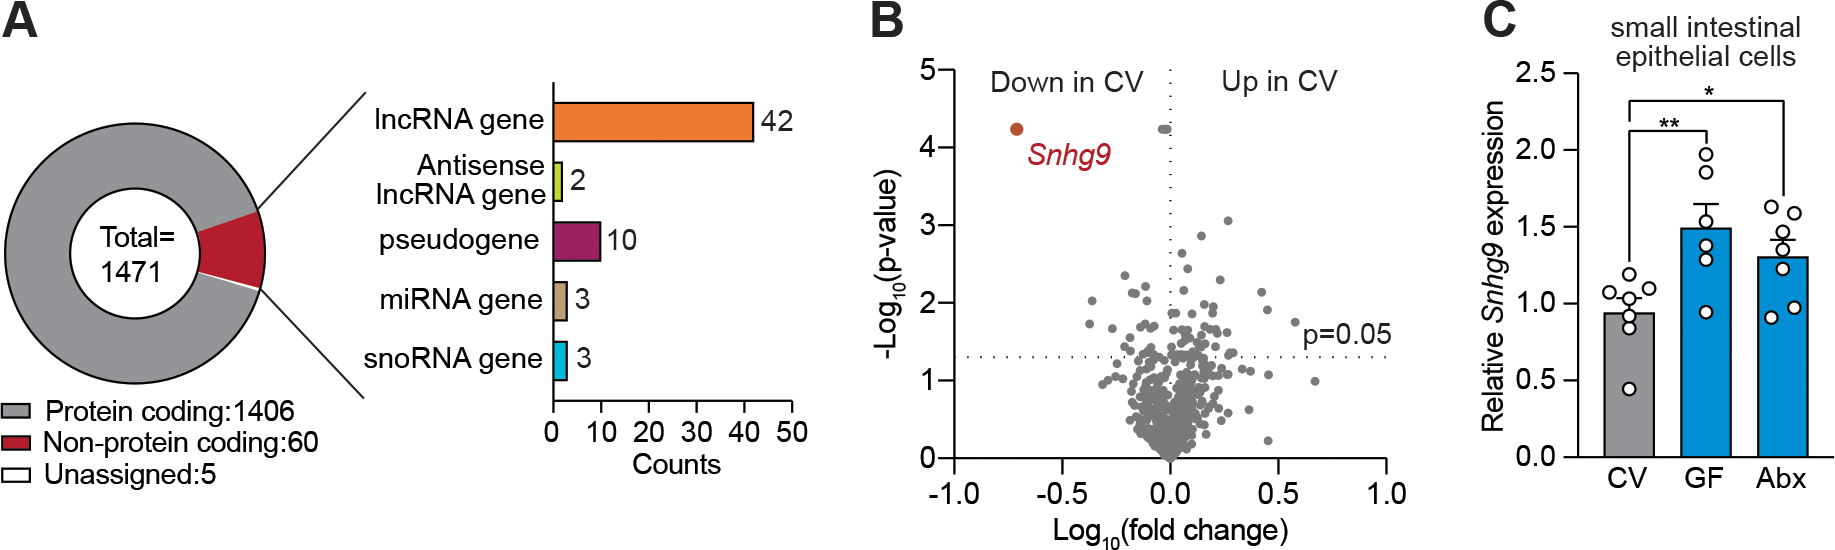
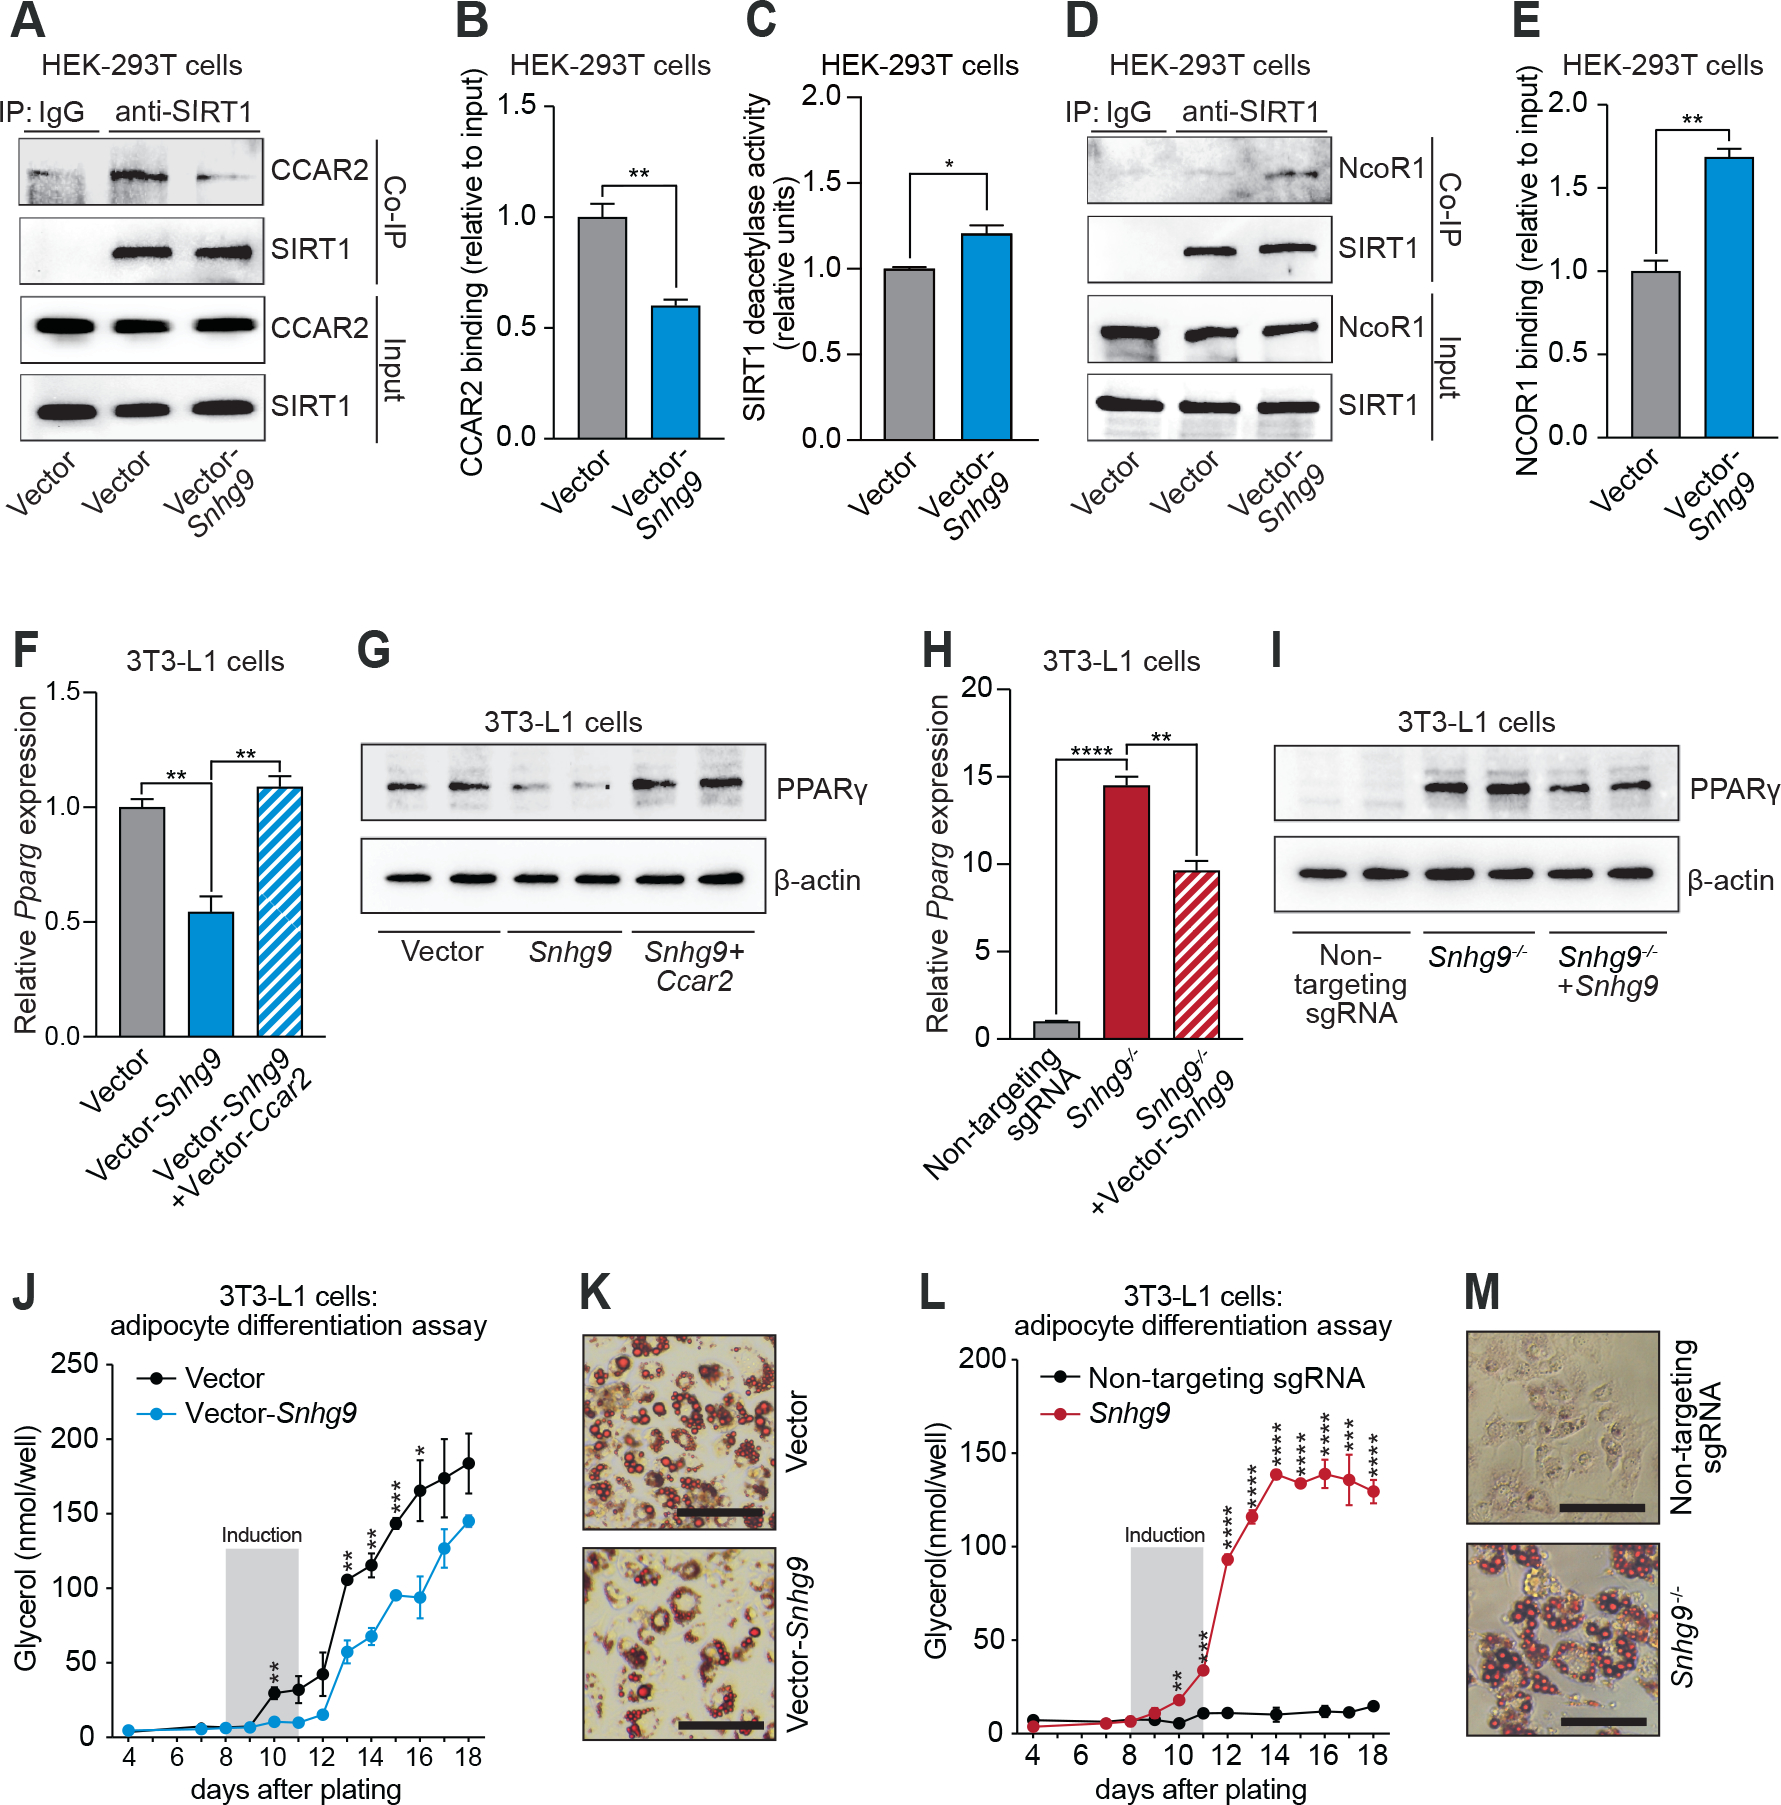
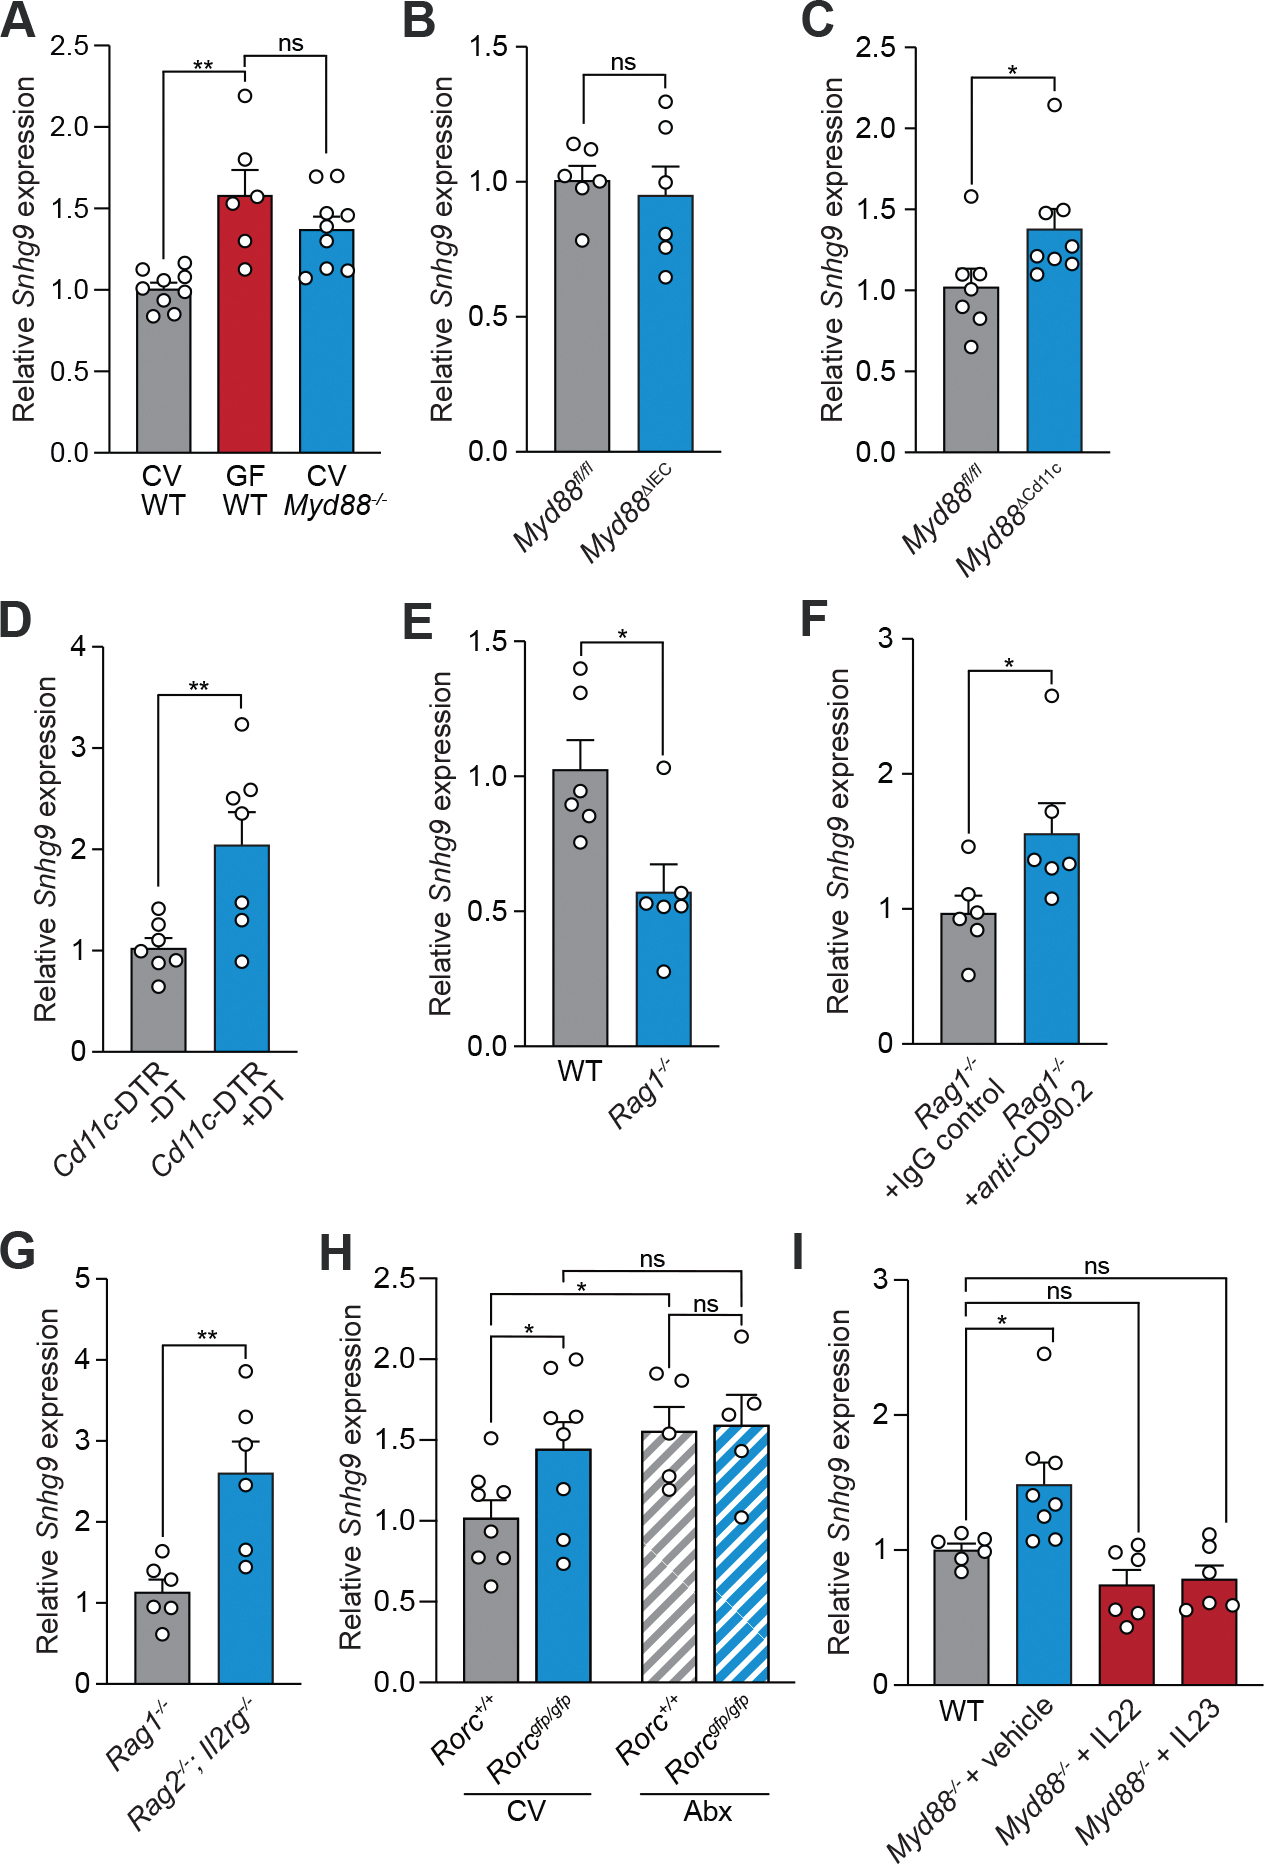
The intestinal microbiota regulates mammalian lipid absorption, metabolism, and storage. We report that the microbiota reprograms intestinal lipid metabolism in mice by repressing the expression of long noncoding RNA (lncRNA) Snhg9 (small nucleolar RNA host gene 9) in small intestinal epithelial cells. Snhg9 suppressed the activity of peroxisome proliferator-activated receptor γ (PPARγ)-a central regulator of lipid metabolism-by dissociating the PPARγ inhibitor sirtuin 1 from cell cycle and apoptosis protein 2 (CCAR2). Forced expression of Snhg9 in the intestinal epithelium of conventional mice impaired lipid absorption, reduced body fat, and protected against diet-induced obesity. The microbiota repressed Snhg9 expression through an immune relay encompassing myeloid cells and group 3 innate lymphoid cells. Our findings thus identify an unanticipated role for a lncRNA in microbial control of host metabolism.


Conflict of interest statement

Competing interests: The authors declare no competing interests.

Figures

Figure 1:
Figure 1:. Expression of lncRNA Snhg9 is repressed by the microbiota.
(A) Whole transcriptome sequencing of small intestinal epithelial cells recovered by laser capture microdissection from conventional and germ-free mice. Genes differentially expressed between conventional and germ-free mice are summarized and grouped based on transcript type. (B) Volcano plot visualizing the changes in lncRNA gene expression between conventional and germ-free mice. Snhg9 is highlighted in red. (C) qPCR analysis of Snhg9 expression in small intestinal epithelial cells recovered by laser capture microdissection from conventional (CV), germ-free (GF) and antibiotic treated (Abx) mice. Results are representative of at least two independent experiments. Means ± SEM are plotted; each data point represents one mouse. *p<0.05; **p<0.01; two-tailed Student’s t test.
Figure 2:
Figure 2:. LncRNA Snhg9 binds to CCAR2.
(A) Schematic of RNA-protein pull-downs in small intestinal epithelial cell (IEC) lysates in combination with mass spectrometry analysis. Created at BioRender.com. (B) Ten most abundant Snhg9 binding proteins identified by mass spectrometry. CCAR2 is highlighted in red. (C) Upper panel: representative immunoblot of CCAR2 in proteins pulled down from small intestinal IEC lysates by polyA RNA (negative control), Snhg9 or antisense Snhg9. Lower panel: Band intensities were quantified by densitometry and normalized to input. N=3 experimental replicates per group. (D) Upper panel: representative immunoblot of recombinant CCAR2 pulled down by polyA RNA, Snhg9 or antisense Snhg9. Lower panel: intensities were quantified by densitometry and normalized to input. N=3 experimental replicates per group. (E) Upper panel: representative immunoblot of CCAR2 in proteins pulled down from small intestinal IEC lysates by polyA RNA, antisense Snhg9, Snhg9, Snhg9 with 28 nucleotides deleted from the middle of the sequence (Snhg9-Δmid), Snhg9 with 3’-deletion of 24 nucleotides (Snhg9-Δ3’), Snhg9 with 5’-deletion of 24 nucleotides (Snhg9-Δ5’) or Snhg9 with both 3’- and 5’-deletion of 24 nucleotides (Snhg9-Δ3’Δ5’). Lower panel: band intensities were quantified by densitometry and normalized to input. N=3 experimental replicates per group. All experiments are representative of at least two independent experiments. Means ± SEM are plotted. **p<0.01; ***p<0.001; ns, not significant; two-tailed Student’s t test.
Figure 3:
Figure 3:. LncRNA Snhg9 dissociates CCAR2 from the PPARγ inhibitor SIRT1, repressing PPARγ activity.
(A) Co-immunoprecipitation (co-IP) of CCAR2 and SIRT1 with anti-SIRT1 antibody or IgG isotype control. HEK-293T cells were transfected with empty vector or Snhg9-encoding vector. Proteins were detected by immunoblot. (B) Band intensities in (A) were quantified by densitometry and normalized to input. N=3 experimental replicates per group. (C) Relative SIRT1 deacetylase activity in HEK-293T cells transfected with empty vector or Snhg9-encoding vector. N=5 experimental replicates per group. (D) Co-immunoprecipitation of NcoR1 and SIRT1 with anti-SIRT1 antibody or IgG isotype control. HEK-293T cells were transfected with empty vector or Snhg9-encoding vector. Proteins were detected by immunoblot. (E) Band intensities in (D) were quantified by densitometry and normalized to input. N=3 experimental replicates per group. (F) qPCR analysis of Pparg expression in 3T3-L1 cells with stable expression of Snhg9 or co-expression of Snhg9 and Ccar2. Cells were transduced with empty vector as a control. N=4 experimental replicates per group. (G) Immunoblot detection of PPARγ and β-actin (control) in 3T3-L1 cells from (F). (H) qPCR analysis of Pparg expression in Snhg9−/− 3T3-L1 cells that were untreated or rescued by Snhg9 expression, and in cells edited with non-targeting sgRNA. N=4 experimental replicates per group. (I) Immunoblot detection of PPARγ and β-actin (control) in 3T3-L1 cells from (H). (J) Snhg9 was stably expressed in 3T3-L1 cells and their differentiation to adipocytes was assessed by measuring glycerol as a readout of triglyceride accumulation. Cells were transduced with empty vector as a control. N=5 experimental replicates per group. (K) Lipids were detected by Oil Red O staining of differentiated cells from (J). Scale bar=30μm. (L) Snhg9−/− 3T3-L1 cells and cells edited with non-targeting sgRNA were assessed for differentiation to adipocytes as in (J). N=5 experimental replicates per group. Note that the multiple cell passages required by the CRISPR mutant selection process results in suppression of Pparg expression in the cells edited with non-targeting sgRNA (32). (M) Lipids were detected by Oil Red O staining of differentiated cells from (L). Scale bar=30 μm. All experiments are representative of at least two independent experiments. Means ± SEM are plotted. *p<0.05; **p<0.01; ***p<0.001; ****p<0.0001; two-tailed Student’s t test.
Figure 4:
Figure 4:. Villin-Snhg9 transgenic mice have reduced lipid absorption and are protected from high fat diet-induced metabolic disorders.
(A) Relative SIRT1 deacetylation activity in IECs from conventional wild-type, germ-free wild-type and conventional Villin-Snhg9 transgenic (Tg) mice. (B) RNA-seq of intestines of wild-type and Villin-Snhg9 Tg littermates. KEGG pathway analysis identifies pathways affected by Snhg9 overexpression. (C) Heatmap visualizing expression levels of selected lipid metabolic genes with altered expression in the small intestines of wild-type (WT) and Villin-Snhg9 Tg littermates. (D) LipidTox detection of fatty acids in the small intestines of wild-type and Villin-Snhg9 Tg littermates fed a high fat diet. Scale bar=100 μm. (E) Relative total lipid concentrations in isolated IECs from wild-type and Villin-Snhg9 Tg littermates fed a high fat diet. (F) Relative total neutral lipid concentrations in the feces of wild-type and Villin-Snhg9 Tg littermates fed a high fat diet. (G to I) Wild-type and Villin-Snhg9 Tg littermates were fed a high fat diet for 10 weeks and were assessed for body fat percentage (G), epididymal fat pad weight (H) and liver fat accumulation (examples are indicated with arrowheads) as indicated by hematoxylin and eosin staining (scale bar=100 μm) (I). (J and K) Wild-type and Villin-Snhg9 Tg littermates fed a high fat diet were assessed for glucose tolerance (J) and insulin tolerance (K). N=5 mice per group. (L) Body fat percentages of wild-type and Villin-Snhg9 Tg littermates that were treated with antibiotics after switching to a high fat diet for 10 weeks. (M) Body fat percentages of wild-type and Snhg9−/− littermates that were treated with antibiotics after switching to a high fat diet for 10 weeks. All experiments are representative of at least two independent experiments. Means ± SEM are plotted; each data point represents one mouse. *p<0.05; **p<0.01; ns, not significant; two-tailed Student’s t test.
Figure 5:
Figure 5:. The microbiota suppresses Snhg9 expression through a myeloid cell-ILC3 relay.
Snhg9 expression was measured by qPCR analysis of the small intestines of (A) conventional wild-type, germ-free wild-type and conventional Myd88−/− mice; (B) Myd88fl/fl and Myd88ΔIEC (epithelial cell-specific knockout) mice; (C) Myd88fl/fl and Myd88ΔCd11c (Cd11c+ cell-specific knockout) mice; (D) Cd11c-DTR mice untreated or treated with Diphtheria toxin (DT); (E) wild-type (WT) and Rag1−/− mice; (F) Rag1−/− mice injected via the intraperitoneal route with anti-CD90.2 antibody or IgG isotype control; (G) Rag1−/− and Rag2−/−;Il2rg−/− mice; (H) Rorc+/+ and Rorcgfp/gfp mice that were untreated (CV) or treated with antibiotics (Abx); (I) Myd88−/− mice treated with recombinant IL-22, IL-23 or vehicle. All experiments are representative of at least two independent experiments. Means ± SEM are plotted; each data point represents one mouse. *p<0.05; **p<0.01; ns, not significant; two-tailed Student’s t test.

References

    1. Hooper LV, Midtvedt T, Gordon JI, How host-microbial interactions shape the nutrient environment of the mammalian intestine. Annu. Rev. Nutr 22, 283–307 (2002). - PubMed
    1. Wang Y et al., The intestinal microbiota regulates body composition through NFIL3 and the circadian clock. Science 357, 912–916 (2017). - PMC - PubMed
    1. Kuang Z et al., The intestinal microbiota programs diurnal rhythms in host metabolism through histone deacetylase 3. Science 365, 1428–1434 (2019). - PMC - PubMed
    1. Krautkramer KA, Fan J, Bäckhed F, Gut microbial metabolites as multi-kingdom intermediates. Nat. Rev. Micro. 19, 77–94 (2021). - PubMed
    1. Leone V et al., Effects of diurnal variation of gut microbes and high-fat feeding on host circadian clock function and metabolism. Cell Host Microbe 17, 681–689 (2015). - PMC - PubMed