. 2023 Aug 25;381(6660):eadd8673.
doi: 10.1126/science.add8673. Epub 2023 Aug 25.

Structural insights into histone binding and nucleosome assembly by chromatin assembly factor-1

Affiliations

Structural insights into histone binding and nucleosome assembly by chromatin assembly factor-1

Chao-Pei Liu et al. Science. .

Abstract

Chromatin inheritance entails de novo nucleosome assembly after DNA replication by chromatin assembly factor-1 (CAF-1). Yet direct knowledge about CAF-1's histone binding mode and nucleosome assembly process is lacking. In this work, we report the crystal structure of human CAF-1 in the absence of histones and the cryo-electron microscopy structure of CAF-1 in complex with histones H3 and H4. One histone H3-H4 heterodimer is bound by one CAF-1 complex mainly through the p60 subunit and the acidic domain of the p150 subunit. We also observed a dimeric CAF-1-H3-H4 supercomplex in which two H3-H4 heterodimers are poised for tetramer assembly and discovered that CAF-1 facilitates right-handed DNA wrapping of H3-H4 tetramers. These findings signify the involvement of DNA in H3-H4 tetramer formation and suggest a right-handed nucleosome precursor in chromatin replication.


Conflict of interest statement

Competing interests: Authors declare that they have no competing interests.

Figures

Fig. 1.
Fig. 1.. Crystal structure of CAF-1.
(A) Domain structures of CAF-1 subunits. The core domains of p48, p150 and p60 are colored amber, magenta and cyan, respectively. Line segments colored the same as the protein domains indicate protein fragments used in this study. Dashed lines indicate protein regions involved in pairwise interactions. (B) Coomassie-stained SDS-PAGE analysis of purified recombinant CAF-1 complexes. CAF-1 full-length complex (FC); CAF-1 large domain complex (LC), containing p150L, p60ΔC and p48; and CAF-1 middle domain complex (MC), containing p150M, p60ΔC and p48, are displayed. (C) Crystal structure of CAF-1. Different subunits are colored according to the scheme in (A), and the orange dashed line denotes the disordered ED domain of p150. Each of the seven blades of the p48 and p60 β-propeller, from the N- to C-terminal direction, is numbered from 1 to 7. Four strands in each blade are numbered from β1 to β4, as that labeled in blade-1 of p60 and blade-3 of p48.
Fig. 2.
Fig. 2.. Cryo-EM structure of CAF-1 bound to H3-H4.
(A) Front (top) and back (bottom) views of the density map, which is sharpened with a B-factor of −144 Å2 and contoured at 4.0 σ. CAF-1 subunits are colored the same as in Fig. 1C, and H3 and H4 are shown in marine and green, respectively. (B) A cartoon model of the CAF-1-H3-H4 complex structure in the front view. p150 is highlighted with the superposition of a semi-transparent surface representation of the density. Disordered internal loops are represented with dashed lines. (C) A back view of the superimposed apo crystal structure and the H3-H4 bound cryo-EM structure of CAF-1 through alignment of p60. The crystal structure is colored with p150 in periwinkle, p60 and p48 in grey, while the cryo-EM structure is colored the same as in (B). Histones H3-H4 are represented by a pale bicolor ellipse for viewing clarity. Paired arrow lines indicate the relocation of the same structural elements of p150 and p48 in the two structures. Transformation of the β5-α5 unit of p150 in the crystal structure into part of α5B in the cryo-EM structure is indicated by a dashed arrow arc. See also movie S1. (D) An overview of the interaction between CAF-1 and histone H3-H4. The exposed histone H3-H4 tetramerization interface is indicated by a black line triangle. (E) A schematic drawing depicting overall features of H3-H4 binding by CAF-1.
Fig. 3.
Fig. 3.. Interaction between p150 and histone H3-H4.
(A) Detailed view of interaction between the ED domain of p150 and histone H3-H4. Top, amino acid sequence of the ED domain, with acidic residues colored in red, and designation of different fragments for functional analyses. Bottom, interaction between key acidic residues in the ED domain of p150 and H3-H4. (B) Pulldown of H3-H4 with GST-tagged CAF1-MC complexes with an intact p150M or mutants substituting the ED-domain fragments in (A) with equal-length GS-linkers, e.g., N1GS and EDGS mutants substitute of the N1 fragment and the entire ED domain with GS-linkers, respectively. 4mut represents the E628K/D629N/E630K/D632G quadruple mutation in p150M. Pulldowns were performed at 1 M NaCl and analyzed by Coomassie-stained SDS-PAGE. (C) Supercoiling assay of in vitro nucleosome assembly by CAF-1. ϕX174 DNA (lane 1) was treated with DNA topoisomerase I (lane 2) and incubated with H3-H4 only (lane 3), or increasing amounts (0.1 and 0.2 μg) of WT or indicated mutants of CAF1-MC (lanes 4–15), together with 0.1 μg of H3-H4 and 0.1 μg of relaxed ϕX174 DNA. R and S at the left indicate the position of supercoiled and relaxed DNA, respectively. Input protein samples are shown in fig. S6B. (D) Cell proliferation activities of WT p150 or its mutants in p150-AID cells, which were first treated with doxycycline (Dox) to induce the expression of exogenous p150 constructs. 5-Ph-IAA (Auxin) was added 24 hours after Dox-treatment. Cell viability was measured by CellTiter-Glo after 7 days Dox treatment. Error bars represent SEM calculated from three biological replicates. Two-way ANOVA with Sídák test was used to calculate p values. (E) Schematic of the ReIN-Map and MNase-seq protocol. Cells were treated with Dox, Auxin and EdU at the indicated time points, and chromatin was crosslinked and sheared either by MNase digestion or sonication. DNA of MNase-treated samples was extracted and ligated with NGS adaptors, and the MNase-seq signals reflect the steady-state nucleosome occupancy. For RelN-Map, DNA of MNase-treated and corresponding sonication-sheared samples were extracted, and ligated with NGS adaptors. EdU-labeled newly replicated regions were biotinylated and separated with streptavidin beads. The ReIN score was derived by dividing the MINCE-seq signals by the sonication-seq signals. (F) The ReIN scores for regions around the transcription start sites (TSS, left panel) and the CTCF-binding sites (right panel) are shown. The CTCF ChIP-seq data from GEO: (GSM4640493) (84).
Fig. 4.
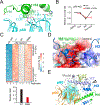
Fig. 4.. Interactions between p60 and histone H3-H4.
(A) Histone H4-p60 interaction at the center of the ventral surface of p60. Involved residues are shown in a stick model. Magenta dashed lines indicate potential hydrogen bonds. Tyr88 of H4 situated in the central basin of the ventral face of p60 is superimposed with a dots model. (B) Cell proliferation activity of wild-type p60 and D86N mutation assayed the same as that for Fig. 3D. (C) Heatmaps showing differentially expressed genes (DEGs) in p60-depleted and rescued cells vs. WT-AID HAP1 cells. Two biological replicates were done for each experiment. The lower panel shows the rescue ratios of transcriptional changes, which is defined as 1-[#(AB)]/[#(A)], where A is the set of DEGs from p60 depletion, and B is the set of DEGs from rescue expression of WT or D86N p60 constructs. The # function gives the number of genes in the set. (D) Interaction between histone H3 (marine) and p60. Histones H3-H4 are drawn in a cartoon model, with involved H3 residues depicted in a stick model. p60 is shown in a surface model colored according to electrostatic potential (negative, red; neutral, white; positive, blue) with the display range of −3 to +3 kT/e, where k is the Boltzmann constant. (E) Docking of a second CAF-1-H3-H4 complex (p60’, orange; H3’, light blue; H4’, lemon) to model the formation of a H3-H4 tetramer between the H3’-H4’ heterodimer and the H3-H4 heterodimer from the first CAF-1-H3-H4 complex, which is colored as in Fig. 2B, results in steric clashes between H4’ and p60 (indicated with dashed-line oval), and p60’ with p60 and H4. The black line triangle indicates the H3-H3’ dimerization interface. p150 and p48 have been removed for viewing clarity.
Fig. 5.
Fig. 5.. A 2:2 complex of CAF-1 and H3-H4.
(A) Two views of the 4.6 Å composite cryo-EM density map of the 2:2 complex contoured at 3.4 σ superimposed with the structure model. The same coloring scheme as in Fig. 2A is used here. (B) SEC-MALS analysis of CAF1-LC and its complex with H3-H4, in presence and absence of 30-bp DNA. The 379 ± 2 kDa peak resulted from the CAF1LC-H3-H4-DNA30 sample indicates the formation of a 2:2 complex (calculated mass ~377 kDa). (C) Interactions between histone H3-H4 of one CAF-1-H3-H4 complex and p60’ of another complex, which is shown as the electrostatic potential surface (color range, −3 to +3 kT/e). H3-H4 binds a positively charged region spanning blades 1–3 of p60’. (D) Two views of the mismatched H3 dimerization areas, indicated by a pair of arrow lines, in the 2:2 complex. The two H3-H4 heterodimers from the cryo-EM structure are shown in a cartoon model superposed with a magenta semi-transparent density map. For comparison with the face-to-face placement of two H3 dimerization surfaces in a tetramer, an additional H3-H4 heterodimer (cartoon model with H3’ in bright orange, and H4’ in green cyan) is modeled onto one of the H3-H4 heterodimers in the 2:2 complex. The tetramer interface is indicated by a bidirectional arrow line.
Fig. 6.
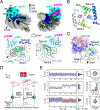
Fig. 6.. CAF-1 induces right-handed DNA wrapping of H3-H4 in vitro.
(A) Two views of the 3.8 Å-resolution cryo-EM structure of the CAF-1 bound right-handed di-tetrasome. Top, cryo-EM density map contoured at 3.0 σ. Regions for H3, H4 and DNA are colored according to the displayed color stripes, while that of p60 and p150 are colored as in Fig. 2A. Blades 1–7 of p60 are labeled from B1 to B7. A black arrowhead marks the dyad position at the interface between two H3-H4 tetramers, Tetra-I and Tetra-II. Bottom, a cartoon model of the structure. The two H3-H3 interfaces within the two tetramers and the H4 interface between Tetra-I and Tetra-II, which is highlighted in a circle, are labeled with arrow lines. The box in the right panel indicates the location of ordered αN of H3 in Tetra-I interacting with H4 of Tetra-II. (B) A close-up view of the inter-tetrasomal interface corresponding to the encircled region in (A). (C) Interaction of p60 with one H3-H4 heterodimer and DNA at the inter-tetrasomal interface. The electrostatic potential surface of p60 (−3 to +3 kT/e) is shown. The positively charged region spanning blades 2–4 contacts histones and DNA. (D) Schematic of the single molecule FOMT for determining the handedness of DNA wrapping. The clockwise and counterclockwise circular arrows represent left- and right-handed turns from views looking down at the beads. (E) Top row: time course of radial fluctuation (left) based on the position of the bead (x, y) (right), and normalized counts of the left panel with Gaussian fit (middle) of a single DNA tether over a time span of 300 s covering an assembly event signified by simultaneous changes of bead rotation angle θ and extension length z shown below. The red circle in the right panel denotes the fitted overall circular motion of the bead. Middle row: time course of the bead rotation angle θ (left), and normalized distribution of θ changes with Gaussian fit (middle) of a single event. Mean values of each assembly step are indicated with red line segments. The histogram in the right panel shows the distribution of rotational changes (Δθ) from 11 independent tetrasome assembly events. Count ratio is defined as the percentage of times observed among the 11 total events (N=11). Bottom row: time course of the extension length (z) of a single DNA tether (left), with the red line showing z values averaged over 50 ms intervals, and normalized counts of the left panel with Gaussian fit (middle) of the same event as above. The right panel shows the distribution of Δz values from the same 11 independent events as above plotted in violin with box. The horizontal line represents the median, the height of the box extends the quartiles, and the whisker indicates the data range.

References

    1. Luger K, Mader AW, Richmond RK, Sargent DF, Richmond TJ, Crystal structure of the nucleosome core particle at 2.8 A resolution. Nature 389, 251–260 (1997). - PubMed
    1. Serra-Cardona A, Zhang Z, Replication-Coupled Nucleosome Assembly in the Passage of Epigenetic Information and Cell Identity. Trends Biochem Sci 43, 136–148 (2018). - PMC - PubMed
    1. Groth A, Rocha W, Verreault A, Almouzni G, Chromatin challenges during DNA replication and repair. Cell 128, 721–733 (2007). - PubMed
    1. Xu M et al., Partitioning of histone H3-H4 tetramers during DNA replication-dependent chromatin assembly. Science 328, 94–98 (2010). - PubMed
    1. Yu C et al., A mechanism for preventing asymmetric histone segregation onto replicating DNA strands. Science 361, 1386–1389 (2018). - PMC - PubMed