. 2023 Oct;10(28):e2302539.
doi: 10.1002/advs.202302539. Epub 2023 Aug 24.

Regulation of Osteoimmune Microenvironment and Osteogenesis by 3D-Printed PLAG/black Phosphorus Scaffolds for Bone Regeneration

Affiliations

Regulation of Osteoimmune Microenvironment and Osteogenesis by 3D-Printed PLAG/black Phosphorus Scaffolds for Bone Regeneration

Jing Long et al. Adv Sci (Weinh). 2023 Oct.

Abstract

The treatment of bone defects remains a significant challenge to be solved clinically. Immunomodulatory properties of orthopedic biomaterials have significance in regulating osteoimmune microenvironment for osteogenesis. A lactic acid-co-glycolic acid (PLGA) scaffold incorporates black phosphorus (BP) fabricated by 3D printing technology to investigate the effect of BP on osteoimmunomodulation and osteogenesis in site. The PLGA/BP scaffold exhibits suitable biocompatibility, biodegradability, and mechanical properties as an excellent microenvironment to support new bone formation. The studies' result also demonstrate that the PLGA/BP scaffolds are able to recruit and stimulate macrophages M2 polarization, inhibit inflammation, and promote human bone marrow mesenchymal stem cells (hBMSCs) proliferation and differentiation, which in turn promotes bone regeneration in the distal femoral defect region of steroid-associated osteonecrosis (SAON) rat model. Moreover, it is screened and demonstrated that PLGA/BP scaffolds can promote osteogenic differentiation by transcriptomic analysis, and PLGA/BP scaffolds promote osteogenic differentiation and mineralization by activating PI3K-AKT signaling pathway in hBMSC cells. In this study, it is shown that the innovative PLGA/BP scaffolds are extremely effective in stimulating bone regeneration by regulating macrophage M2 polarization and a new strategy for the development of biomaterials that can be used to repair bone defects is offered.

Keywords: 3D-printed Scaffolds; black phosphorus; bone regeneration; macrophage polarization; osteoimmune microenvironment.


Conflict of interest statement

The authors declare no conflict of interest.

Figures
Scheme 1
Scheme 1
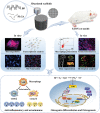
Schematic illustration of PLGA/BP scaffolds fabricated by 3D printing and proposed mechanism of osteoimmune environment induced by BP degradation to accelerate bone regeneration.
Figure 1
Figure 1
Morphology and characterizations of 3D printing scaffolds. a) Digital photos of the PLGA/BP scaffolds with different compositions; BP nanosheets of the total content were 0 wt.% (PLGA), 0.01 wt.% (10BP), 0.02 wt.% (20BP), and 0.04 wt.% (40BP), respectively. b) Morphology observation of different compositions scaffold by SEM. c) Energy Dispersive Spectrometer (SEM‐EDS) of the transverse section of different scaffolds. Element carbon (C, yellow); Element Oxygen (O, red); Element phosphorus (P, green). d) Raman spectrum of PLGA/BP scaffolds with different contents. e) XRD patterns of PLGA/BP scaffolds with different contents. f) XPS spectra of the PLGA and 40BP scaffolds. g) XPS spectra of P2p3/2, P2p1/2, and P‐O for 40BP scaffolds. n = 3 independent samples.
Figure 2
Figure 2
In vitro degradation behavior and biocompatibility tests of PLGA/BP scaffolds with different BP concentrations. The scaffolds were immersed in the PBS solution for 28 days. a–d) The accumulated releasing phosphorus concentration in the PBS solution and the changes in scaffold weight, compressive strength, and compressive modulus after 28 days were determined. e) Confocal laser scanning microscope (CLSM) images of hBMSC cells stained with phalloidin (red) and DAPI (blue) after culturing on the scaffolds after 7 days. f) Relative cell viability of hBMSC cells incubated in the presence of different scaffolds after further cultivation for 1, 3, and 7 days. g) CLSM images of RAW264.7 cells stained with phalloidin (red) and DAPI (blue) after culturing on the BP scaffolds after 7 days. h) Relative cell viability of RAW264.7 cells incubated in the presence of different BP scaffolds after further cultivation for 1, 3, and 7 days. n = 3 independent samples, * p < 0.05, ** p < 0.01, and *** p < 0.001 by one‐way ANOVA with Tukey's post hoc test.
Figure 3
Figure 3
Macrophage polarization on PLAG/BP scaffolds. a) After RAW264.7 cells were seeded on the different scaffolds and stimulated with LPS for 24 h, the expression of M1 biomarker CD86 (green) and M2 biomarker CD163 (red) was detected by fluorescence staining. b) Quantification of the integrated optical fluorescence density (IOD) of CD86. c) Quantitative analysis of CD163. d) Inflammatory genes were detected in RAW264.7 cells with different treatments at 12 and 24 h by RT‐qPCR. e) M2 marker genes were detected in RAW264.7 cells with different treatments at 12 and 24 h by RT‐qPCR. * p < 0.05, ** p < 0.01, and *** p < 0.001 by one‐way ANOVA with Tukey's post hoc test, when PLGA and 40BP groups compared with the Control group; # p < 0.05, ## p < 0.01, and ### p < 0.001 by one‐way ANOVA with Tukey's post hoc test, when 40BP group compared with PLGA group. n = 3 for biological replicates.
Figure 4
Figure 4
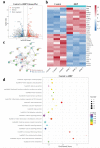
Transcriptomic analysis of osteogenic induction of PLGA/BP scaffolds. a) The volcano image of differential expression of osteogenic differentiation of hBMSC induced by osteogenic induction medium and 40BP scaffolds with leaching solution. Gray represents non‐significant gene differences, orange represents up‐regulated genes, and blue represents down‐regulated genes. b) The heat map of differential genes between the control and 40BP scaffold groups, red represents an up‐regulated gene, and blue represents the down‐regulated gene. c) The protein interaction network analysis of the differential genes based on the database STRING, red represents the upregulated gene, and blue represents the downregulated gene. d) The bubble map of KEGG enrichment analysis and the horizontal axis represents the enrichment score. n = 3 independent samples.
Figure 5
Figure 5
PLGA/BP scaffolds promote osteogenic differentiation and mineralization by activating PI3K‐AKT signaling pathway. hBMSC cells were cultured for 14 days with α‐MEM (blank group), osteogenic induction medium (control group), osteogenic induction medium with PLGA scaffold leaching solution (PLGA group), or different PLGA/BP scaffold leaching solutions (10BP, 20BP, and 40BP groups). a) Calcium deposition stained with Alizarin Red S after 14 days of cultivation. b) Quantitative analysis of alizarin red S staining. c) RT ‐qPCR analysis of transcriptome screening genes (c1, including PI3K, IBSP, SPP1, and OPN) and transcription factors related to osteogenic differentiation (c2, including Runx2, Osterix, ALP, and BMP2), genetic expression of hBMSC cells with different treatments for 14 days. d) Western blot assay of protein level of PI3K, p‐AKT, AKT, Runx2, and BMP2; β‐actin was used as a protein loading control. * p < 0.05, ** p < 0.01, and *** p < 0.01 by one‐way ANOVA with Tukey's post hoc test when PLGA and 40BP groups were compared with a control group; # p < 0.05, ## p < 0.01, and ### p < 0.001 by one‐way ANOVA with Tukey's post hoc test when 40BP group was compared with PLGA group. n = 3 for biological replicates.
Figure 6
Figure 6
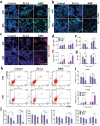
In vivo assessments of the immunomodulatory effect of PLGA/BP scaffolds in the distal femoral defect of the SAON rat. a) Immunofluorescence staining of CD68 for mononuclear macrophages in different groups. b) Immunofluorescence staining of CD86 for M1 macrophage phenotypes in different groups. c) Immunofluorescence staining of CD163 for M2 macrophage phenotypes in different groups. d–f) Quantitative analysis of the integrated optical density of CD68, CD86, and CD163 fluorescence in different groups at 4 and 8 weeks after surgery. g) The ratio of CD86/CD163 in the distal femoral defect area of the SAON rat 4 and 8 weeks after surgery. h) Measurement of the relative content of M1 and M2 subtypes of macrophages on PLGA and 40BP scaffolds implanted in rats for 2 and 4 weeks by flow cytometry. i) Quantification of the content of CD68‐ and CD163‐positive cells. j) The expression level of inflammatory factors in rat serum by ELISA. * p < 0.05, ** p < 0.01, and *** p < 0.001 by one‐way ANOVA with Tukey's post hoc test when PLGA and 40BP groups were compared with the control group; # p < 0.05, ## p < 0.01, and ### p < 0.001 by one‐way ANOVA with Tukey's post hoc test when 40BP group was compared with PLGA group. n = 3 for biological replicates.
Figure 7
Figure 7
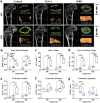
In vivo analysis of the new bone formation of PLGA/BP scaffolds in the distal femoral defect of the SAON rat using micro‐CT. a) Micro‐CT 3D reconstruction images of the representative region of interest (ROI) in the area of the bone defect of the distal femur in different groups 4 and 8 weeks after surgery. The distribution of trabecular thickness was shown in the transverse plane. b–g) Quantitative analysis results of micro‐CT of new trabecular bone in the bone defect area 4 and 8 weeks after surgery: b) BMD; c) BV; d) BV/TV; e) Tb.N; f) Tb.Th; g) Tb.Sp. * p < 0.05, ** p < 0.01, and *** p < 0.001 by one‐way ANOVA with Tukey's post hoc test when PLGA and 40BP groups were compared with the control group; # p < 0.05, ## p < 0.01, and ### p < 0.001 by one‐way ANOVA with Tukey's post hoc test when 40BP group was compared with PLGA group. n = 6 for biological replicates.
Figure 8
Figure 8
Histological analysis of new bone formation in the area of the distal femoral defect of the SAON rat at 4 and 8 weeks after surgery. a) Goldner's trichrome staining of the bone defect area of the different groups. The black circle indicates the bone defect tunnel at 40× magnification; the site of new bone formation indicated by the black arrow is shown below at 200× magnification. b) Sequential fluorescence micrographs of the undecalcified sections at 4 and 8 weeks. Green and red fluorescence is from calcein‐AM and xylenol orange excited at 480 and 560 nm, respectively. White double arrows indicate the distances between the new bone tissue. c) Immunohistochemical staining of BMP2 and OPN in the control, PLGA, and 40BP groups to evaluate bone regeneration in the defect area. d,e) Quantitative analysis of BMP2 and OPN based on the immunohistochemical images. f,g) Quantitative analysis of bone regeneration based on sequential fluorescence images. * p < 0.05 and ** p < 0.01 by one‐way ANOVA with Tukey's post hoc test. n = 3 for biological replicates.

References

    1. Han Q., Qin Y. G., Zou Y., Wang C. Y., Bai H. T., Yu T., Huang L. F., Wang J. C., Rapid Prototyping J. 2017, 23, 465.
    1. Lobb D. C., DeGeorge B. R. Jr., Chhabra A. B., J. Hand Surg. Am. 2019, 44, 497. - PubMed
    1. Zhang L., Yang G., Johnson B. N., Jia X., Acta Biomater. 2019, 84, 16. - PubMed
    1. a) Wang L., Yang Q., Huo M., Lu D., Gao Y., Chen Y., Xu H., Adv. Mater. 2021, 33, 2100150; - PubMed
    2. b) Matai I., Kaur G., Seyedsalehi A., McClinton A., Laurencin C. T., Biomaterials 2020, 226, 119536. - PubMed
    1. a) Lee J., Byun H., Madhurakkat Perikamana S. K., Lee S., Shin H., Adv. Healthcare Mater. 2019, 8, 1800861; - PubMed
    2. b) Li W., Huang X., Yu W., Xu Y., Huang R., Park J., Moshaverinia A., Arora P., Chen C., J. Dent. Res. 2022, 101, 802. - PMC - PubMed

Publication types

Substances

LinkOut - more resources