. 2023 Dec 21;142(25):2159-2174.
doi: 10.1182/blood.2023020144.

Cdc73 protects Notch-induced T-cell leukemia cells from DNA damage and mitochondrial stress

Affiliations

Cdc73 protects Notch-induced T-cell leukemia cells from DNA damage and mitochondrial stress

Ashley F Melnick et al. Blood. .

Erratum in

Abstract

Activated Notch signaling is highly prevalent in T-cell acute lymphoblastic leukemia (T-ALL), but pan-Notch inhibitors showed excessive toxicity in clinical trials. To find alternative ways to target Notch signals, we investigated cell division cycle 73 (Cdc73), which is a Notch cofactor and key component of the RNA polymerase-associated transcriptional machinery, an emerging target in T-ALL. Although we confirmed previous work that CDC73 interacts with NOTCH1, we also found that the interaction in T-ALL was context-dependent and facilitated by the transcription factor ETS1. Using mouse models, we showed that Cdc73 is important for Notch-induced T-cell development and T-ALL maintenance. Mechanistically, chromatin and nascent gene expression profiling showed that Cdc73 intersects with Ets1 and Notch at chromatin within enhancers to activate expression of known T-ALL oncogenes through its enhancer functions. Cdc73 also intersects with these factors within promoters to activate transcription of genes that are important for DNA repair and oxidative phosphorylation through its gene body functions. Consistently, Cdc73 deletion induced DNA damage and apoptosis and impaired mitochondrial function. The CDC73-induced DNA repair expression program co-opted by NOTCH1 is more highly expressed in T-ALL than in any other cancer. These data suggest that Cdc73 might induce a gene expression program that was eventually intersected and hijacked by oncogenic Notch to augment proliferation and mitigate the genotoxic and metabolic stresses of elevated Notch signaling. Our report supports studying factors such as CDC73 that intersect with Notch to derive a basic scientific understanding on how to combat Notch-dependent cancers without directly targeting the Notch complex.


Conflict of interest statement

Conflict-of-interest disclosure: The authors declare no competing financial interests.

Figures

None
Graphical abstract
Figure 1.
Figure 1.
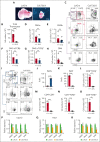
Cdc73 is important for Notch-dependent T-cell development. (A-H) Representative images of thymuses (A); absolute thymocyte counts (B); representative flow cytometric profiles of DN subsets (C); and absolute numbers of DN3a (D), DN3b (E), DN3 icTCRβ (F), DN3 icTCRβ+ (G), and DN4 (H) subsets in LckCre control and LckCre Cdc73f/f(Cdc73Δ/Δ) mice. (I-O) Representative flow cytometric profiles of CD4/CD8 subsets (I); %DN (J); %DP (K); and absolute numbers of immature single-positive (ISP) (L), DP (M), CD4 single-positive (SP) (N), and CD8 SP (O) thymic subsets in LckCre control and Cdc73Δ/Δ mice. DN3a = LineageCD44CD25+FSCloCD27; DN3b = LineageCD44CD25+FSChiCD27+; DN4 = LineageCD44CD25; ISP = CD8+TCRb; DP = CD4+CD8+; CD4 SP = CD4+TCRb+; And CD8 SP = CD8+TCRb+. ∗P < .05; ∗∗P < .01; ∗∗∗P < .001; ∗∗∗∗P < .0001. (P-R) Relative expression of Cdc73 (P), Hes1 (Q), and Myc (R) in sorted thymic subsets from LckCre mice (green) and Cdc73Δ/Δ mice (orange). FSC, forward scatter; icTCR, intracellular T-cell receptor; ns, not significant.
Figure 2.
Figure 2.
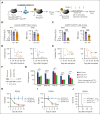
Cdc73 is important for Notch-induced T-ALL maintenance. (A) Experimental strategy to study dependence of Notch-induced T-ALL maintenance on Cdc73. (B-E) Mice were injected with 2 different primary ΔE/Notch1-induced Rosa26CreERT2 control T-ALL tumors (B,D) or 2 different primary ΔE/Notch1-induced Rosa26CreERT2Cdc73f/f murine T-ALL tumors (C,E). Numbers indicate tumor IDs. Peripheral blood green fluorescent protein–positive (GFP+) or white blood cell (WBC) counts for panels B-C at 2.5 weeks after transplant and survival for panels D-E were measured. (F) Western blot showing CDC73 knockdown in shRNA-transduced CEM cells. Numbers indicate relative band intensity. (G) Fold expansion (day 9 cell count / day 0 cell count) of Notch1-activated T-ALL cells transduced with 2 independent shCDC73. (H-I) Viability of conventional T-ALL PDX cells transduced with shCDC73 in OP9-DL4 stromal cell culture. N = 3. (J) Leukemia-free survival of NOD-scid-IL2γnull (NSG) mice injected with PDX4 cells transduced with shCDC73 that were passaged in NSG mice for 24 weeks. N = 5. ∗P < .05; ∗∗P < .01; ∗∗∗P < .001; ∗∗∗∗P < .0001. cKO, comditional knockout; Tam, 25 mg/kg tamoxifen; WT, wild-type.
Figure 3.
Figure 3.
Cdc73 shares ETS1 and Notch-driven pathways. (A) Rosa26CreERT2Cdc73f/f T-ALL cells (969 and 970) and control Rosa26CreERT2 T-ALL cells derived from tumors in Figure 2C were treated with 3 nM OHT to delete Cdc73 and measured for growth. Fold expansion = day 3 or day 6 cell count / day 0 cell count. (B) Venn diagram showing 1062 Cdc73 target genes shared by both Cdc73f/f T-ALL cell lines from panel A. Target genes defined as fold change (FC) > 1.5; Padj < .05 in Bru-seq counts at 30 hours after OHT addition in both Cdc73f/f cell lines but not in controls. (C-D) GSEA using the top 258 ETS1-induced gene list of Cdc73-induced genes in 969 (C) and 970 (D) cells. (E-H) GSEA analyses showing the top 6 Hallmark pathways enriched for Cdc73- (E-F), ETS1- (G) and Notch- (H) induced target genes. ETS1 and Notch target genes were previously described in human THP-6 T-ALL cells. Pathways shared across the 4 analyses are highlighted in blue. (I-L) GSEA using the MSigDB C2 Kauffman_DNA_repair gene list of Cdc73-induced genes (I-J), ETS1-induced genes (K), and Notch-induced genes (L). (M-N) Venn diagram showing overlap of Cdc73-induced and ETS1-induced (M) or Notch-induced (N) genes in the Kauffman_DNA_repair gene list. (O-T) Volcano plots of significance vs Bru-seq (O-P,S) or RNA-seq (Q-R,T) Log2FC data showing the control vs OHT (Cdc73Δ/Δ) comparison and highlighting important genes in nonhomologous end-joining (NHEJ; O,Q), homologous recombination (HR; P,R), and OXPHOS (S-T) pathways in 969 T-ALL cells (O-P,S) and AML cells (Q-R,T) on background of all genes (gray) giving average RPKM > 0.8. RNA-seq analysis of Control and Cdc73-deleted AML cells were obtained from. ∗∗P < .01; ∗∗∗∗P < .0001. DMSO, dimethyl sulfoxide; EtOH, ethyl alcohol; GSI, gamma secretase inhibitor; RPKM, reads per kilobase per million.
Figure 4.
Figure 4.
Cdc73 is important for genome integrity. (A) Western blot for γH2AX in Rosa26CreERT2Cdc73f/f T-ALL cells (969 and 970) and control Rosa26CreERT2 T-ALL cells treated with OHT for 30 hours to delete Cdc73. Numbers represent band intensities normalized to β-actin loading control. (B) Western blot for γH2AX in human NOTCH1-induced human T-ALL cell lines (SUP-T1; CUTLL1) transduced with shCDC73. (C-E) Representative metaphase spreads (C) and quantification of metaphase abnormalities in aggregate (D) or per replicate (E) in blinded analyses of Cdc73f/f T-ALL cells treated with OHT for 30 hours. White arrows represent gaps; orange arrow represents break. (F-G) Representative Annexin V/7-AAD flow cytometric plots (F) and Annexin V+/7-AAD scatterplot (G) of Cdc73f/f T-ALL cells treated with vehicle (Control) or OHT for 30 hours (Cdc73Δ/Δ). 7-AAD, 7-aminoactinomycin D.
Figure 5.
Figure 5.
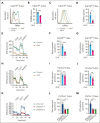
Cdc73 is important for OXPHOS. (A-B) Representative flow cytometric histogram (A) and mean florescence intensity scatterplot (N = 3) (B) showing mitochondrial membrane potentials measured by tetramethylrhodamine methyl ester (TMRM) assay on live 4′,6-diamidino-2-phenylindole (DAPI)-negative Rosa26CreERT2Cdc73f/f T-ALL cells (970) treated with OHT for 30 hours to delete Cdc73. FCCP was added as a positive control. (C-D) Representative flow cytometric histogram (C) and mean fluorescence intensity scatterplot (N = 3) (D) showing mitochondrial reactive oxygen species (ROS) production measured by the CellROX assay on live DAPI-negative 970 cells treated with OHT for 30 hours to delete Cdc73. TBHP was added as a positive control. (E-M) Seahorse XFe96 instrument measurements of real-time oxygen consumption rate (OCR) normalized to live cell number and protein concentration under basal conditions or in response to the indicated mitochondrial inhibitors (E,H,K) and scatterplots of basal (F,I,L) and adenosine triphosphate (ATP) production (G,J,M) respiration phases of 970 cells treated with OHT for 30 hours to delete Cdc73 (E-G), control Rosa26CreERT2 cells treated with OHT for 30 hours (H-J), and CUTLL1 cells at 4 days after transduction with 2 independent shCDC73 (K-M).
Figure 6.
Figure 6.
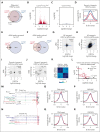
Cdc73 promotes expression of oncogenes but not DNA repair and OXPHOS genes through enhancers. (A) Venn diagram of differential H3K27ac (FDR < 0.05) in Rosa26CreERT2Cdc73f/f T-ALL cells (969 and 970) and control Rosa26CreERT2 T-ALL cells upon treatment with 6 nM OHT for 30 hours. (B-C) Volcano plots of significance vs log2(OHT/control) H3K27ac ChIP-seq signals of 969 (B) and control (C) cells in panel A. (D) Metagene plot of dynamic intergenic H3K27ac signals (defined as FDR < 0.05 in 969 and 970 cells but not in control cells) in 969 cells. (E-F) Venn diagram of differential eRNAs in Cdc73f/f T-ALL cells (969 and 970) that were repressed (E) or induced (F) upon treatment with 6 nM OHT for 30 hours. eRNAs were defined as intergenic BruUV-seq peaks or intragenic peaks that were antisense in direction relative to mRNAs. No differential eRNAs were identified after OHT treatment of control T-ALL cells. (G-J) BruUV-Seq log2(OHT/control) vs H3K27ac log2(OHT/Control) scatterplots of all overlapping intergenic peaks (G-H) or overlapping dynamic intergenic peaks (I-J) in control T-ALL cells (G,I) and Cdc73f/f T-ALL cells (969) (H,J). Overlapping dynamic peaks were defined as giving q < 0.05 and FDR < 0.05 in the same direction for the BruUV-Seq and H3K27ac comparisons respectively in both Cdc73f/f T-ALL cells but not in control T-ALL cells. (K) Spearman correlation coefficient analysis of eRNA and H3K27ac log2(OHT/control) from panel J and supplemental Figure 7G in 969 and 970 Cdc73f/f T-ALL cells. (L) Volcano plot of significance vs Bru-seq log2(OHT/control) of genes nearest overlapping OHT-downregulated dynamic intergenic BruUV-Seq and H3K27ac peaks in 969 Cdc73f/f T-ALL cells. (M-N) Display tracks of indicated ChIP-seq and assay for transposase-accessible chromatin (ATAC)-seq data sets at the Rasgrp1 locus in mouse 969 cells (M) or human THP-6 cells (N) showing nearest mouse-human homologous enhancers in red boxes that contain overlapping dynamic intergenic eRNA and H3K27ac peaks. Ets1 ChIP-seq (GSM461516); ATAC-seq (GSM2461649); DN3 Hi-C (GSE79422) analyzed in. (O-R) Metagene plots of H3K27ac signals at nonpromoter H2K27ac peaks nearest DNA repair (O,Q) and OXPHOS genes (P,R) from supplemental Table 1 in 969 cells (O-P) and 970 cells (Q-R). ∗∗∗FDR < 0.001; ∗∗∗∗FDR < 0.0001.
Figure 7.
Figure 7.
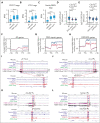
Cdc73 promotes DNA repair and OXPHOS gene expression through its gene body functions. (A-C) Box and whisker plots of CDC73 (A), ETS1 (B), and Notch/RBPJ (C) tag counts in human THP-6 cells at gene bodies (A) and promoters (B-C) of all genes, OXPHOS genes, and DNA repair genes shared by the GSEA enrichment cores in Cdc73f/f 969 and 970 T-ALL cells (Figure 3I; supplemental Figure 4G; supplemental Table 1). (D-E). Violin plots showing H2BK120ub1 ChIP-seq Log2FC in 969 cells (D) and 970 cells (E) for all genes, DNA repair genes, and OXPHOS genes in the GSEA enrichment cores of 969 and 970 cells (supplemental Table 1). OHT was added for 30 hours to delete Cdc73. (F-H) Metagene plots of H2BK120ub1 signals in EtOH-treated (blue) and OHT-treated (red) 969 cells at all genes (F), DNA repair genes (G), and OXPHOS genes (H) in core enrichment genes of GSEA analyses (supplemental Table 1). (I-L) Display tracks of indicated ChIP-seq and ATAC-seq datasets at important DNA repair genes (I-J) and OXPHOS genes (K-L) in mouse 969 cells (top) or human THP-6 cells (bottom) showing representative tracks and FDR values upon OHT addition (Cdc73 deletion) of H2BK120ub1 signals between transcriptional start site (TSS) and transcriptional termination site (TTS). ∗∗∗FDR < 0.001; ∗∗∗∗FDR < 0.0001. ATAC-seq (GSM2461649). Ets1 ChIP-seq (GSM2461515).

Update of

References

    1. Siebel C, Lendahl U. Notch signaling in development, tissue homeostasis, and disease. Physiol Rev. 2017;97(4):1235–1294. - PubMed
    1. Kopan R. Notch signaling. Cold Spring Harb Perspect Biol. 2012;4(10) - PMC - PubMed
    1. Weng AP, Ferrando AA, Lee W, et al. Activating mutations of NOTCH1 in human T cell acute lymphoblastic leukemia. Science. 2004;306(5694):269–271. - PubMed
    1. Krop I, Demuth T, Guthrie T, et al. Phase I pharmacologic and pharmacodynamic study of the gamma secretase (Notch) inhibitor MK-0752 in adult patients with advanced solid tumors. J Clin Oncol. 2012;30(19):2307–2313. - PubMed
    1. Tolcher AW, Messersmith WA, Mikulski SM, et al. Phase I study of RO4929097, a gamma secretase inhibitor of Notch signaling, in patients with refractory metastatic or locally advanced solid tumors. J Clin Oncol. 2012;30(19):2348–2353. - PMC - PubMed

MeSH terms