. 2023 Aug 24;19(8):e1011559.
doi: 10.1371/journal.ppat.1011559. eCollection 2023 Aug.

Druggable redox pathways against Mycobacterium abscessus in cystic fibrosis patient-derived airway organoids

Affiliations

Druggable redox pathways against Mycobacterium abscessus in cystic fibrosis patient-derived airway organoids

Stephen Adonai Leon-Icaza et al. PLoS Pathog. .

Abstract

Mycobacterium abscessus (Mabs) drives life-shortening mortality in cystic fibrosis (CF) patients, primarily because of its resistance to chemotherapeutic agents. To date, our knowledge on the host and bacterial determinants driving Mabs pathology in CF patient lung remains rudimentary. Here, we used human airway organoids (AOs) microinjected with smooth (S) or rough (R-)Mabs to evaluate bacteria fitness, host responses to infection, and new treatment efficacy. We show that S Mabs formed biofilm, and R Mabs formed cord serpentines and displayed a higher virulence. While Mabs infection triggers enhanced oxidative stress, pharmacological activation of antioxidant pathways resulted in better control of Mabs growth and reduced virulence. Genetic and pharmacological inhibition of the CFTR is associated with better growth and higher virulence of S and R Mabs. Finally, pharmacological activation of antioxidant pathways inhibited Mabs growth, at least in part through the quinone oxidoreductase NQO1, and improved efficacy in combination with cefoxitin, a first line antibiotic. In conclusion, we have established AOs as a suitable human system to decipher mechanisms of CF-driven respiratory infection by Mabs and propose boosting of the NRF2-NQO1 axis as a potential host-directed strategy to improve Mabs infection control.


Conflict of interest statement

Julien Mazières reports grants or contracts from Astra Zeneca, Roche and Pierre Fabre; and payment or honoraria for board and expertise (personal and institution) from Merck, Astra Zeneca, BMS, MSD, Roche, Novartis, Daiichi, and Pfizer; outside the submitted work. Hans Clevers reports invention on patents related to organoid research. His full disclosure: www.uu.nl/staff/JCClevers/Additional function. The other authors have declared no competing interests.

Figures

Fig 1
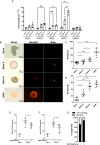
Fig 1. Mabs infection in airway organoids.
(A) Mabs S (Day 0 n = 7; Day 4 n = 22) and R (Day 0 n = 7; Day 4 n = 22) growth in healthy AOs (H-AO). (B) Representative images of a mock (PBS) infected AO or AOs infected with tdTomato-expressing Mabs S or R. (C) Light-sheet fluorescence microscopy of a XY plane at the z = 120μm (left two images) or z = 80μm (right two images) positions of an AO infected with Mabs S or R, respectively; Zoom-in image of the yellow square zone. (D) Electron micrographs obtained with a FEI Quanta200 scanning electron microscope set up in back-scattered mode. Resin blocks were sectioned and imaged at different magnifications showing normal AO organization and the different cell types typical of lung epithelium (top row, panel 1’: left arrow indicates microvilli, right arrow indicates cilia; panel 2: arrow indicates a goblet cell; panel 3: arrow indicates a club cell), the biofilm formed by Mabs S on the luminal face of the epithelial cells (middle row, panel 5: left arrow indicates bacteria; right arrow indicates cilia; panel 6 & 6’: asterisks indicate the extracellular polymeric substance surrounding Mabs S), and the bacterial aggregates typical of the cording in the lumen of Mabs R infected AOs (bottom row, panel 9: arrows indicate electron dense deposit lining Mabs R making cords). Targeted ultrathin sections were made and observed by transmission electron microscopy (images 5 and 8). (E) Mean percentage of organoids containing Mabs R cords after 0 (n = 8), 2 (n = 8), or 4 (n = 8) days of infection. (F, G) Representative images (F) and Mean Fluorescence Intensity (MFI) quantification (G) of propidium iodide incorporation (50 μg ml-1) in mock infected AOs (n = 13) or AOs infected with Wasabi-expressing Mabs S (n = 17) or R (n = 15) for 4 days. The dotted lines delimit the organoids circumference. Except otherwise stated, graphs represent means ± SD from at least two independent experiments, indicated by different symbols. Each dot represents one organoid. *P<0.05; **P<0.01; ***P<0.001 by Mann-Whitney test.
Fig 2
Fig 2. S and R Mabs promote an oxidative environment in airway organoids.
(A) Expression patterns of ROS-related genes in mock-infected H-AOs or H-AOs infected with Mabs S or R for 4 days. Graph represents means ± SEM from three independent experiments, performed in triplicates. *P<0.05; **P<0.01; ***P<0.001 by unpaired T test. (B, C) Representative images (B) and MFI quantification (C) of mitochondrial ROS production (5μM MitoSOX) in mock-infected H-AOs (n = 17) or H-AO infected with Wasabi-labelled Mabs S (n = 13) or R (n = 8) for 3 days. (D) MFI quantification of H2O2 production (10μM H2DCFDA) in mock-infected AOs (n = 7) or AOs infected with tdTomato-labelled Mabs S (n = 7) or R (n = 7) for 3 days. (E, F) Bacterial load by CFU assay of H-AOs pre-treated with (+) or without (-) 10μM sulforaphane for 6hr before infection with Mabs S (E) (n+ = 8; n- = 8) or R (F) (n+ = 9; n- = 9) for 4 days. (G) Mean percentage of H-AOs exhibiting cords after 4 days of infection with Mabs R, in the presence (n+ = 9) or absence (n- = 8) of 10 μM sulforaphane treatment. Except otherwise stated, graphs represent means ± SD from at least two independent experiments, indicated by different symbols. Each dot represents one organoid. *P<0.05; **P<0.01; ***P<0.001, ****P<0.0001 by Mann-Whitney test.
Fig 3
Fig 3. Patient-derived airway organoids recapitulate cystic fibrosis-driven oxidative stress.
(A) Percentage of area increase of H-AOs (Donor 1 n = 13, Donor 2 n = 14, Donor 3 n = 13), CF-AOs (Donor 1 n = 13, Donor 2 n = 11, Donor 3 n = 10), and H-AOs pre-treated with CFTR inhibitors (25μM CFTRinh-172 and GlyH 101 for 4 days) (CFTR-Inh n = 13) after 2hr stimulation with 5μM forskolin. Data from two independent experiments. (B) The volcano plot showing the fold-change (x-axis) versus the significance (y-axis) of the proteins identified by LC–MS/MS in CF-AOs vs in H-AOs. The significance (non-adjusted p-value) and the fold-change are converted to −Log10(p-value) and Log2(fold-change), respectively. (C, D) Representative images (C) and MFI quantification (D) of mucus staining (10μM Zinpyr-1) in H-AOs (n = 10) and CF-AOs (n = 8). (E) Gene Ontology enrichment analysis showing the most enriched Biological Processes and their associated p-values (calculated using the Bonferroni correction for multiple testing) related to the list of up-regulated proteins in CF patients compared to healthy ones. (F, G) Representative images (F) and MFI quantification (G) of basal mitochondrial ROS production (5μM MitoSOX) in H-AOs (Donor 1 n = 6, Donor 2 n = 8, Donor 3 n = 8) and CF-AOs (Donor 1 n = 6, Donor 2 n = 8, Donor 3 n = 8). Data from two independent experiments. As positive controls for ROS production, two wells of healthy or CF organoids were treated for 1hr at 37°C with 20mM tert-Butyl hydroperoxide (tBHP) (H-AOs n = 6; CF-AOs n = 9) or a mix of 5μM rotenone and 5μM antimycin A (H-AOs n = 26; CF-AOs n = 21). (H) MFI quantification of basal H2O2 production (10μM H2DCFDA) in H-AOs (-tBHP n = 12; +tBHP n = 13) and CF-AOs (-tBHP n = 22; +tBHP n = 18). (I, J) Representative images (I) and MFI quantification (J) of peroxidized lipids (2μM BODIPY) in H-AOs (n = 14) and CF-AOs (n = 14). As positive control for lipid peroxidation induction, healthy (n = 6) or CF (n = 6) AOs were treated with 800μM cumene hydroperoxide for 2hr at 37°C. (K) MFI quantification of the basal plasma membrane permeabilization (50 μg ml-1 propidium iodide incorporation) in H-AOs (n = 6) and CF-AOs (n = 6). Except otherwise noted, graphs represent means ± SD from at least two independent experiments indicated by different symbols. Each dot represents one organoid. *P<0.05; **P<0.01; ***P<0.001, ****P<0.0001 by Mann-Whitney test.
Fig 4
Fig 4. Oxidative stress in cystic fibrosis benefits Mabs growth.
(A, B) Bacterial load by CFU assay of H-AOs and CF-AOs infected for 4 days with Mabs S (A) (healthy Donor 1 n = 11, Donor 2 n = 7, Donor 3 n = 7; cystic fibrosis Donor 1 n = 15, Donor 2 n = 7, Donor 3 n = 7) or R (B) (n healthy = 10; n cystic fibrosis = 13). (C) Representative images of Wasabi-labelled Mabs S or R 4 days-infected H-AOs and CF-AOs. (D) Mean percentage of H-AOs (n = 12) and CF-AOs (n = 7) exhibiting Mabs R cords after 4 days of infection. (E) MFI quantification of mitochondrial ROS production (5μM MitoSOX) in H-AOs and CF-AOs infected with Wasabi-expressing Mabs S (H-AOs n = 13; CF-AOs n = 11) or Mabs R (H-AOs n = 8; CF-AOs n = 11) for 3 days. Data are normalized to their respective Mock-infected H-AOs and CF-AOs (H-AOs n = 17; CF-AOs n = 6) control (F, G) MFI quantification (F) and representative images (G) of propidium iodide incorporation (50 μg ml-1) in H-AOs and CF-AOs infected with Wasabi-expressing Mabs S (H-AOs n = 6; CF-AOs n = 6) or Mabs R (H-AOs n = 13; CF-AOs n = 12) for 4 days. Data are normalized to their respective Mock-infected H-AOs and CF-AOs (H-AOs n = 9; CF-AOs n = 10) control. (H) MFI quantification of GFP in Mock-infected H-AOs and CF-AOs (H-AOs n = 5; CF-AOs n = 5) or H-AOs and CF-AOs infected with Mrx1-roGFP2-expressing Mabs S (H-AO n = 15; CF-AO n = 20) for 4 days. As a positive control for ROS induction, H-AOs (n = 15) were exposed to 200μM tBHP for 1 hour prior infection, which was maintained all along the experiment. (I) MFI quantification of GFP in Mock-infected CF-AOs (n = 6) or CF-AOs infected with Mrx1-roGFP2-expressing Mabs S (n = 11) or Mabs R (n = 11) for 4 days. Except otherwise noted, graphs represent means ± SD from at least two independent experiments indicated by different symbols. Each dot represents one organoid. *P<0.05; **P<0.01; ***P<0.001; ****P<0.0001 by Mann-Whitney test.
Fig 5
Fig 5. The NRF2-NQO1 axis mitigates oxidative stress and Mabs growth in CF-AOs.
(A) MFI quantification of mitochondrial ROS production (5μM MitoSOX) in H-AOs (n = 10) and CF-AOs (n+ = 12; n- = 12) after 4 days of being treated with (+) or without (-) 10μM sulforaphane. (B) Expression of the NRF-2-regulated gene NQO1 in H-AOs and CF-AOs after 4 days of being treated with or without 10μM sulforaphane. Graph represents means from at least three pooled independent experiments, performed in triplicates. *P<0.05 by unpaired T test. (C) Bacterial load by CFU assay in CF-AOs pre-treated or not with 10μM sulforaphane for 6 hr before infection with Mabs S (treated n = 13; untreated n = 14) or Mabs R (treated n = 13; not-treated n = 12) for 4 days. When stated, the NQO1 inhibitor was added (10μM dicoumarol) (Mabs S n = 6; Mabs R n = 6) simultaneously with sulforaphane and maintained all along the experiment. (D) Mean percentage of CF-AOs untreated (n = 6) or treated with 10μM sulforaphane alone (n = 7) or in combination with 10μM dicoumarol (n = 7), exhibiting Mabs R cords after 4 days of infection. (E) MFI quantification of mitochondrial ROS production (5μM MitoSOX) in CF-AOs pre-treated or not with 10μM sulforaphane for 6 hr before infection with Wasabi-expressing Mabs S (treated n = 11; untreated n = 11) for 3 days. When stated, at day 2 post-infection, 20μg/ml of cefoxitin was added with (n = 13) or without (n = 9) 10μM sulforaphane. (F) Bacterial load by CFU assay of CF-AOs pre-treated with (n = 6) or without (n = 6) 10μM sulforaphane for 6 hr before infection with Mabs S for 4 days. When stated, at day 2 of the infection, 20μg/ml of cefoxitin was added with (n = 6) or without (n = 6) 10μM sulforaphane. Except otherwise stated, graphs represent means ± SD from at least two independent experiments indicated by different symbols. Each dot represents one organoid. *P<0.05; **P<0.01, ***P<0.001, ****P<0.0001 by Mann-Whitney test.

References

    1. Dechecchi MC, Tamanini A, Cabrini G. Molecular basis of cystic fibrosis: from bench to bedside. Ann Transl Med. 2018;6: 334–334. doi: 10.21037/atm.2018.06.48 - DOI - PMC - PubMed
    1. Lopes-Pacheco M. CFTR Modulators: The Changing Face of Cystic Fibrosis in the Era of Precision Medicine. Front Pharmacol. 2019;10: 1662. doi: 10.3389/fphar.2019.01662 - DOI - PMC - PubMed
    1. Lopeman RC, Harrison J, Desai M, Cox JAG. Mycobacterium abscessus: Environmental bacterium turned clinical nightmare. Microorganisms. 2019;7. doi: 10.3390/microorganisms7030090 - DOI - PMC - PubMed
    1. Koh WJ, Stout JE, Yew WW. Advances in the management of pulmonary disease due to Mycobacterium abscessus complex. International Journal of Tuberculosis and Lung Disease. International Union against Tubercul. and Lung Dis.; 2014. pp. 1141–1148. doi: 10.5588/ijtld.14.0134 - DOI - PubMed
    1. Floto RA, Olivier KN, Saiman L, Daley CL, Herrmann JL, Nick JA, et al.. US Cystic Fibrosis Foundation and European Cystic Fibrosis Society consensus recommendations for the management of non-tuberculous mycobacteria in individuals with cystic fibrosis. Thorax. 2016;71 Suppl 1: i1–i22. doi: 10.1136/thoraxjnl-2015-207360 - DOI - PMC - PubMed

Publication types

LinkOut - more resources