

Starling: Introducing a mesoscopic scale with Confluence for Graph Clustering
- PMID: 37619240
- PMCID: PMC10449208
- DOI: 10.1371/journal.pone.0290090
Starling: Introducing a mesoscopic scale with Confluence for Graph Clustering
Abstract
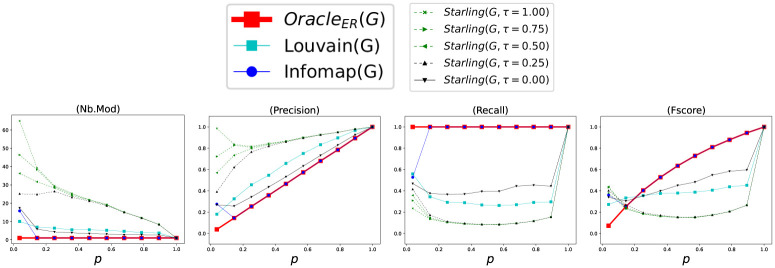
Given a Graph G = (V, E) and two vertices i, j ∈ V, we introduce Confluence(G, i, j), a vertex mesoscopic closeness measure based on short Random walks, which brings together vertices from a same overconnected region of the Graph G, and separates vertices coming from two distinct overconnected regions. Confluence becomes a useful tool for defining a new Clustering quality function QConf(G, Γ) for a given Clustering Γ and for defining a new heuristic Starling to find a partitional Clustering of a Graph G intended to optimize the Clustering quality function QConf. We compare the accuracies of Starling, to the accuracies of three state of the art Graphs Clustering methods: Spectral-Clustering, Louvain, and Infomap. These comparisons are done, on the one hand with artificial Graphs (a) Random Graphs and (b) a classical Graphs Clustering Benchmark, and on the other hand with (c) Terrain-Graphs gathered from real data. We show that with (a), (b) and (c), Starling is always able to obtain equivalent or better accuracies than the three others methods. We show also that with the Benchmark (b), Starling is able to obtain equivalent accuracies and even sometimes better than an Oracle that would only know the expected overconnected regions from the Benchmark, ignoring the concretely constructed edges.
Copyright: © 2023 Bruno Gaume. This is an open access article distributed under the terms of the Creative Commons Attribution License, which permits unrestricted use, distribution, and reproduction in any medium, provided the original author and source are credited.
Conflict of interest statement
The authors have declared that no competing interests exist.
Figures


References
-
- Albert R, Barabasi AL. Statistical Mechanics of Complex Networks. Reviews of Modern Physics. 2002;74:74–47. doi: 10.1103/RevModPhys.74.47 - DOI
-
- Newman MEJ. The Structure and Function of Complex Networks. SIAM Review. 2003;45:167–256. doi: 10.1137/S003614450342480 - DOI
-
- Bonacich P, Lu P. Introduction to mathematical sociology. Princeton University Press; 2012.
Publication types
MeSH terms
LinkOut - more resources
Full Text Sources
