. 2023 Sep 1;40(9):msad187.
doi: 10.1093/molbev/msad187.

The Architecture of Metabolic Networks Constrains the Evolution of Microbial Resource Hierarchies

Affiliations

The Architecture of Metabolic Networks Constrains the Evolution of Microbial Resource Hierarchies

Sotaro Takano et al. Mol Biol Evol. .

Abstract

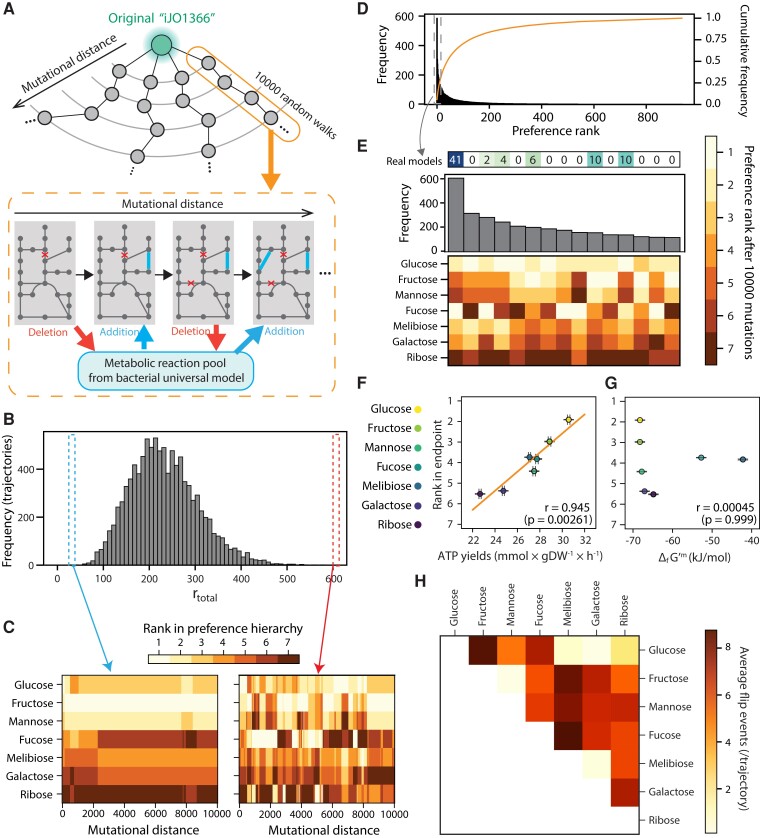
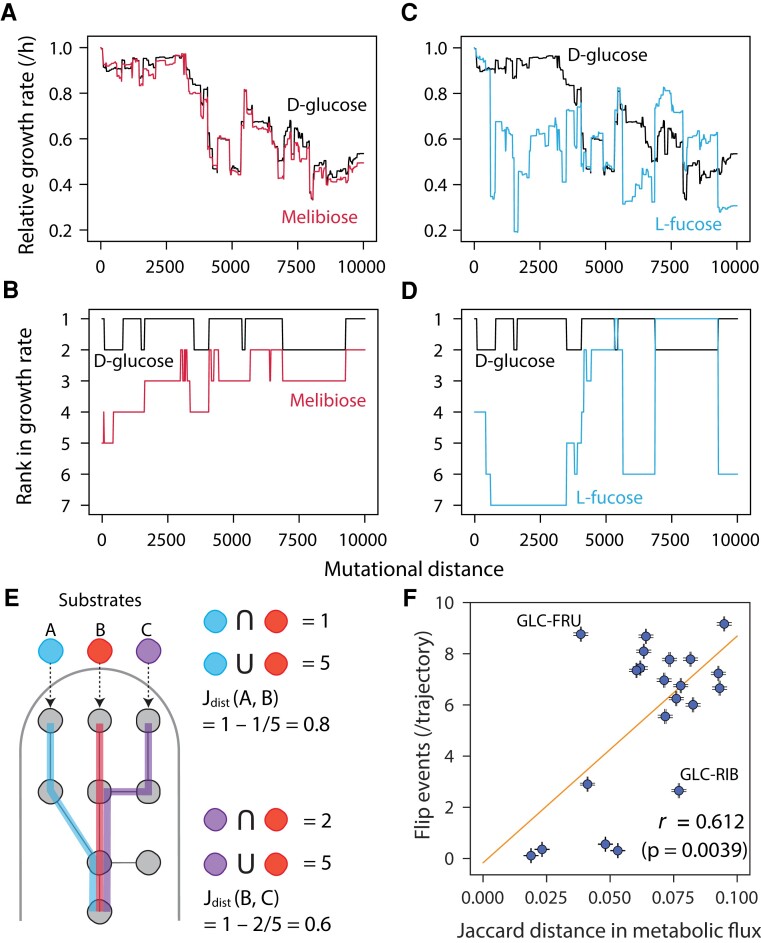
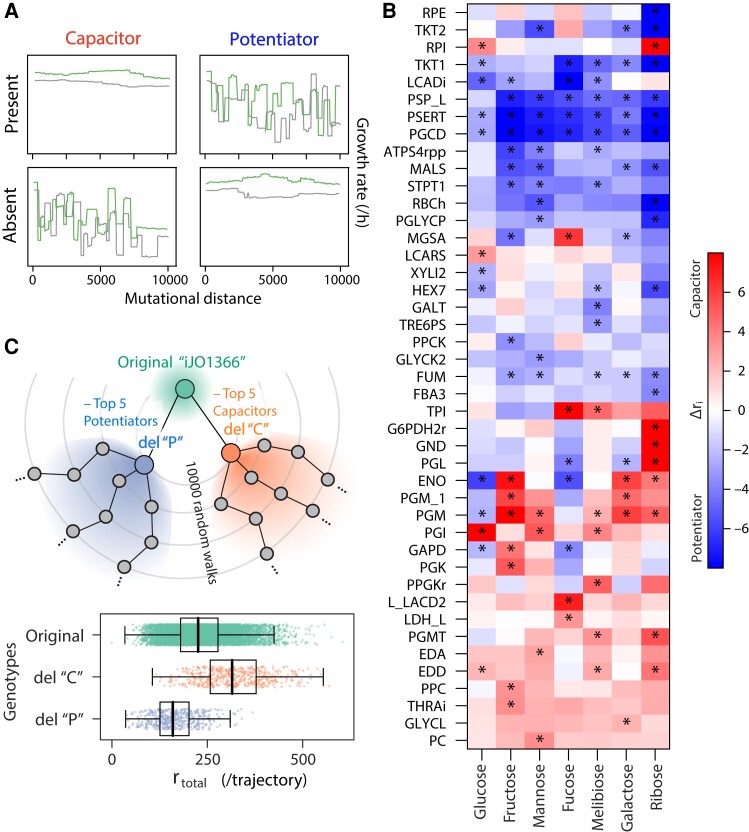
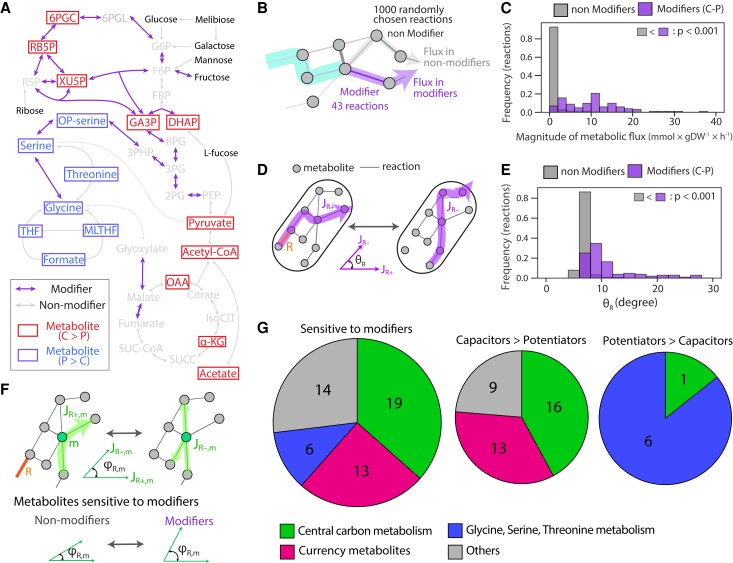
Microbial strategies for resource use are an essential determinant of their fitness in complex habitats. When facing environments with multiple nutrients, microbes often use them sequentially according to a preference hierarchy, resulting in well-known patterns of diauxic growth. In theory, the evolutionary diversification of metabolic hierarchies could represent a mechanism supporting coexistence and biodiversity by enabling temporal segregation of niches. Despite this ecologically critical role, the extent to which substrate preference hierarchies can evolve and diversify remains largely unexplored. Here, we used genome-scale metabolic modeling to systematically explore the evolution of metabolic hierarchies across a vast space of metabolic network genotypes. We find that only a limited number of metabolic hierarchies can readily evolve, corresponding to the most commonly observed hierarchies in genome-derived models. We further show how the evolution of novel hierarchies is constrained by the architecture of central metabolism, which determines both the propensity to change ranks between pairs of substrates and the effect of specific reactions on hierarchy evolution. Our analysis sheds light on the genetic and mechanistic determinants of microbial metabolic hierarchies, opening new research avenues to understand their evolution, evolvability, and ecology.

Keywords: genotype–phenotype maps; metabolic hierarchies; microbial evolution.


Figures

Fig. 1.
Fig. 1.
Some sugar hierarchies are easier to evolve than others. (A) A schematic of random walk trajectories through genotype space. At each step, a reaction from the model is exchanged by a new reaction from a universal bacterial reaction set (“universal model,” see Materials and Methods). (B) Large variation in metabolic hierarchy rewiring among random walk trajectories. The histogram shows the frequency of total rank flip events (rtotal) during random walks in the 9,974 trajectories. (C) Changes in metabolic hierarchy along an example random-walks trajectory. We show two cases, where the rank swaps rarely (left) or frequently (right) occurred. The preference rank of each sugar at each mutational distance is shown as a heatmap. (D) Convergence of the preference rank to small subsets among all possible preference ranks after random walks. The histogram shows the frequency of each preference rank at the end of the random walks in the 9,974 evolutionary trajectories. The line shows the cumulative distribution of the frequency of preference rank. (E) Zoom of the top 15 most frequent metabolic hierarchies, representing the final point of 3,068 of 9,974 trajectories (histogram), or about ∼30% of the total. We displayed the number of a real organism's models whose preference rank matches each rank configuration. (F) Correlation between the average rank of seven sugars and the average ATP yields at the end of random walks (n = 1,000 genotypes; see Materials and Methods). (G) Correlation between Gibbs free energy of a sugar and the average ranks at the end point in seven sugars. Gibbs free energy was normalized by the number of carbons. In both panels, Pearson's correlations were displayed with P-value obtained using a permutation test (see Materials and Methods). (H) Average number of rank flip events between pairs of sugars during random walks in 9,974 evolutionary trajectories. Sugars are ordered by their initial preference rank in the E. coli model.
Fig. 2.
Fig. 2.
Metabolic dissimilarity predicts hierarchy flips in pairs of substrates (A) and representative random walk trajectories (C). Two trajectories are compared for a metabolically similar (glucose and melibiose, A) and dissimilar (glucose and fucose, C) pairs of sugars. (B) and (D) Resource preference trajectories in the same trajectories shown in (A) and (C). (E) A schematic of calculating Jaccard distance in processing metabolic pathways between two sugars. The number of commonly used reactions for processing both two sugars was divided by the total metabolic reactions used to process each sugar (i.e., Jaccard similarity), and this value was subtracted from 1. In this scheme, we show examples in two pairs of sugars. (F) The dissimilarity in metabolic pathway (Jaccard distance) predicts the rank-flip events in 21 pairs of sugars. An orange line shows linear regressions, the error bars indicate ±SEM, and r stands for Pearson's correlations (N = 9,974) with Mantel test (106 permutations).
Fig. 3.
Fig. 3.
Propensity of rank flips strongly depends on the genetic background. (A) A schematic of the mutational effect of evolutionary capacitors and potentiators on growth-rate trajectories and propensity of rank flips. If the presence of the reaction of interest caused little effect on growth rate and the preference rank (top left) but its deletion caused their frequent changes (bottom left), such reaction was regarded as a “capacitor.” On the other hand, if the growth rate changes and rank flips were prevented by the deletion of the reaction (bottom right) but promoted in its presence, such reaction was regarded as a “potentiator.” Briefly, we screened those evolutionarily important reactions by computing the difference in rank flips (ri) between its presence [ri (TR+)] or absence [ri (TR−)] (Δri, see Materials and Methods). (B) Screened evolutionary capacitors and potentiators in metabolic networks by statistical analysis (P-value <0.01, FDR corrected). Δri in each metabolic reaction was shown as a heatmap. We put asterisks for significant reaction–sugar pairs. The shown metabolic reaction IDs correspond to BiGG ID. (C) Opposite effect on the propensity of rank flips between the deletions of capacitors or potentiators. We deleted 5 potentiators (“del P”) or capacitors (“del C”) from iJO1366 and performed 10,000 random walks by starting from each of them. Box and strip plots show the number of total rank flip events across 7 sugars during random walks (N = 500) in the displayed genetic backgrounds. Bold black lines indicate medians of each data.
Fig. 4.
Fig. 4.
Specific reactions and metabolites govern the effects of mutations on resource hierarchies. (A) The locations of evolutionary modifiers and sensitive metabolites to the modifiers in a metabolic network. Here, we mapped them on the central carbon metabolic pathways, that is PPP, glycolysis, glycine/serine/threonine pathway, and TCA cycle, where many of those are involved. Metabolites that were more strongly affected by capacitors or potentiators are colored by red and blue, respectively. (B) and (C) Comparison of magnitude of flux between modifiers and nonmodifiers. We randomly picked out 1,000 evolved models and calculated the average flux carried by 43 reactions screened as modifiers (purple) and randomly chosen 1,000 nonmodifier reactions (gray) across 7 sugars (7301 reaction-sugar pairs). Among those, we selected the pairs working as modifiers (marked with asterisks in fig. 3B, N = 107) and compared them with other pairs (nonmodifier pairs, N = 7,194). Comparison of mean value and statistical significance level were indicated (Wilcoxon rank-sum test). (D) A schematic of “flux sensitivity” analysis. For randomly picked 1,000 evolved models, we added or deleted the target reaction R depending on whether it exists or not. Then, we calculated the cosine similarity of the total flux distribution between presence (JR+) or absence (JR−) of the reaction (θR). Similarly to (B) and (C), we calculated θR of 43 modifiers and 1000 nonmodifiers for each of 7 sugars, and θR is used as the proxy for flux sensitivity for the reaction R on each sugar. (E) Comparison of flux sensitivity (θR) among nonmodifiers (non C-P) or modifiers (C-P). Among 7,301 reaction-sugar pairs, we selected the pairs exhibiting statistically significant effects (marked with asterisks in fig. 3B). Then, we checked whether θR is significantly larger in modifiers than nonmodifiers (Wilcoxon rank-sum test, P-value is shown in the panel). (F) A schematic of flux sensitivity analysis for metabolites. For each metabolite m, influx and efflux to m were analyzed before and after a deletion or addition of a reaction of interest R. Then, cosine similarity between JR+,m, and JR−,m was calculated (φR,m). By comparing φR,m, we screened the metabolites that are significantly more sensitive to the modifiers. (G) Typical metabolites whose flux is sensitive to modifiers. We categorized the screened metabolites, which are sensitive to either capacitors or potentiators (supplementary fig. S9 and supplementary table S1, Supplementary Material online) into four groups: central carbon metabolism (green), currency metabolites (red), glycine/serine/threonine metabolism (blue), and others (gray) and shown its ratio as a pie chart (left pie chart). We also showed the number of metabolites that are more sensitive to capacitors (middle pie chart) or potentiators (right pie chart) in each category.

References

    1. Aguilar-Rodríguez J, Payne JL, Wagner A. 2017. A thousand empirical adaptive landscapes and their navigability. Nat Ecol Evol. 1:45. - PubMed
    1. Aguilar-Rodríguez J, Wagner A. 2018. Metabolic determinants of enzyme evolution in a genome-scale bacterial metabolic network. Genome Biol Evol. 10:3076–3088. - PMC - PubMed
    1. Aidelberg G, Towbin BD, Rothschild D, Dekel E, Bren A, Alon U. 2014. Hierarchy of non-glucose sugars in Escherichia coli. BMC Syst Biol. 8:133. - PMC - PubMed
    1. Bajic D, Sanchez A. 2020. The ecology and evolution of microbial metabolic strategies. Curr Opin Biotechnol. 62:123–128. - PubMed
    1. Bajić D, Vila JCC, Blount ZD, Sánchez A. 2018. On the deformability of an empirical fitness landscape by microbial evolution. Proc Natl Acad Sci U S A. 115:11286–11291. - PMC - PubMed

Publication types