. 2023 Nov 22;193(4):2361-2380.
doi: 10.1093/plphys/kiad471.

CALEOSIN 1 interaction with AUTOPHAGY-RELATED PROTEIN 8 facilitates lipid droplet microautophagy in seedlings

Affiliations

CALEOSIN 1 interaction with AUTOPHAGY-RELATED PROTEIN 8 facilitates lipid droplet microautophagy in seedlings

Magdalena Miklaszewska et al. Plant Physiol. .

Abstract

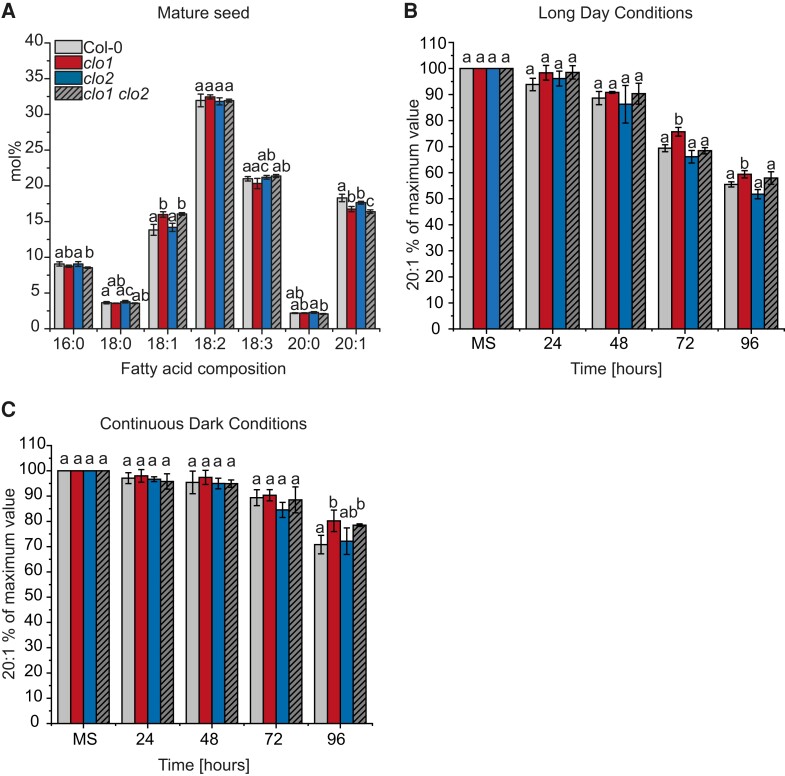
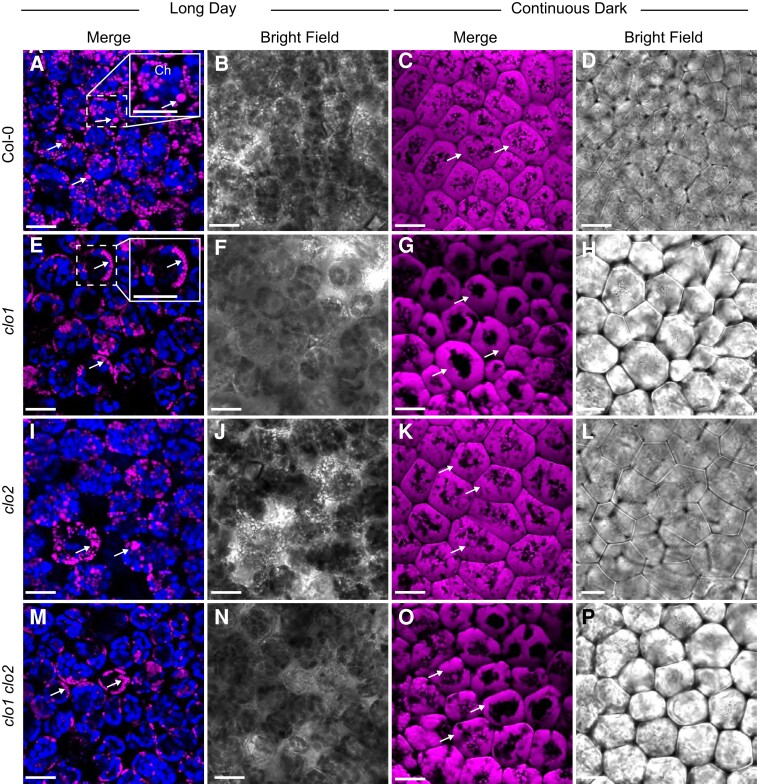
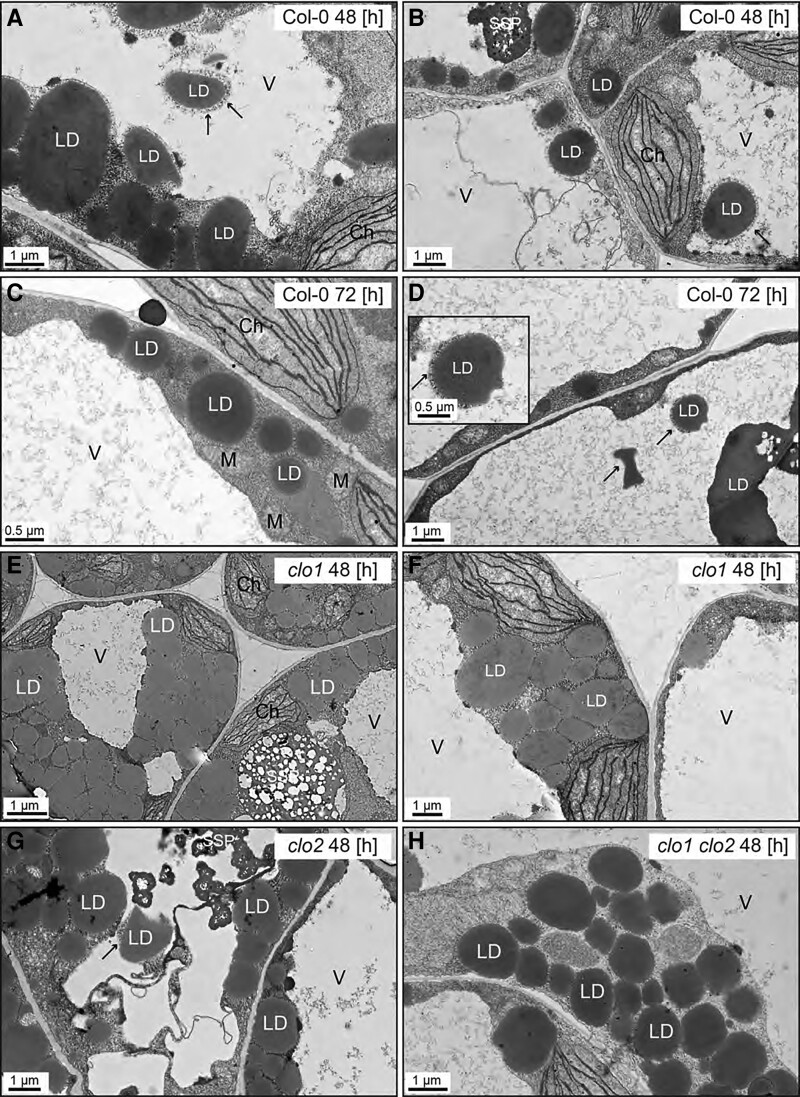
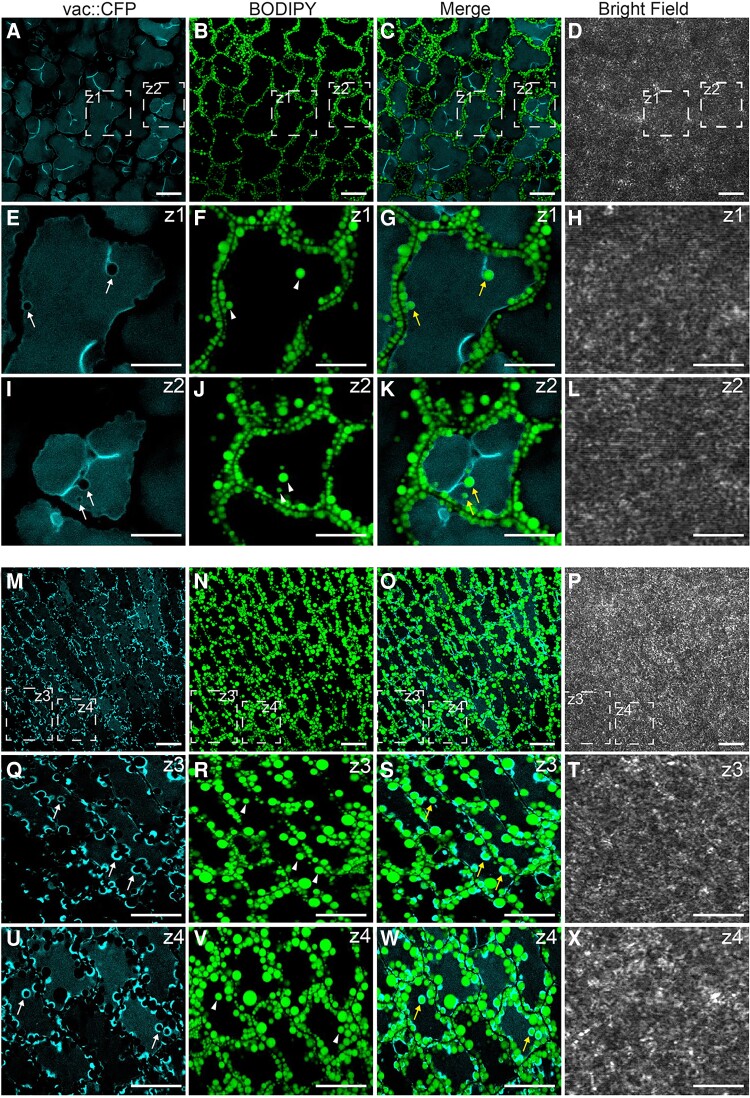
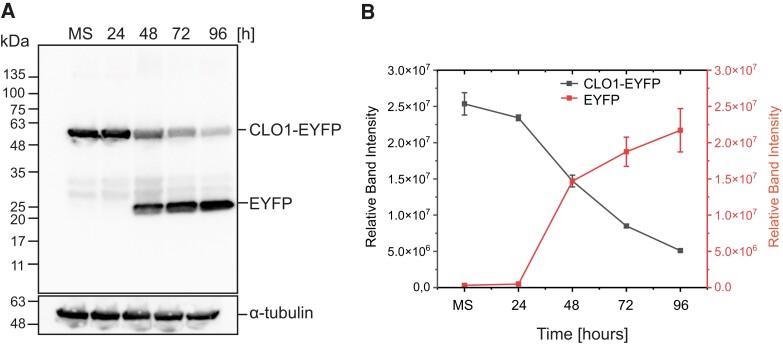
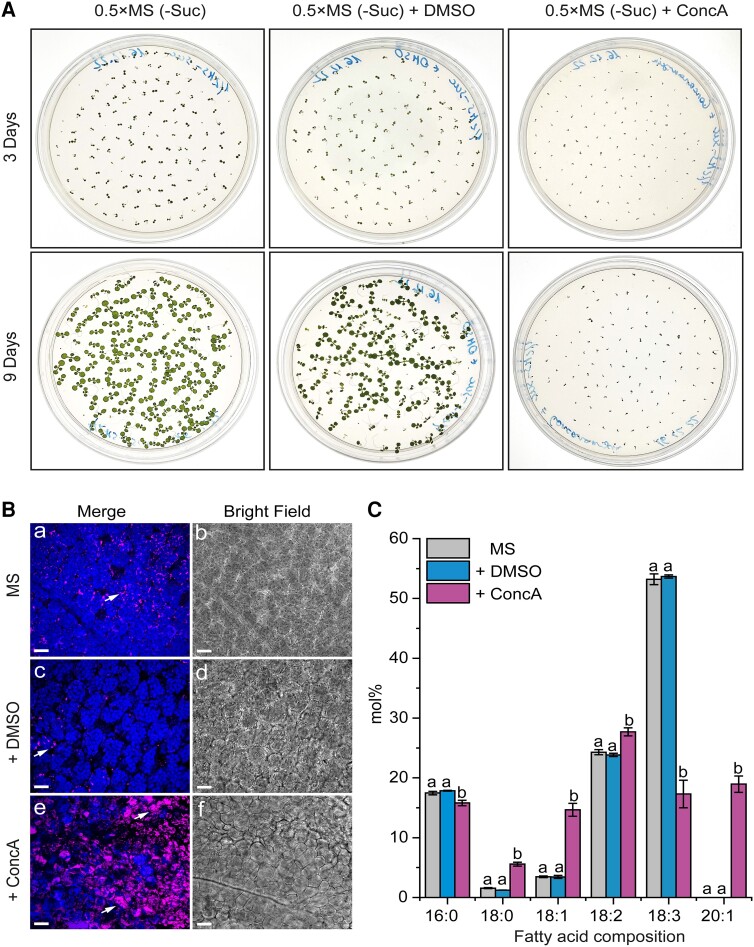
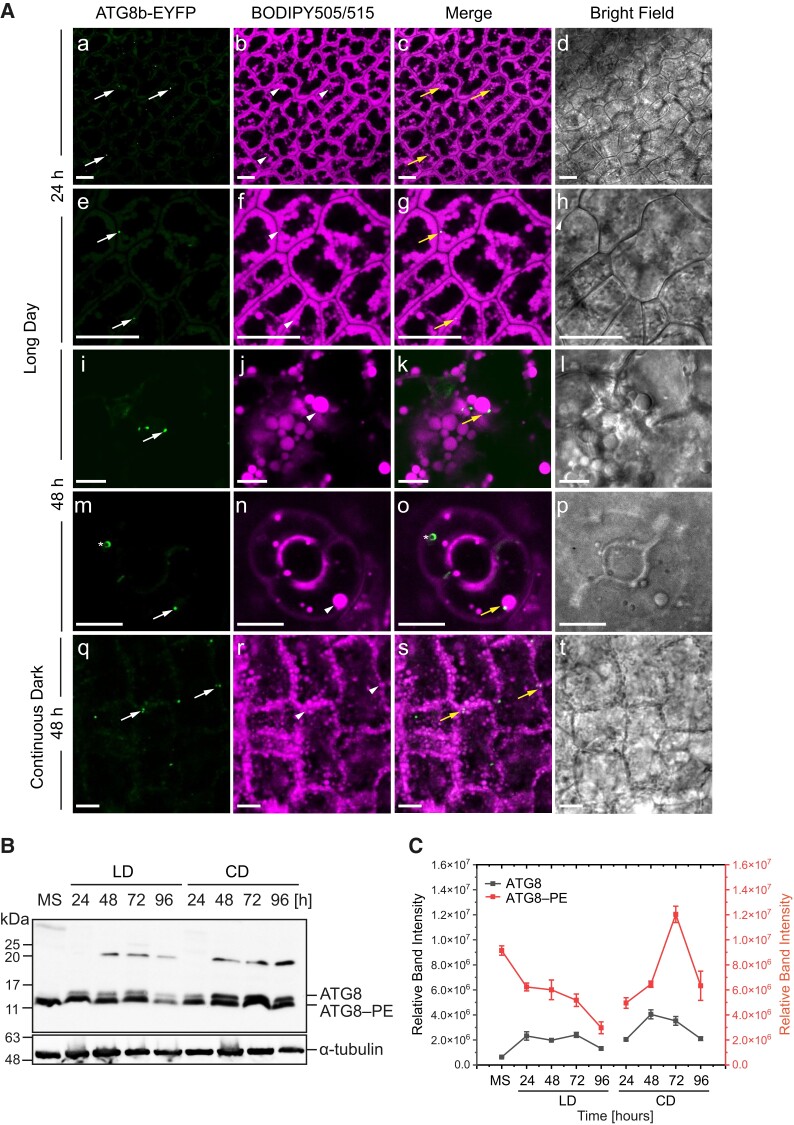
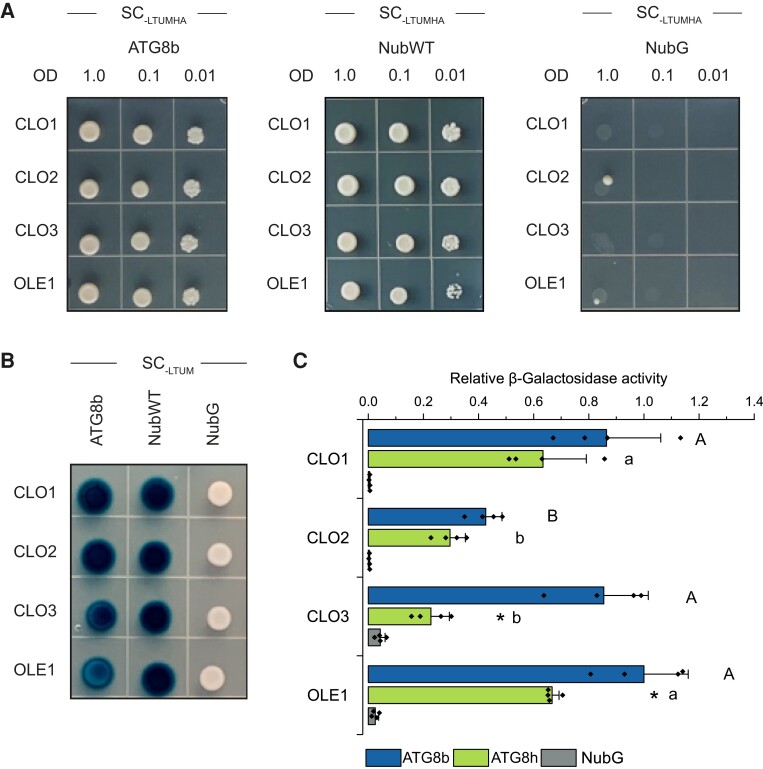
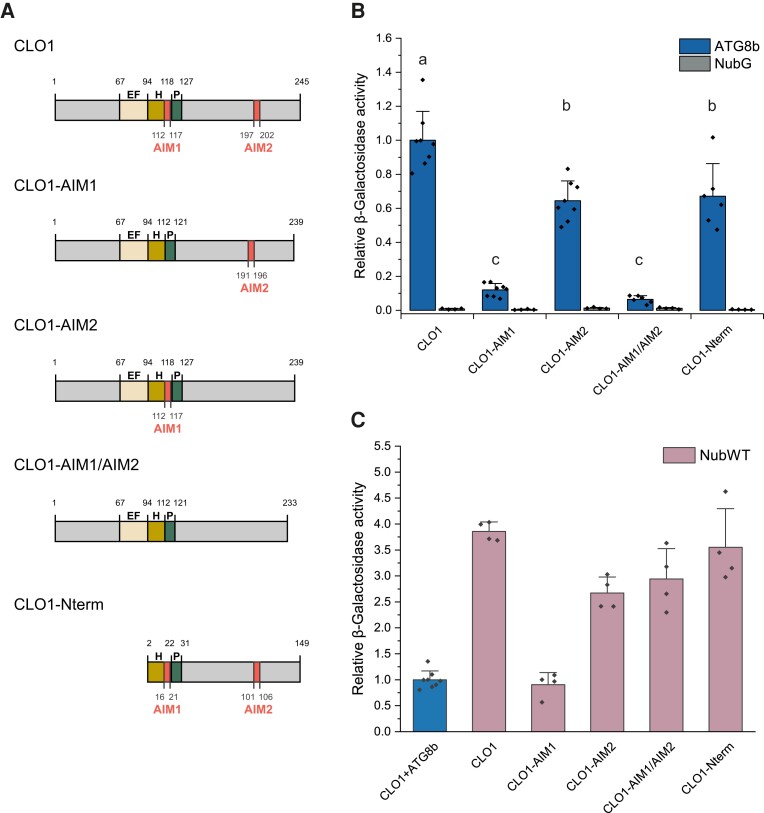
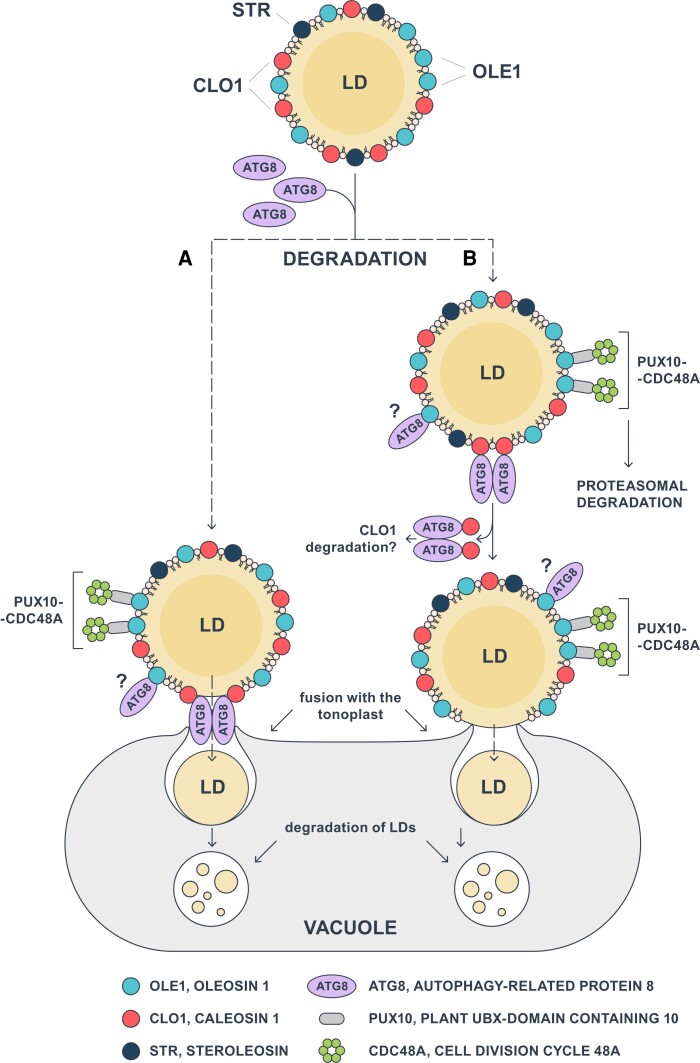
Lipid droplets (LDs) of seed tissues are storage organelles for triacylglycerols (TAGs) that provide the energy and carbon for seedling establishment. In the major route of LD degradation (lipolysis), TAGs are mobilized by lipases. However, LDs may also be degraded via lipophagy, a type of selective autophagy, which mediates LD delivery to vacuoles or lysosomes. The exact mechanisms of LD degradation and the mobilization of their content in plants remain unresolved. Here, we provide evidence that LDs are degraded via a process morphologically resembling microlipophagy in Arabidopsis (Arabidopsis thaliana) seedlings. We observed the entry and presence of LDs in the central vacuole as well as their breakdown. Moreover, we show co-localization of AUTOPHAGY-RELATED PROTEIN 8b (ATG8b) and LDs during seed germination and localization of lipidated ATG8 (ATG8-PE) to the LD fraction. We further demonstrate that structural LD proteins from the caleosin family, CALEOSIN 1 (CLO1), CALEOSIN 2 (CLO2), and CALEOSIN 3 (CLO3), interact with ATG8 proteins and possess putative ATG8-interacting motifs (AIMs). Deletion of the AIM localized directly before the proline knot disrupts the interaction of CLO1 with ATG8b, suggesting a possible role of this region in the interaction between these proteins. Collectively, we provide insights into LD degradation by microlipophagy in germinating seeds with a particular focus on the role of structural LD proteins in this process.


Conflict of interest statement

Conflict of interest statement. None declared.

Figures

Figure 1.
Figure 1.
Mutation in CLO1, but not in CLO2, affects TAG degradation. A) Changes in mature seed (MS) FA composition between Col-0, clo1, clo2, and clo1 clo2. B and C) Changes in 20:1 content are presented as a percentage of the amount determined in the same number of mature seeds. The analysis was performed during germination course under long day B) and continuous dark C) conditions. Data are means ± Sd from 2 independent experiments with 6 biological replicates (n = 6). The experiment was repeated 3 times with similar results using independent biological samples. Statistical analysis was performed by 1-way ANOVA with Tukey’s post hoc test. Different letters indicate significant differences with P < 0.05. 16:0, palmitic acid; 18:0, stearic acid; 18:1, oleic acid; 18:2, linoleic acid; 18:3, linolenic acid; 20:0, arachidic acid; 20:1, eicosenoic acid; 24, 48, 72 and 96 h—time of seed germination.
Figure 2.
Figure 2.
LDs accumulate around the central vacuole in clo1 and clo1clo2. Representative CLSM images of the cotyledon cells of Col-0 (A to D), clo1 (F to H), clo2 (I to L), clo1 clo2 (M to P) after 48 h of germination under long day and continuous dark conditions showing LDs stained with BODIPY 505/515 (arrows) and chlorophyll (Ch). The insets in A and E correspond to magnified areas marked with the dashed line. Bars = 15 µm.
Figure 3.
Figure 3.
Disruption of CLO1, but not of CLO2, impairs LDs entering the central vacuole. Representative TEM images of Arabidopsis cotyledon cells. A–D) Ultrastructure of Col-0 cotyledon cells after 48 h (A and B) and 72 h (C and D) of in vitro germination. LDs are present in the cytoplasm as well as inside the vacuole. The LDs visible in the area of the vacuole are surrounded by cytoplasmic material (arrows). (E and F) Ultrastructure of clo1 cotyledon cells after 48 h of in vitro germination. LDs are localized only in the cytoplasm around the vacuole. G) Ultrastructure of clo2 cotyledon cells after 48 h of in vitro germination. LDs can be seen in the cytoplasm and inside the vacuole. H) Ultrastructure of clo1 clo2 cotyledon cells after 48 h of in vitro germination. LDs occupy only the cytoplasmic area. Ch, chloroplast; LD, lipid droplet; M, mitochondrion; SSP, seed storage protein; V, vacuole.
Figure 4.
Figure 4.
Subset of LDs is degraded via microlipophagy during seed germination. Representative CLSM images of the cotyledon cells of Col-0 after 36 h A to L) and 48 h M–X) of seed germination under long day conditions. LDs were stained with BODIPY 505/515. Tonoplast marker protein fused to the CFP is visible as blue. The white arrows indicate tonoplast invaginations, the arrowheads indicate LDs, and the yellow arrows indicate LDs surrounded by CFP-labeled tonoplast invaginations. The areas marked with dashed lines (Z) represent zoomed views of the corresponding image. Bars = 10 µm.
Figure 5.
Figure 5.
Accumulation of free EYFP derived from CLO1-EYFP occurs during seed germination. A) Immunoblot analysis of CLO1-EYFP and free EYFP pools during seed in vitro germination; α-tubulin was used as a loading control. B) Densitometric data corresponding to CLO1-EYFP and free EYFP bands from A). Each data point represents the average of 3 independent experiments. Values represent the means ± Sd (n = 3). CLO1, CALEOSIN 1; EYFP, enhanced yellow fluorescent protein; MS, mature seed; 24, 48, 72 and 96 h—time of seed germination.
Figure 6.
Figure 6.
ConcA treatment hampers seed germination and TAG degradation. A) Comparison of seed germination and seedling growth after 3 d (upper panel) and 9 d (lower panel) of cultures growing on control (0.5×MS-Suc), solvent control (DMSO), and ConcA-containing media. B) Representative CLSM images of the cotyledon cells of 9-d-old seedlings from A). The arrows indicate LDs, and chloroplasts are shown in blue. C) Comparison of lipid FA composition between 9-d-old seedling cultures from A). Data are means ± Sd from 2 independent experiments with 6 biological replicates (n = 6). Statistical analysis was performed by 1-way ANOVA with Tukey’s post hoc test. The different letters indicate significant differences with P < 0.05. 0.5×MS-Suc, Murashige and Skoog (0.5×MS) medium (without sucrose; -Suc); DMSO, dimethyl sulfoxide. Bars = 15 µm.
Figure 7.
Figure 7.
ATG8b and LDs co-localize in cotyledon cells. A) Representative CLSM images of the cotyledon cells of ATG8b-EYFP transgenic line (green) stained with BODIPY 505/515 (magenta) and analyzed after 24 h (a to h) and 48 h (i to p) of seed germination under long day conditions as well as after 48 h (q to t) under continuous dark conditions. The white arrows indicate ATG8b-EYFP, the arrowheads indicate LDs, and the yellow arrows indicate co-localization of both. The asterisk (m to o) indicates autophagosome labeled with ATG8b-EYFP. Bars = 10 µm. B) Immunoblot analysis of ATG8 and ATG8–PE abundance during seed in vitro germination under long day (LD) and continuous dark conditions; α-tubulin was used as a loading control. C) Densitometric data corresponding to ATG8 and ATG8–PE bands from B). Each data point represents the average of 3 independent experiments. Values represent the means ± Sd (n = 3). EYFP, enhanced yellow fluorescent protein; MS, mature seed; 24, 48, 72 and 96 h—time of seed germination.
Figure 8.
Figure 8.
Caleosins interact with ATG8 proteins. A) Yeast mating–based split-ubiquitin assay for interaction of the Cub fusions of CLO1, CLO2, CLO3, or OLE1 (bait) with the NubG fusion of ATG8b (prey). Diploid yeasts carrying the given bait and prey constructs were spotted on the SC medium without Leu, Trp, Ura, Met, His, and Ade (SC-LTUMHA). Serial dilutions of yeast culture are as indicated. B) X-Gal overlay assay for detection of β-galactosidase activity for the same bait and prey combinations as in A). Diploid yeasts were spotted on the SC medium without Leu, Trp, Ura, and Met (SC-LTUM). For A) and B), NubG and NubI (NubWT) served as a negative and a positive control, respectively. As an additional positive control, interaction between OLE1 and ATG8 proteins was used. C) Quantitative β-galactosidase activity assay for the Cub fusions of CLO1, CLO2, CLO3, or OLE1 (bait) with the NubG fusions of ATG8b or ATG8h (prey). NubG was used as a negative control. Data are means ± Sd from 4 independent yeast transformants. The β-galactosidase activity was normalized relative to the activity measured for the interaction between OLE1 and ATG8b. Statistical analysis was performed by 1-way ANOVA with Tukey’s post hoc test and an unpaired 2-tailed Student’s t-test. The different letters indicate significant (Tukey’s test, P < 0.01) differences between baits’ interactions with ATG8b (uppercase) or ATG8h (lowercase). An asterisk denotes significant differences (unpaired 2-tailed Student’s t-test, P < 0.01) between interaction with ATG8b and interaction with ATG8h for the same bait. SC, synthetic complete medium.
Figure 9.
Figure 9.
Deletion of AIM1 leads to disruption of the interaction between CLO1 and ATG8. A) Schematic diagram of tested CLO1 variants, lacking AIM1 (112 to 117 aa; CLO1-AIM1), AIM2 (196 to 202 aa; CLO1-AIM2), both AIM1 and AIM2 (CLO1-AIM1/AIM2) and N-terminus (1 to 97 aa, including EF-domain). The EF-hand domain, the central helix, and the proline knot are denoted as EF, H, and P, respectively. B) Quantitative β-galactosidase activity assay Cub fusions of CLO1 variants shown in A) (bait) with the NubG fusion of ATG8b (prey). NubG was used as a negative control. Data are means ± Sd from 6 to 8 independent yeast transformants. The β-galactosidase activity was normalized relative to the activity measured for the interaction between CLO1 and ATG8b. Statistical analysis was performed by 1-way ANOVA with Tukey’s post hoc test. The different letters indicate significant (P < 0.01) differences between β-galactosidase activity for the tested variants. C) Quantitative β-galactosidase activity assay for the Cub fusions of CLO1 variants shown in A) with NubWT (positive control). Data are means ± Sd from 8 (CLO1) or 4 (CLO1 variants) independent yeast transformants. The β-galactosidase activity was normalized relative to the activity measured for the interaction between CLO1 and ATG8b (blue bar).
Figure 10.
Figure 10.
Model of CLO1-mediated microlipophagy in Arabidopsis seeds. Interaction of ATG8 with CLO1 triggers the fusion of LDs with the tonoplast via 2 possible scenarios: A) the complex of CLO1 and ATG8 directly mediates the fusion of the LD membrane with the tonoplast, and B) following its binding to CLO1, ATG8 promotes the degradation of CLO1, resulting in direct interaction and fusion between LDs and the vacuole membranes. Once transported to the vacuole, LDs undergo a gradual degradation during seed germination. The proposed pathways may coexist with other LD degradation mechanisms such as dislocation and degradation of oleosins mediated by PUX10 and CDC48A. In addition, OLE1 can interact with ATG8, but the nature of this interaction and its role in LD degradation have not yet been elucidated. ATG8, AUTOPHAGY-RELATED PROTEIN 8; CDC48A, CELL DIVISION CYCLE 48A; CLO1, CALEOSIN 1; OLE1, OLEOSIN 1; LD, lipid droplet; PUX10, PLANT UBX-DOMAIN CONTAINING 10; STR, STEROLEOSIN.

Similar articles

Cited by

References

    1. Akita K, Takagi T, Kobayashi K, Kuchitsu K, Kuroiwa T, Nagata N. Ultrastructural characterization of microlipophagy induced by the interaction of vacuoles and lipid bodies around generative and sperm cells in Arabidopsis pollen. Protoplasma. 2021:258(1):129–138. 10.1007/s00709-020-01557-2 - DOI - PMC - PubMed
    1. Allen EA, Baehrecke EH. Autophagy in animal development. Cell Death Differ. 2020:27(3):903–918. 10.1038/s41418-020-0497-0 - DOI - PMC - PubMed
    1. Avin-Wittenberg T, Bajdzienko K, Wittenberg G, Alseekh S, Tohge T, Bock R, Giavalisco P, Fernie AR. Global analysis of the role of autophagy in cellular metabolism and energy homeostasis in Arabidopsis seedlings under carbon starvation. Plant Cell. 2015:27(2):306–322. 10.1105/tpc.114.134205 - DOI - PMC - PubMed
    1. Barros JAS, Siqueira JAB, Cavalcanti JHF, Araújo WL, Avin-Wittenberg T. Multifaceted roles of plant autophagy in lipid and energy metabolism. Trends Plant Sci. 2020:25(11):1141–1153. 10.1016/j.tplants.2020.05.004 - DOI - PubMed
    1. Blée E, Boachon B, Burcklen M, Le Guédard M, Hanano A, Heintz D, Ehlting J, Herrfurth C, Feussner I, Bessoule JJ. The reductase activity of the Arabidopsis caleosin RESPONSIVE TO DESSICATION20 mediates gibberellin-dependent flowering time, abscisic acid sensitivity, and tolerance to oxidative stress. Plant Physiol. 2014:166(1):109–124. 10.1104/pp.114.245316 - DOI - PMC - PubMed