. 2023 Sep 27;43(39):6653-6666.
doi: 10.1523/JNEUROSCI.0241-23.2023. Epub 2023 Aug 24.

Impedance Rhythms in Human Limbic System

Affiliations

Impedance Rhythms in Human Limbic System

Filip Mivalt et al. J Neurosci. .

Abstract

The impedance is a fundamental electrical property of brain tissue, playing a crucial role in shaping the characteristics of local field potentials, the extent of ephaptic coupling, and the volume of tissue activated by externally applied electrical brain stimulation. We tracked brain impedance, sleep-wake behavioral state, and epileptiform activity in five people with epilepsy living in their natural environment using an investigational device. The study identified impedance oscillations that span hours to weeks in the amygdala, hippocampus, and anterior nucleus thalamus. The impedance in these limbic brain regions exhibit multiscale cycles with ultradian (∼1.5-1.7 h), circadian (∼21.6-26.4 h), and infradian (∼20-33 d) periods. The ultradian and circadian period cycles are driven by sleep-wake state transitions between wakefulness, nonrapid eye movement (NREM) sleep, and rapid eye movement (REM) sleep. Limbic brain tissue impedance reaches a minimum value in NREM sleep, intermediate values in REM sleep, and rises through the day during wakefulness, reaching a maximum in the early evening before sleep onset. Infradian (∼20-33 d) impedance cycles were not associated with a distinct behavioral correlate. Brain tissue impedance is known to strongly depend on the extracellular space (ECS) volume, and the findings reported here are consistent with sleep-wake-dependent ECS volume changes recently observed in the rodent cortex related to the brain glymphatic system. We hypothesize that human limbic brain ECS changes during sleep-wake state transitions underlie the observed multiscale impedance cycles. Impedance is a simple electrophysiological biomarker that could prove useful for tracking ECS dynamics in human health, disease, and therapy.SIGNIFICANCE STATEMENT The electrical impedance in limbic brain structures (amygdala, hippocampus, anterior nucleus thalamus) is shown to exhibit oscillations over multiple timescales. We observe that impedance oscillations with ultradian and circadian periodicities are associated with transitions between wakefulness, NREM, and REM sleep states. There are also impedance oscillations spanning multiple weeks that do not have a clear behavioral correlate and whose origin remains unclear. These multiscale impedance oscillations will have an impact on extracellular ionic currents that give rise to local field potentials, ephaptic coupling, and the tissue activated by electrical brain stimulation. The approach for measuring tissue impedance using perturbational electrical currents is an established engineering technique that may be useful for tracking ECS volume.

Keywords: brain impedance; circadian rhythm; extracellular space; implantable neural stimulators; long-term data; sleep.


Conflict of interest statement

Unrelated to this research, G.A.W., B.H.B., J.V.G., and B.N.L are named inventors for intellectual property developed at Mayo Clinic and licensed to Cadence Neuroscience. G.A.W. has licensed intellectual property developed at Mayo Clinic to NeuroOne. B.N.L., G.A.W., and N.M.G. are investigators for the Medtronic Deep Brain Stimulation Therapy for the Epilepsy Post-Approval Study. V.K. consults for Certicon. I.B. has received compensation from an internship with Cadence Neuroscience for work unrelated to the current work. Mayo Clinic has received research support and consulting fees on behalf of G.A.W., B.N.L., and B.H.B. from Cadence Neuroscience, UNEEG Medical, NeuroOne, Epiminder, Medtronic, and Philips Neuro. P.C. has received research grant support from Neuronetics, NeoSync, and Pfizer; grant in kind (equipment support) from Assurex, MagVenture, and Neuronetics; and served as a consultant for Engrail Therapeutics, Myriad Neuroscience, Procter & Gamble, and Sunovion. T.D. is a consultant for Synchron, is on the advisory board of Cortec Neuro, is a shareholder collaborator of Bioinduction, and a shareholder director of Amber Therapeutics. T.D. has patents in the field of impedance measurement instrumentation and its application for epilepsy seizure prediction. All the other authors declare no competing financial interests.

Figures
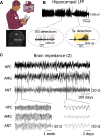
Figure 1.
Figure 1.
Monitoring human brain electrophysiology and behavior. Continuous wireless streaming of LFPs and brain impedance (Z) was used to investigate and track human brain electrophysiology in five ambulatory subjects with mesial temporal lobe epilepsy living in their natural home environment. A, The EPA system enables synchronized bidirectional communications between patient, implantable neural sensing, and stimulation devices (investigational Medtronic RC+S Summit), and local (tablet and smartphone) and distributed cloud computing infrastructure. The system consists of (1) RC+S implanted in a surgically created subclavicular pocket and connected to four electrode leads implanted in bilateral ANT and AMG-HPC. Bottom, Lateral x ray of the bilateral ANT (3387-leads) and bilateral AMG-HPC (3391-lead) targets. The 3391-lead has four contacts (surface area, 11.97 mm2) spanning 24.5 mm. The contacts are 3.0 mm long and separated by 4.0 mm. The 3387-lead has four contacts (contact surface area, 5.985 mm2) spanning 10.5 mm. The individual contacts are 1.5 mm long and separated by 1.5 mm. (2) The EPA custom software application running on a tablet computer provides local computing and bidirectional connectivity between devices. (3) Cloud data and the analytics platform. B, Continuous streaming of brain LFP enables monitoring of epileptiform activity [IES and seizure (Sz)] and Z. Bottom Circles show automated IES and seizure detections. C, Representative raw impedance time series from HPC, AMG, and ANT recorded over multiple months from the subject living in natural home environment. Bottom, Expanded time scales of average Z (z score with 2 h median filter) showing 24 h cycles over multiple days and weeks.
Figure 2.
Figure 2.
Impedance measurements in saline/microbead composites. A, A benchtop phantom fixture was used for testing two- and four-point impedance measurements in saline/microbead composites. For two-point monopolar measurements, current is injected into the sample medium using the 3387-lead contacts as the cathode (E1), and the anode is a large surface area contact (E0) at the bottom of the cylindrical container. The two-point measurement uses the same electrode contacts (E2 and E3 or E0) for both electrical stimulation and voltage sensing. The four-point impedance measurement uses different electrodes for stimulation (E1 and E4) and sensing (E3 and E2). The four-point measurements eliminate the interface electrode–electrolyte polarization, related to electrical stimulation, from the voltage measurements and provides a measurement of the medium. B, Impedance measured using sinusoidal currents in saline and saline/microbead composites (1–4000 Hz). The two-point measurements are dominated at low frequency (<500 Hz) by the frequency-dependent capacitive double layer related to the electrolyte polarization at the electrode–electrolyte interface in both saline (red squares) and saline/microbead (blue squares). The four-point impedance measurement, using different electrodes for current injection and voltage response sensing, yields a purely resistive impedance with no frequency dependence (10–4000 Hz). The RC+S impedance measurement results are shown for comparison as a blue dashed line (saline/microbead) and red dashed line (saline). C, The RC+S calculates impedance using Ohm’s law, Z = V/I, where I is the injected current (0.4 mA, 80 µs pulse width) and V is the voltage response measured at 70 µs. The voltage recording using two-point measurement shows the voltage response to the impulse current (0.4 mA, 80 µs pulse width) with charging of the electrode–electrolyte double layer capacitor, which reaches an asymptotic voltage within ∼50 µs. The RC+S impedance measurement can be seen to correlate with ∼1000 Hz sinusoidal current input.
Figure 3.
Figure 3.
Human brain impedance. A, Circuit model for monopolar brain impedance measurements. The impedance contributions include the electrode–tissue interface, multiple brain compartments (ECS, vascular, cellular), body, and device-tissue impedance. B, Example impedance traces from electrodes targeting HPC, AMG, and ANT anatomic locations within the first 4 weeks (∼30 d) postimplant. Postimplant impedance shows an increasing trend that asymptotes to a stable mean value after ∼14 d. C, Normalized stable impedance for the anatomic locations. The stabilized Z values were estimated as the mean of the raw impedance between 15 and 21 d after implant and are scaled by multiplying by the electrode contact surface area. The normalized stable measures were aggregated across five subjects (M1–5) for each location. Error bar indicates ±1 SD. The asymptote values of AMG, ANT, and HPC impedance are similar when corrected for electrode surface area.
Figure 4.
Figure 4.
Temporal profiles of seizures and acute impedance changes. A, Circular histograms were used to illustrate the distribution of seizure onset times (red histograms) and sleep periods (gray filled) over a 24 h clock for each subject. The distribution of seizures as a function of time of day shows that seizures primarily occur during daytime and exhibit a bimodal distribution. A diurnal bimodal distribution of temporal lobe seizures was previously reported for temporal lobe epilepsy (Durrazo et al., 2008). B, Impedance measurements from AMG, ANT, and HPC during the ±12 h surrounding spontaneous seizures (blue line) were compared with days without seizures (green line). The data demonstrate an increase in average impedance on days with seizures. Raw impedance times series were segmented to ±12 h around the seizure onset times. The mean value of the impedance was subtracted from each segment to obtain the normalized impedance. The normalized impedance time series were aggregated and smoothed using a 2.4 h moving window. For each subject, the smoothed normalized impedances were aggregated, and the mean value per anatomic location (ANT, AMG, HPC) was calculated. The red vertical line indicates the onset time of seizures (for blue traces) or surrogate segments without seizures within 24 h (green traces). The surrogate segments without seizures were selected to match the time-of-day temporal distribution of actual seizure events. The blue curve represents the mean value of seizure-related normalized impedance, incorporating all seizures, whereas the green curve represents the mean value of normalized impedance from 24 h segments without any seizures. The distribution of time of day of impedance data segments without seizures (green) is matched to the distribution of time of day of actual seizure events to account for baseline circadian changes in impedance. The shaded areas around the means indicate ±1 SEM, representing the uncertainty across the subjects (n = 5).
Figure 5.
Figure 5.
Twenty-four-hour impedance cycles. Circular histograms of the impedance maximum (orange) and minimum (brown) are overlayed with average impedance (blue line) and sleep (shaded gray). A, Top left, Circular histogram of representative of 24 h impedance maximum values. Bottom left, Circular histogram of representative of 24 h impedance minimum values from same subject (M1). The maximum impedance values occur in late daytime hours during wakefulness. The minimum impedance values are in the early morning hours during sleep. Top right, The running average impedance using a 4 h window with 2 h overlaps show the diurnal pattern with impedance increased during daytime and decreased during nighttime. Bottom middle, The average period of sleep determined from the automated sleep–wake classifier (gray filled). Right, Composite polar plot containing (1) minimum/maximum (min/max) impedance histograms, (2) average impedance, (3) sleep period. B, The group-level composite polar plots from HPC, ANT, and AMG averaged across all subjects demonstrates that the min/max impedance values over 24 h periods of day/night are not uniformly distributed. C, Composite polar plots for individual subjects M1–5 over multiple months show the average impedance increases during wakefulness and decreases during sleep (blue curve). The HPC, AMG, and ANT histograms show the impedance reaches maximum values in the evening during wakefulness and minimum values during the night and early morning sleep before waking. Subject M2 displays less consistent 24 h cycles. The circular histogram distributions of the minimum (brown) and maximum (orange) values of the 24 h impedance cycle were tested using the circular Kuiper test and show strong phase preferences for night and day (*p < 0.05, **p < 0.01, ***p < 0.001). Subject M5 did not have a right AMG electrode because of a technical issue during surgery.
Figure 6.
Figure 6.
Multiscale rhythms of human brain impedance. The AMG, ANT, and HPC impedance time series exhibit multiscale cycles with ultradian, circadian, and infradian periods. A, Top to bottom, Displays for the HPC, AMG, and ANT impedance time series and analysis. Top, Raw impedance time series. Middle, CWT of impedance time series demonstrating multiscale oscillations. The circadian period (1 d) is most prominent with little variability over the multiple-month record. Right, Amplitude index (gray) shows the high-power, narrow circadian peak that can be compared with the broad more diffuse ultradian and infradian bands. Bottom, Significance test for ultradian (yellow dots), circadian (red dots), and infradian (blue dots) cycles identified using the F score test. B, Blowup of CWT over a shorter evaluation window of 3 d provides a clearer visualization of ultradian oscillations (∼1.25–3 h) that are not visually evident in the long-term amplitude index and CWT. Ca–c, Statistical testing with Thomson F test multitaper scheme (Thomson, 1982; Percival and Walden, 1993) was used to identify significant ultradian, circadian, and infradian impedance cycles. a, The presence of cycles with ultradian and circadian periods was investigated using a 5 d moving window (z score and downsampled to 48 samples/day and moving step of 5 d). A 100 d moving window (moving step of 5 d) was used to investigate cycles in infradian band. b, Thomson F test based on the multitaper scheme to test the periodicity at the FOIs. c, The F test was set at the level of the upper 99% (p = 0.01) where the red dash on the scale color bar (right) indicates the F statistic above the critical value. D, Box plots of percentage of significant impedance cycles in ANT, AMG, and HPC. We examined the percentage of significant ultradian (1.0–1.5, 1.5–1.7, 1.7–4.8, and 4.8–21.6 h/cycle), circadian (0.9–1.1 d/cycle), and infradian (1.1–2.5, 2.5–10, 10–20, and 20–33 d/cycle) cycles at each anatomic location under examination. We aggregated the values across subjects and present them as box plots at each location per period band. Note that the fundamental frequency of the sleep cycle (1.6 h/cycle or 5 cycles per 8 h) is centered at the ultradian band of 1.5–1.7 h/cycle. The shaded area highlights the period bands that have higher proportions of significant periodicity in addition to the circadian cycle.
Figure 7.
Figure 7.
Sleep–wake state dependence of human brain impedance. Limbic brain impedance depends on sleep–wake state. A, Impedance changes over a single night during a hospital stay with gold standard sleep–wake classifications from polysomnography, including wakefulness and four cycles of NREM and REM sleep from subject M5. The impedance decreases during the transition from wakefulness to NREM sleep and increases during transitions from NREM to REM. B, Group-level analysis (M1–5) shows that the average impedance in HPC, AMG, and ANT is lowest during NREM sleep, intermediate in REM sleep, and highest in wakefulness. C, Similarly, in subjects (M1–4) taking daytime naps including at least 30 min of NREM sleep, the HPC and AMG impedance is decreased in NREM sleep compared with wakefulness before the nap. These results during daytime naps further support that impedance cycles are related to dependence on the sleep–wake behavioral state. D, At the individual subject level, the ANT, AMG, and HPC impedance is greater during wakefulness compared with NREM sleep in all subjects, and it is greater than REM sleep for all subjects except M5. The impedance in the ANT is greater in REM sleep compared with NREM for all subjects but only reaches significance in the HPC and AMG for M4. The impedance difference between wakefulness and REM sleep is smaller compared with the difference observed between NREM and wakefulness or NREM and REM sleep (*p < 0.05, **p < 0.01, ***p < 0.001; Mann–Whitney test with Bonferroni correction for multiple observations). †AMG data were not available for M5.

References

    1. Anastassiou CA, Perin R, Markram H, Koch C (2011) Ephaptic coupling of cortical neurons. Nat Neurosci 14:217–223. 10.1038/nn.2727 - DOI - PubMed
    1. Bard AJ, Faulkner LR (2001) Electrochemical methods: fundamentals and applications. 2nd ed. New York: Wiley.
    1. Baud MO, Kleen JK, Mirro EA, Andrechak JC, King-Stephens D, Chang EF, Rao VR (2018) Multi-day rhythms modulate seizure risk in epilepsy. Nat Commun 9:88. 10.1038/s41467-017-02577-y - DOI - PMC - PubMed
    1. Baumann SB, Wozny DR, Kelly SK, Meno FM (1997) The electrical conductivity of human cerebrospinal fluid at body temperature. IEEE Trans Biomed Eng 44:220–223. 10.1109/10.554770 - DOI - PubMed
    1. Bazil CW (2017) Sleep and epilepsy. Semin Neurol 37:407–412. 10.1055/s-0037-1604352 - DOI - PubMed

Publication types

LinkOut - more resources