. 2023 Sep 27;43(39):6592-6608.
doi: 10.1523/JNEUROSCI.2206-21.2023. Epub 2023 Aug 24.

Cleavage of VAMP2/3 Affects Oligodendrocyte Lineage Development in the Developing Mouse Spinal Cord

Affiliations

Cleavage of VAMP2/3 Affects Oligodendrocyte Lineage Development in the Developing Mouse Spinal Cord

Christopher D Fekete et al. J Neurosci. .

Abstract

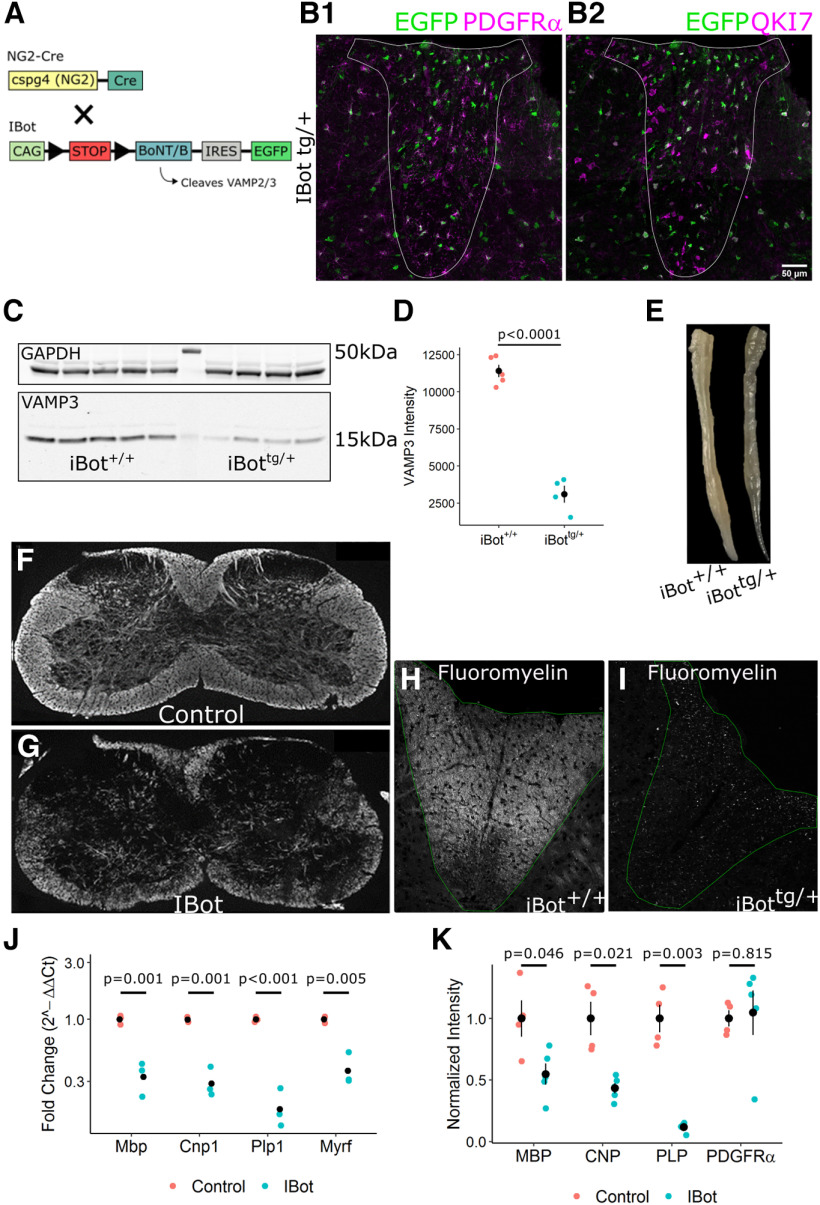
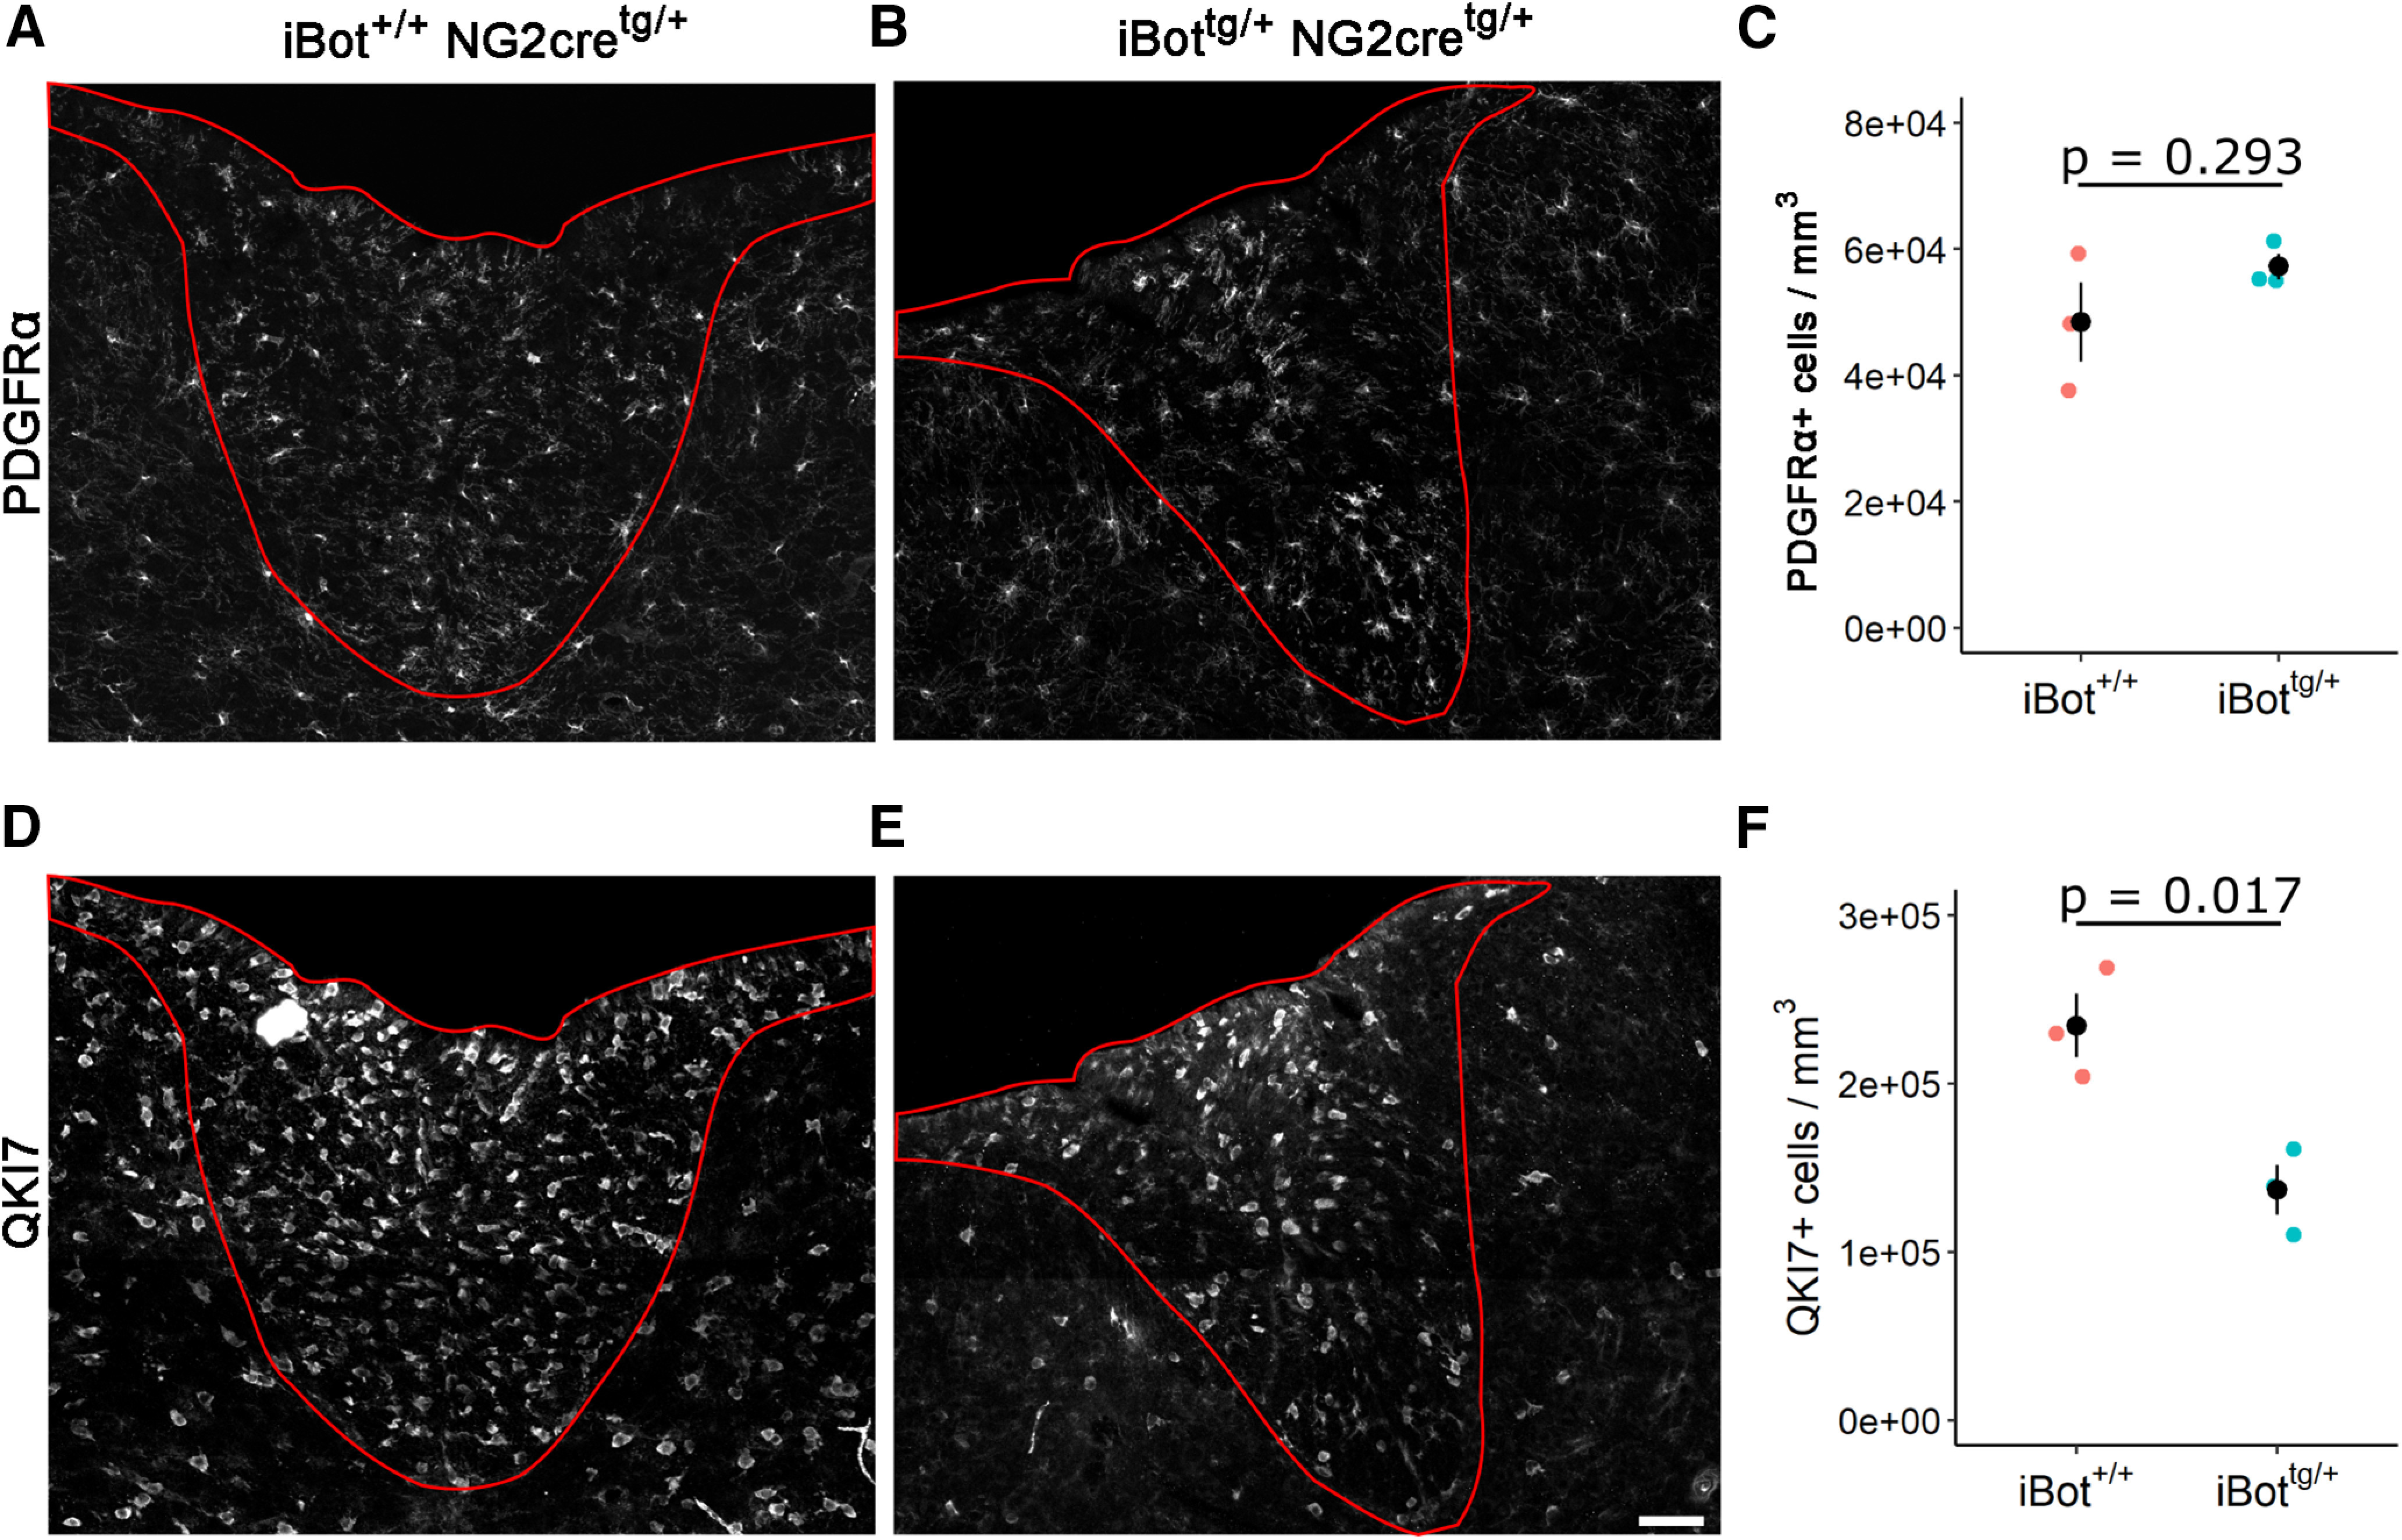
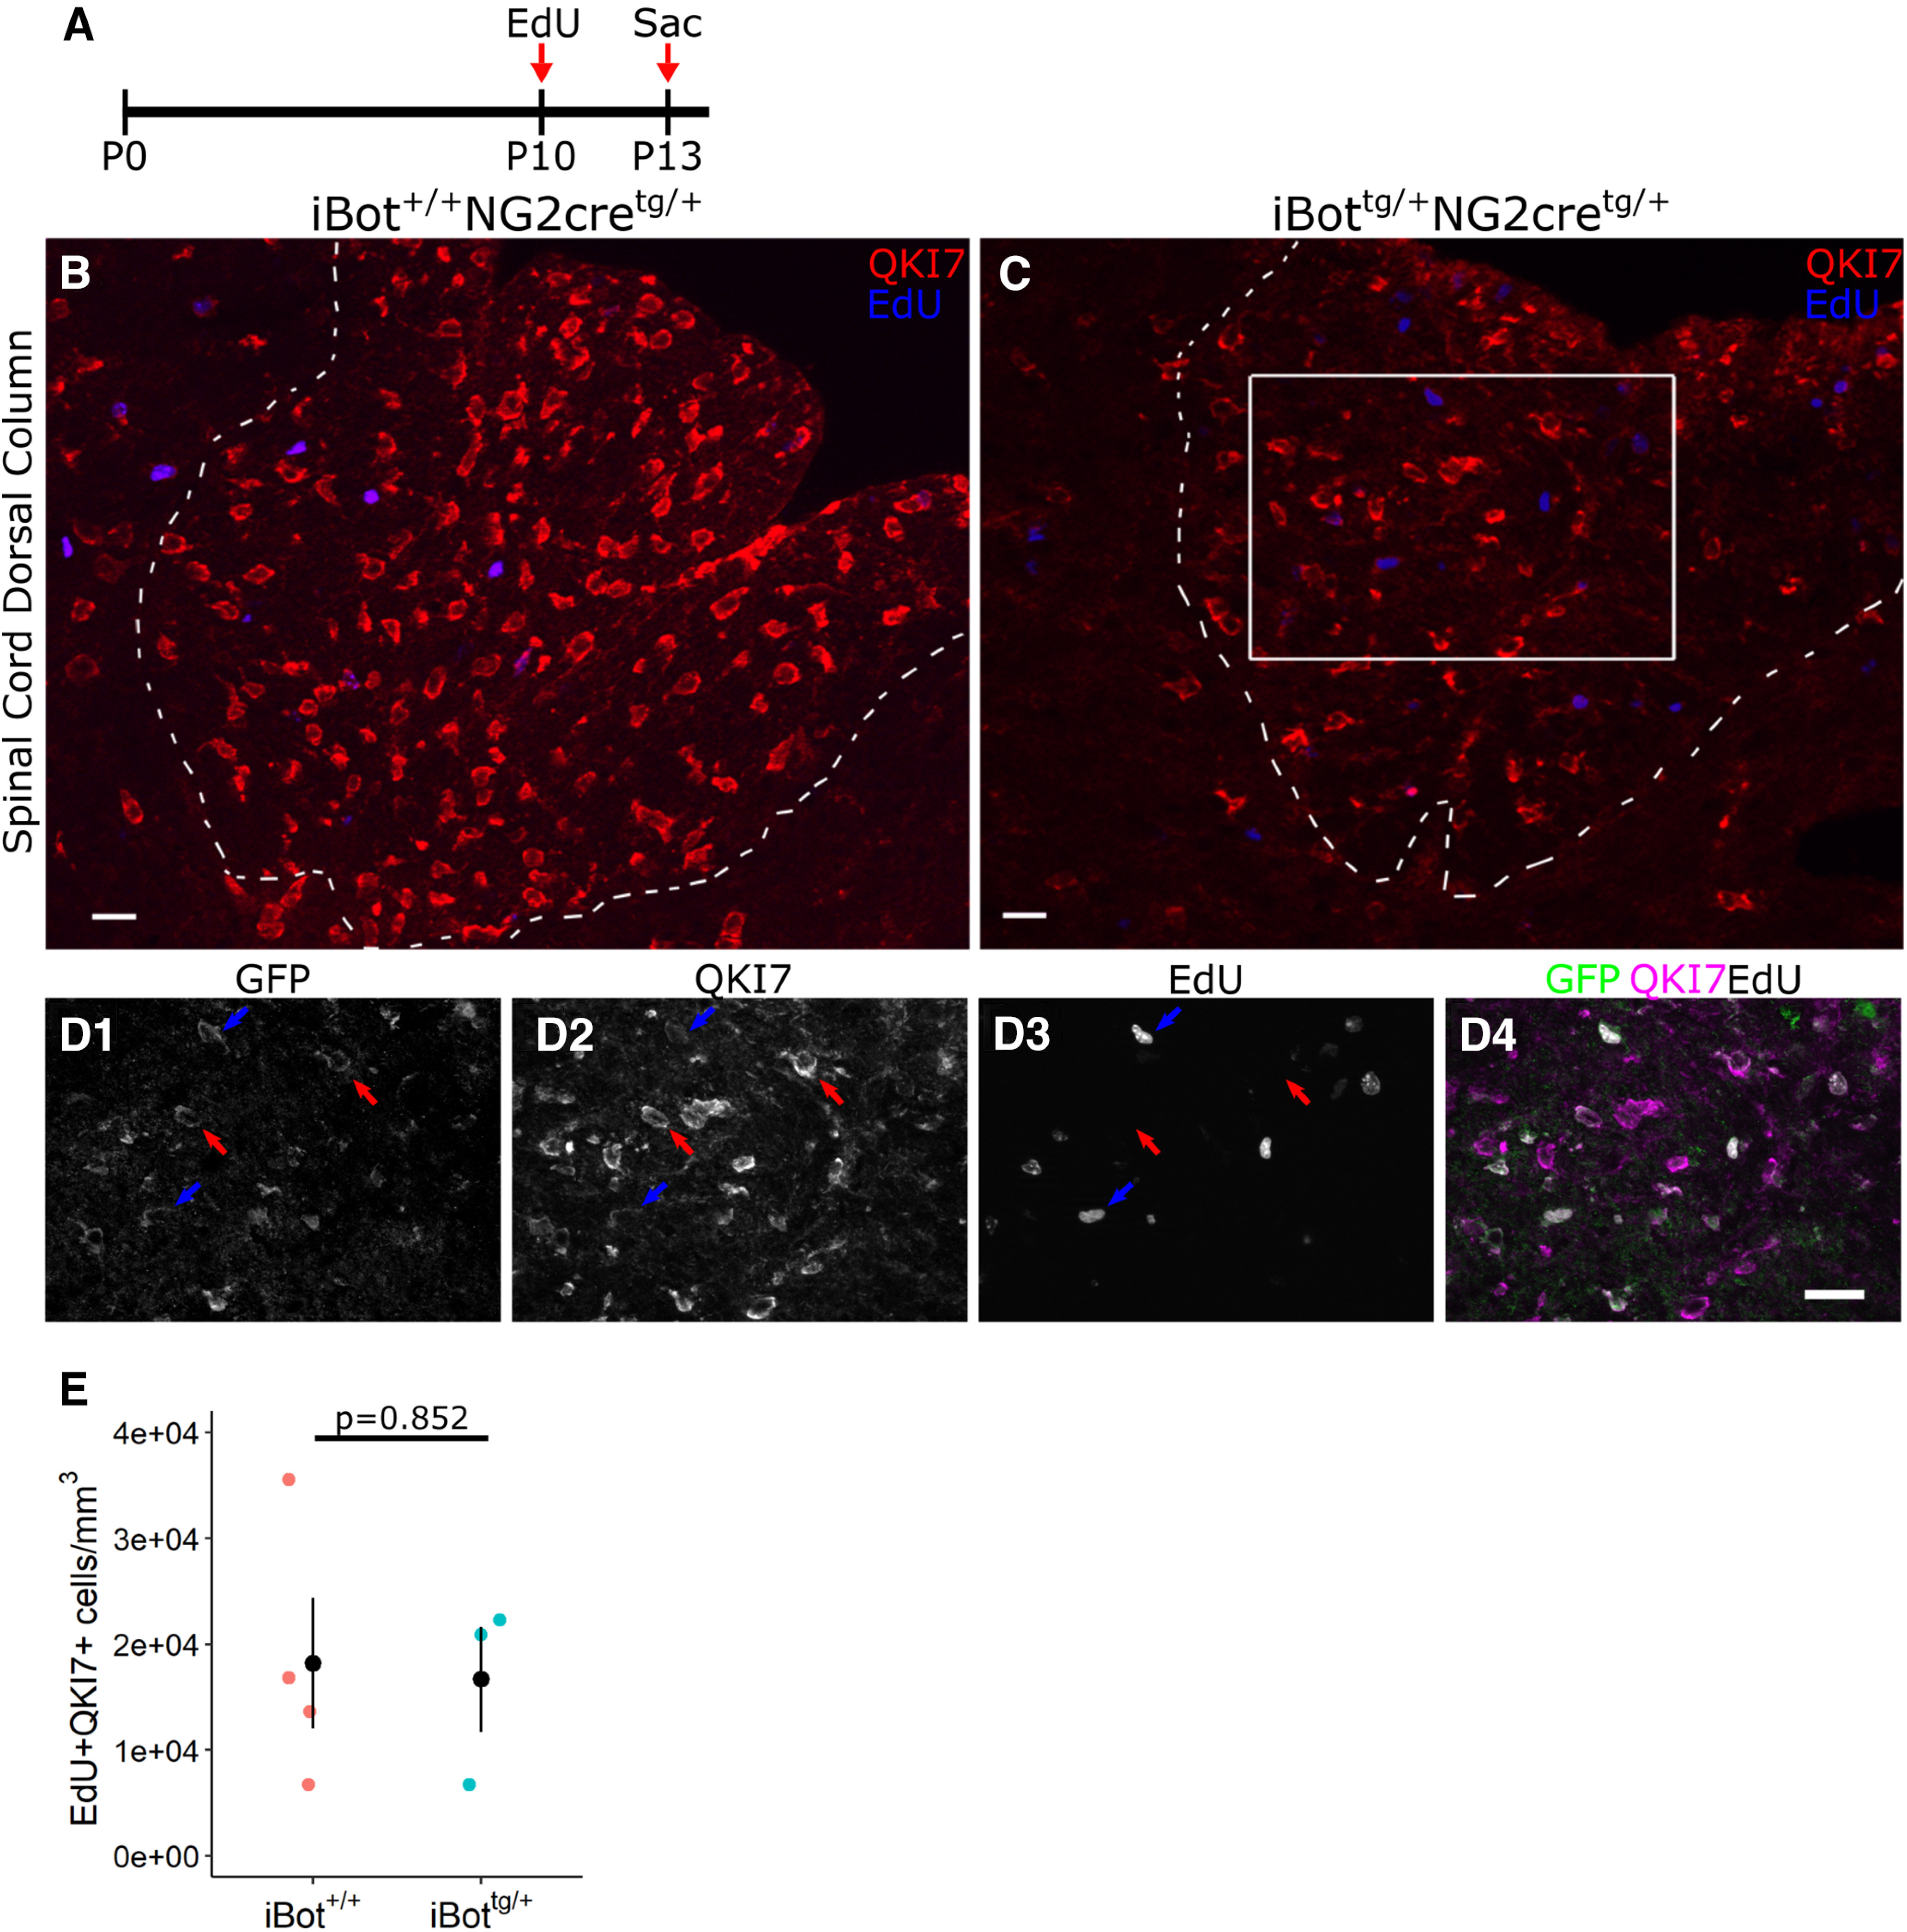
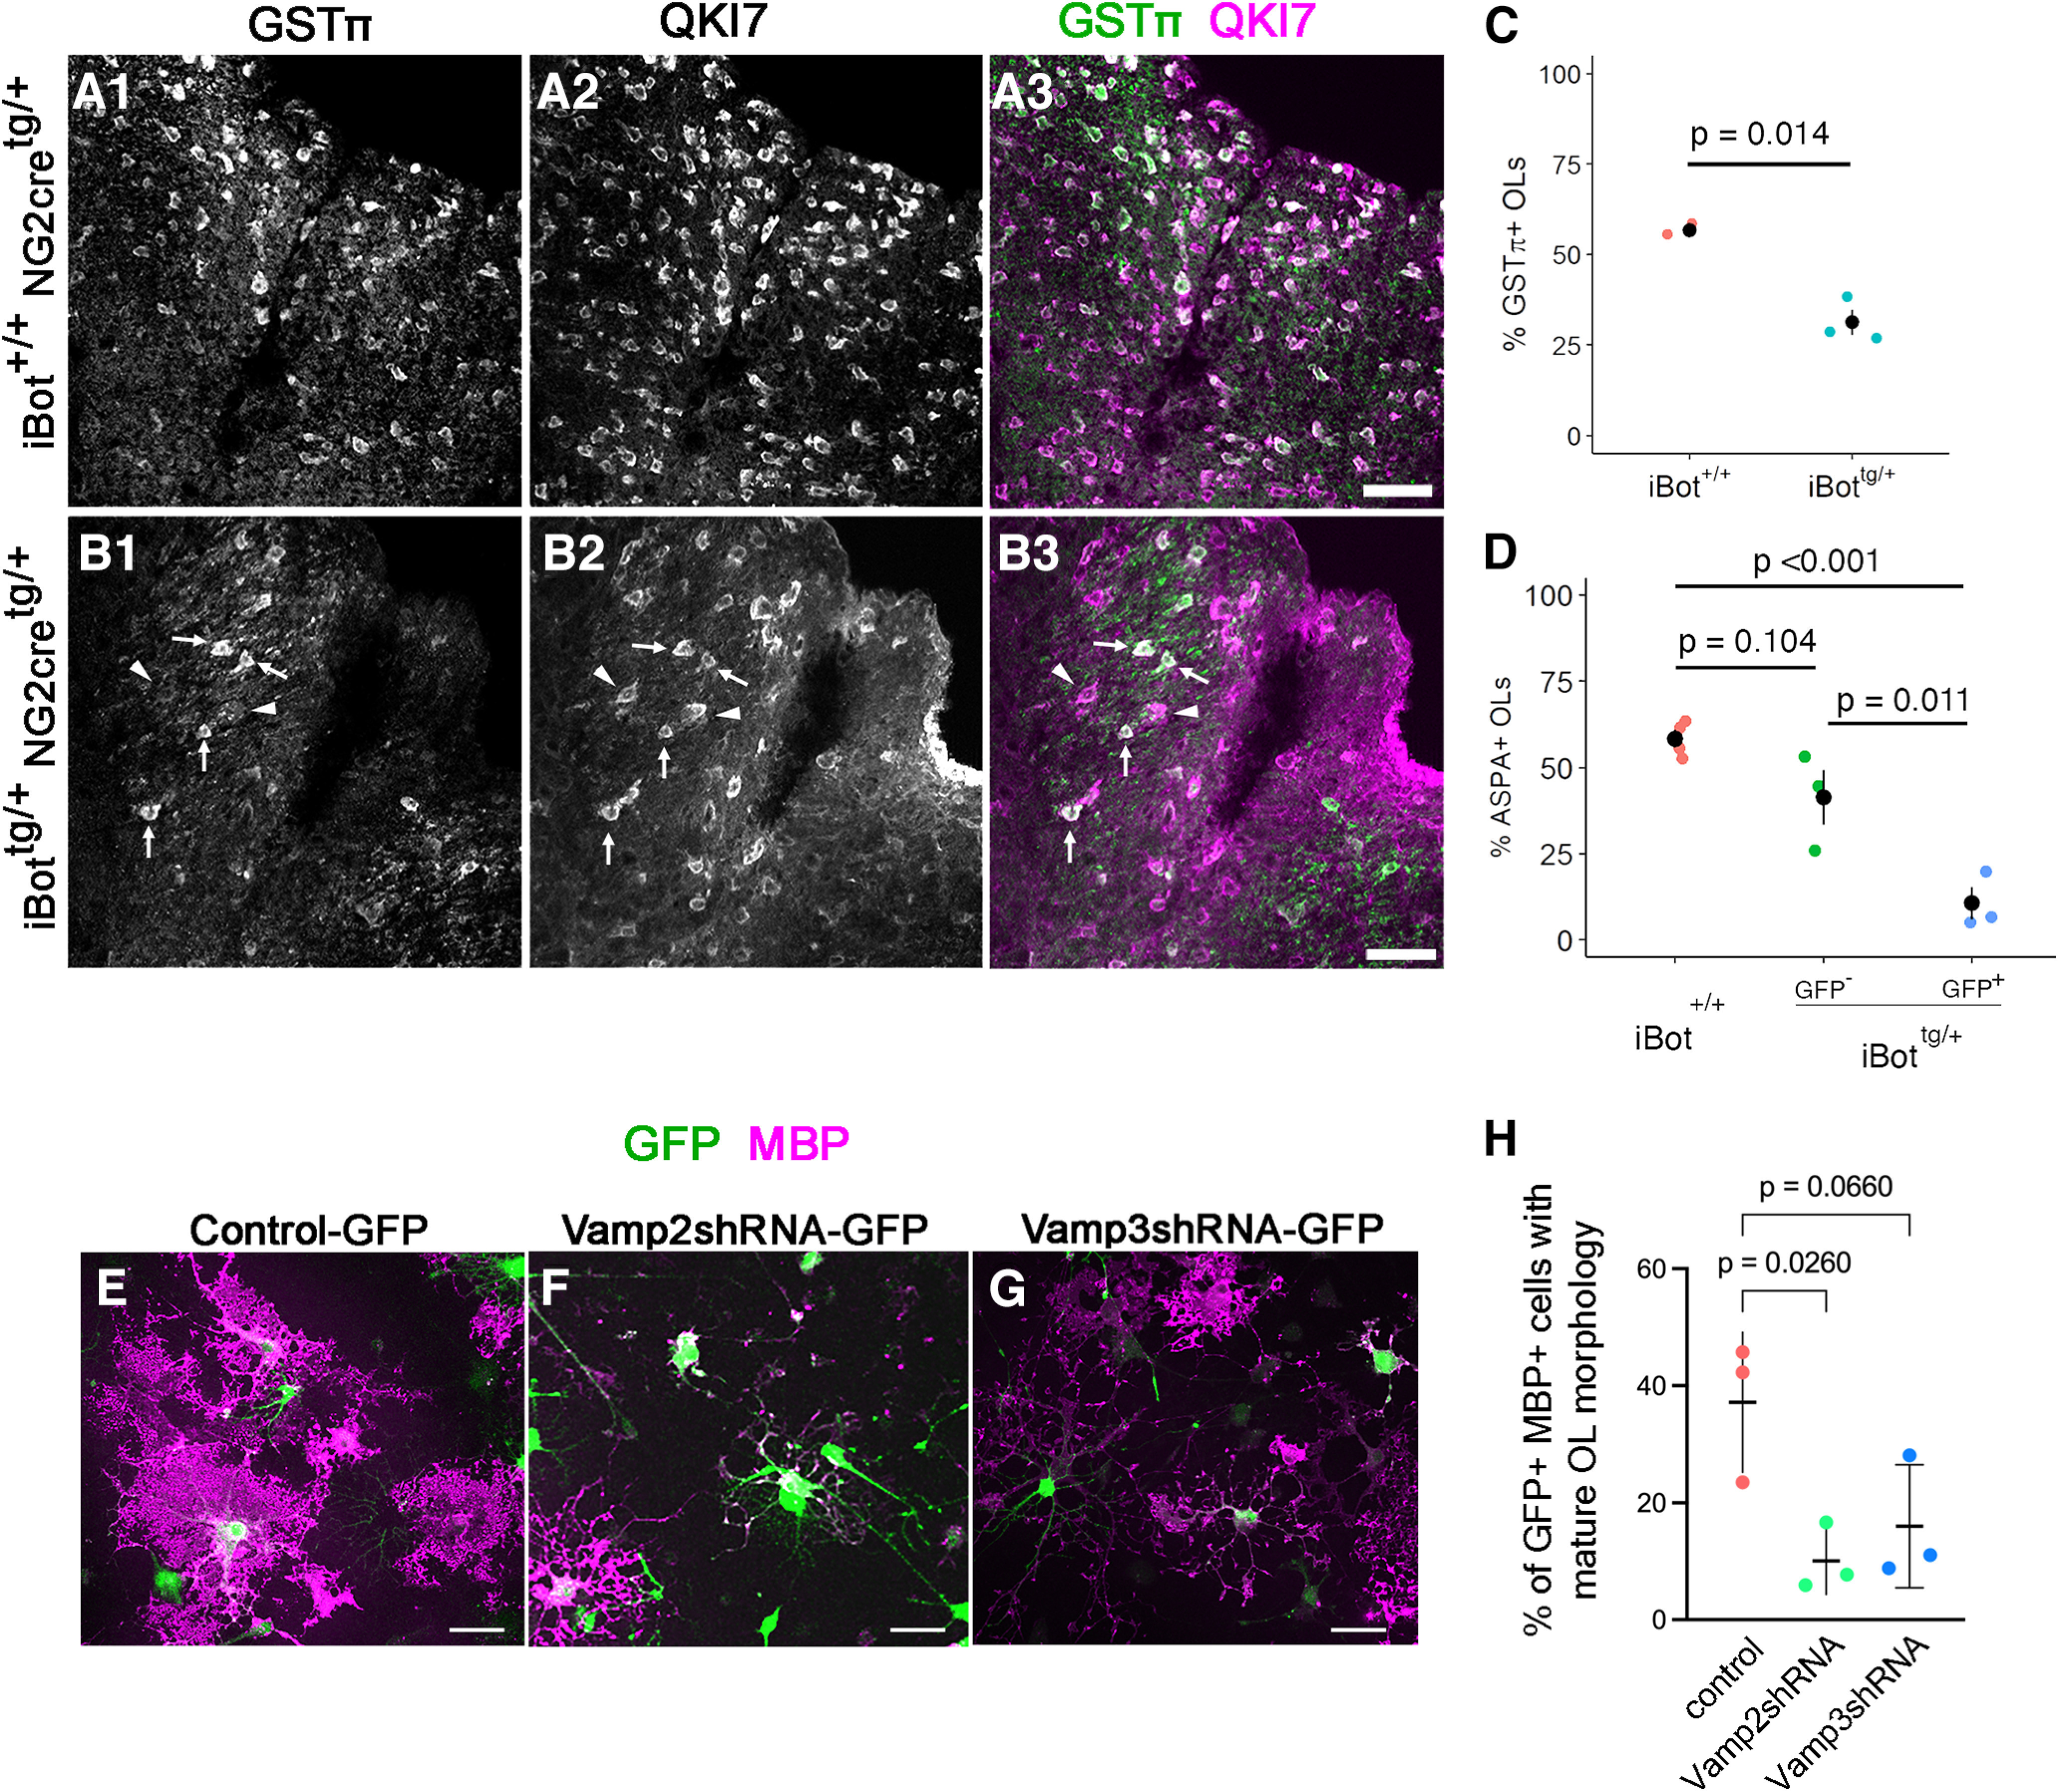
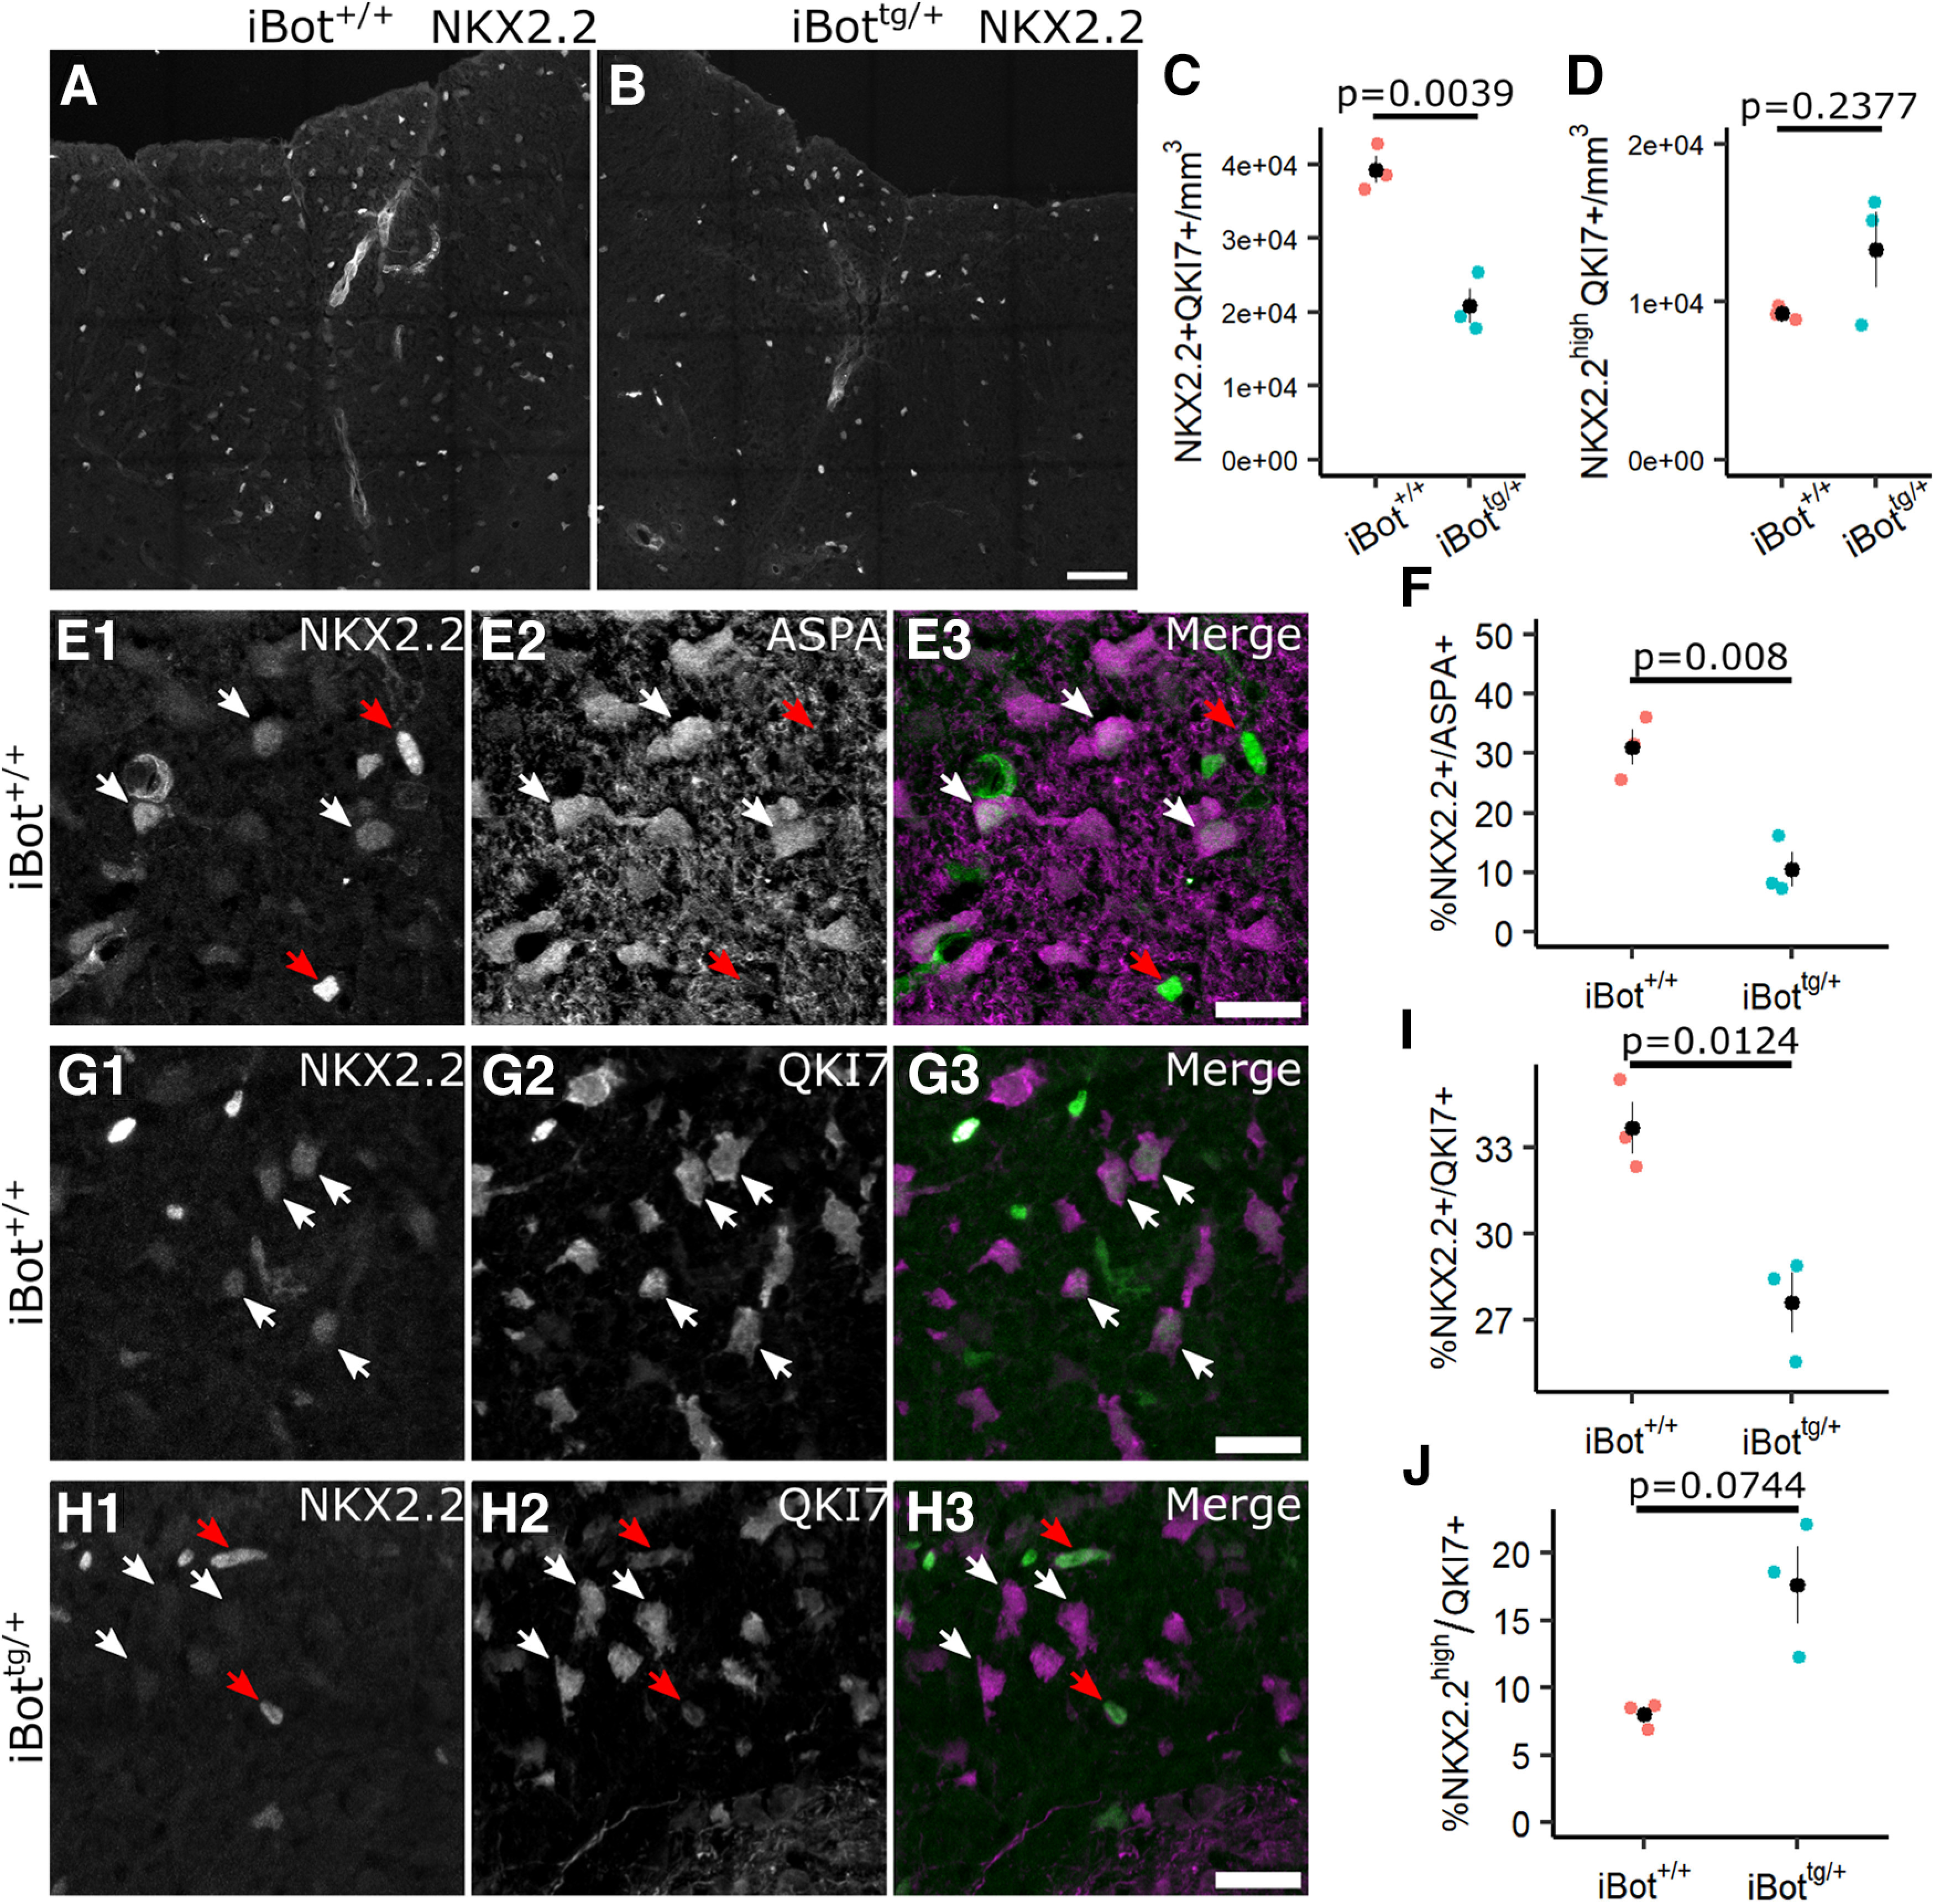
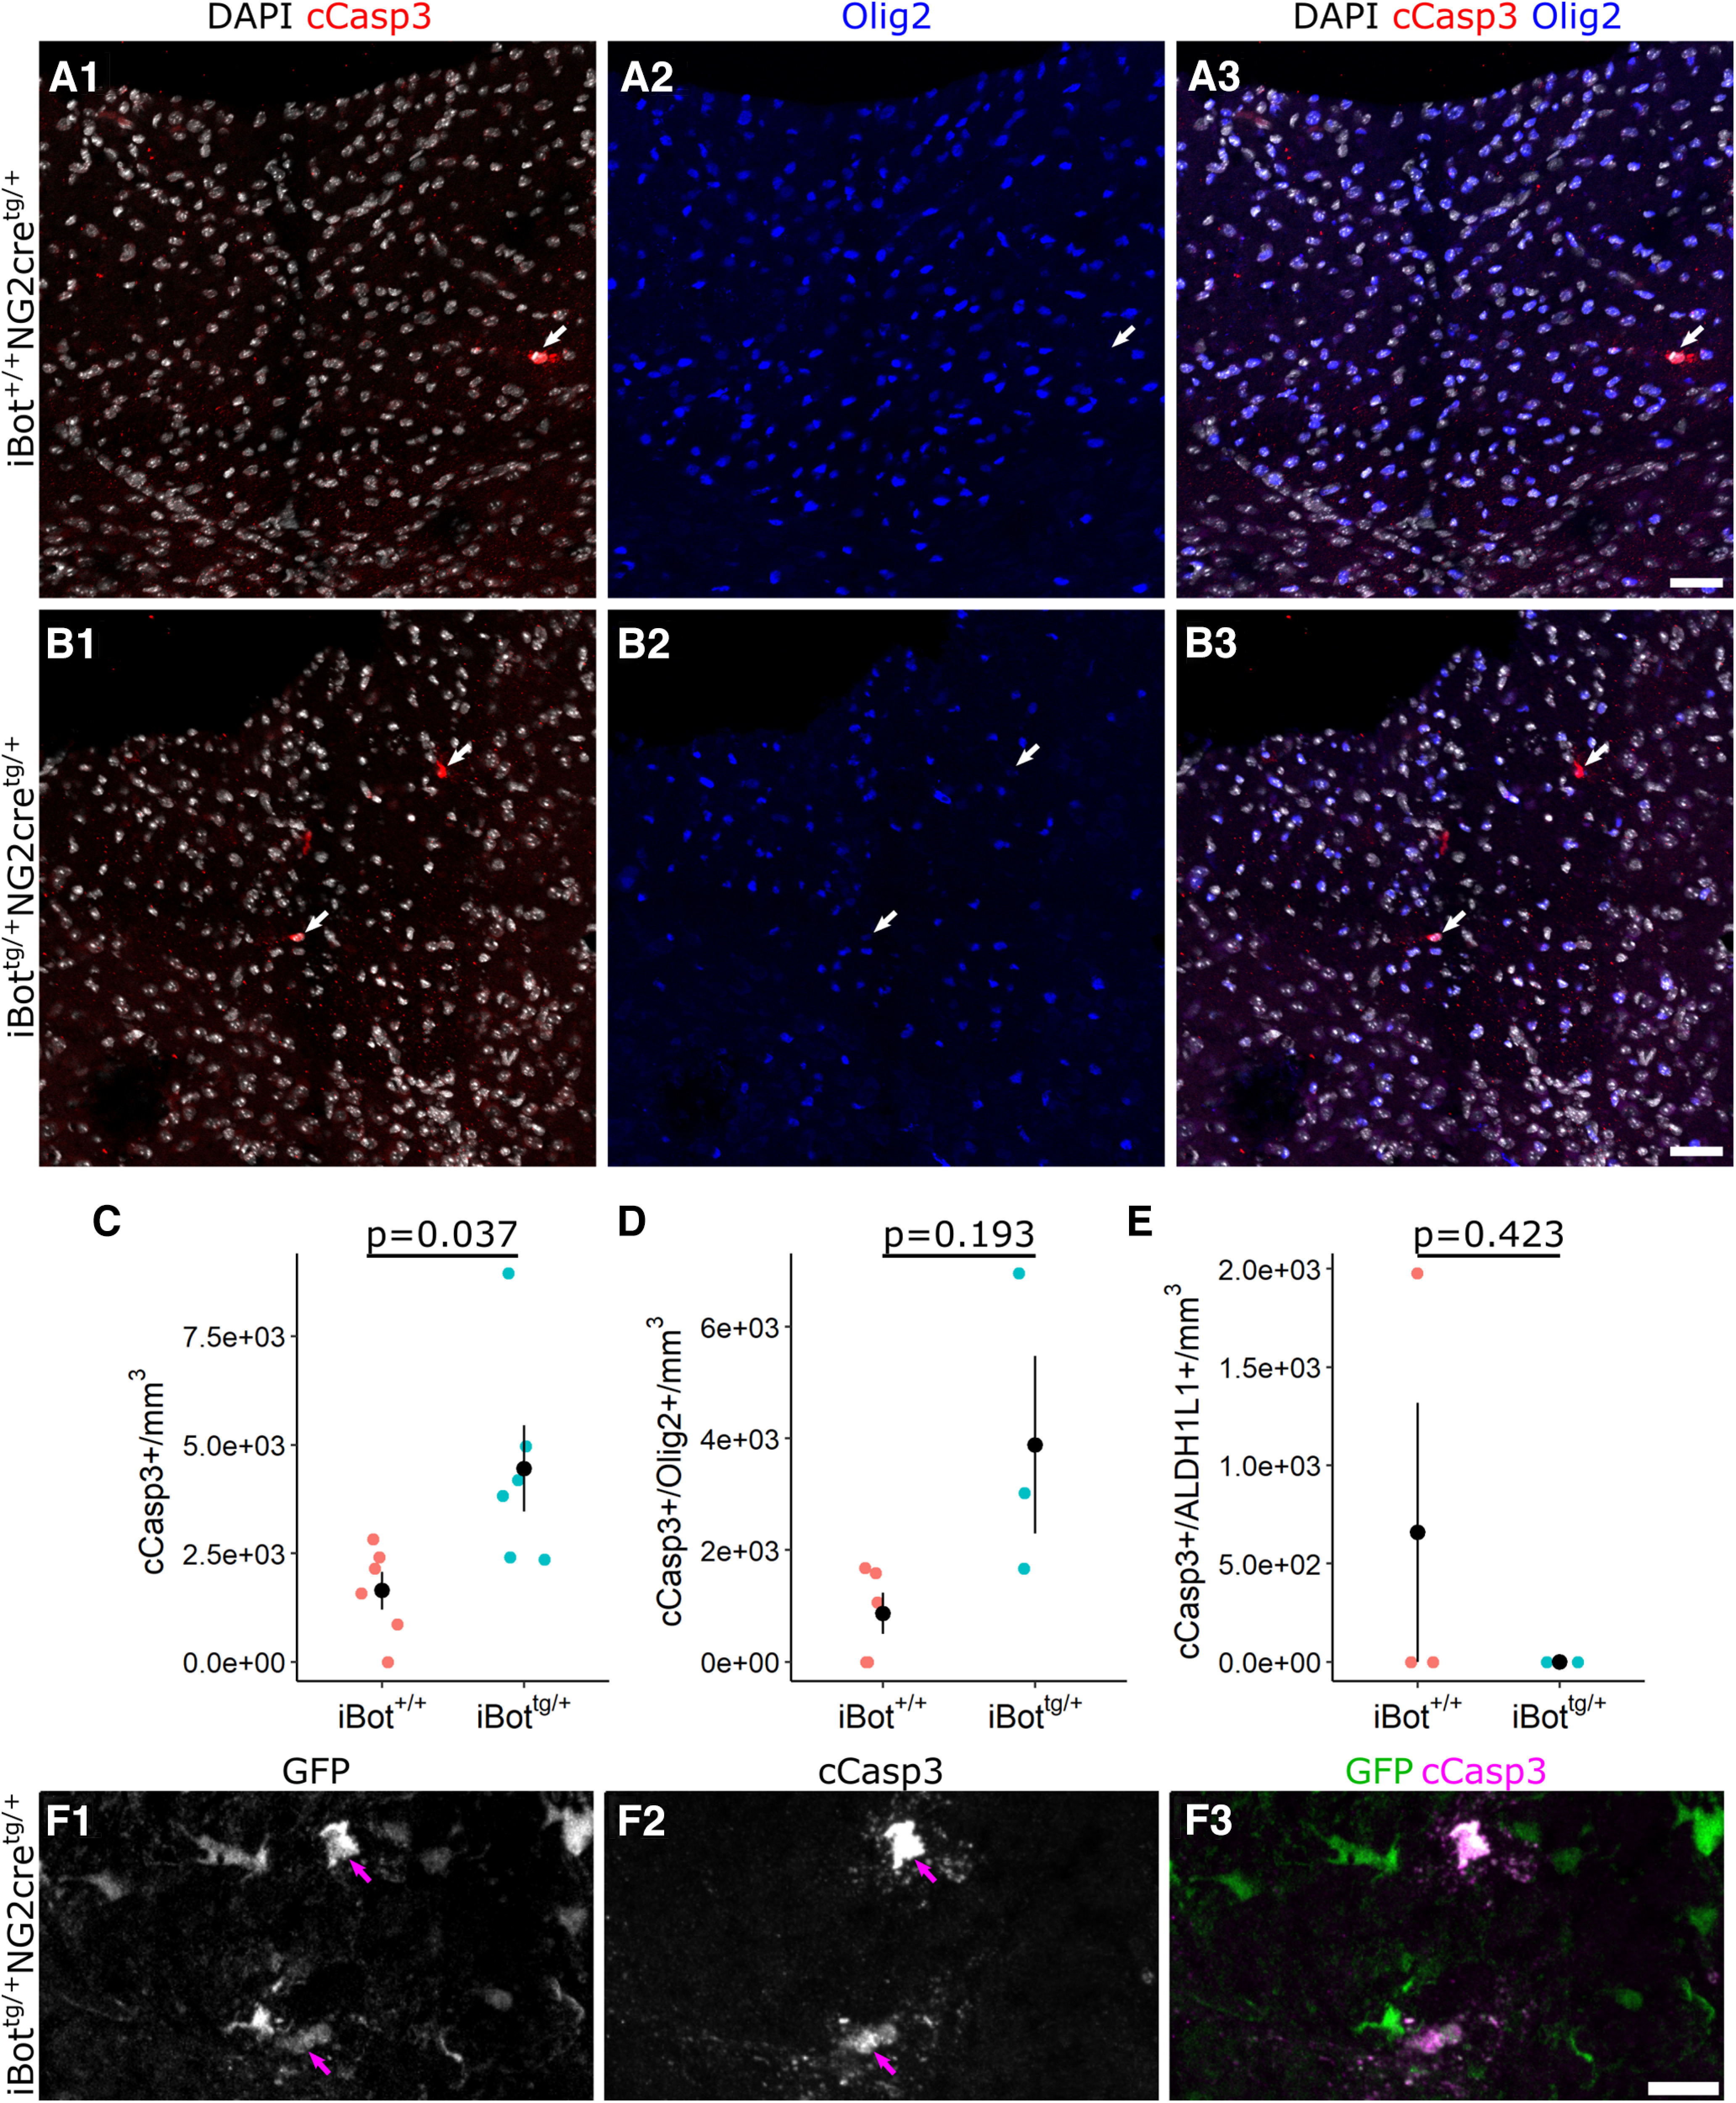
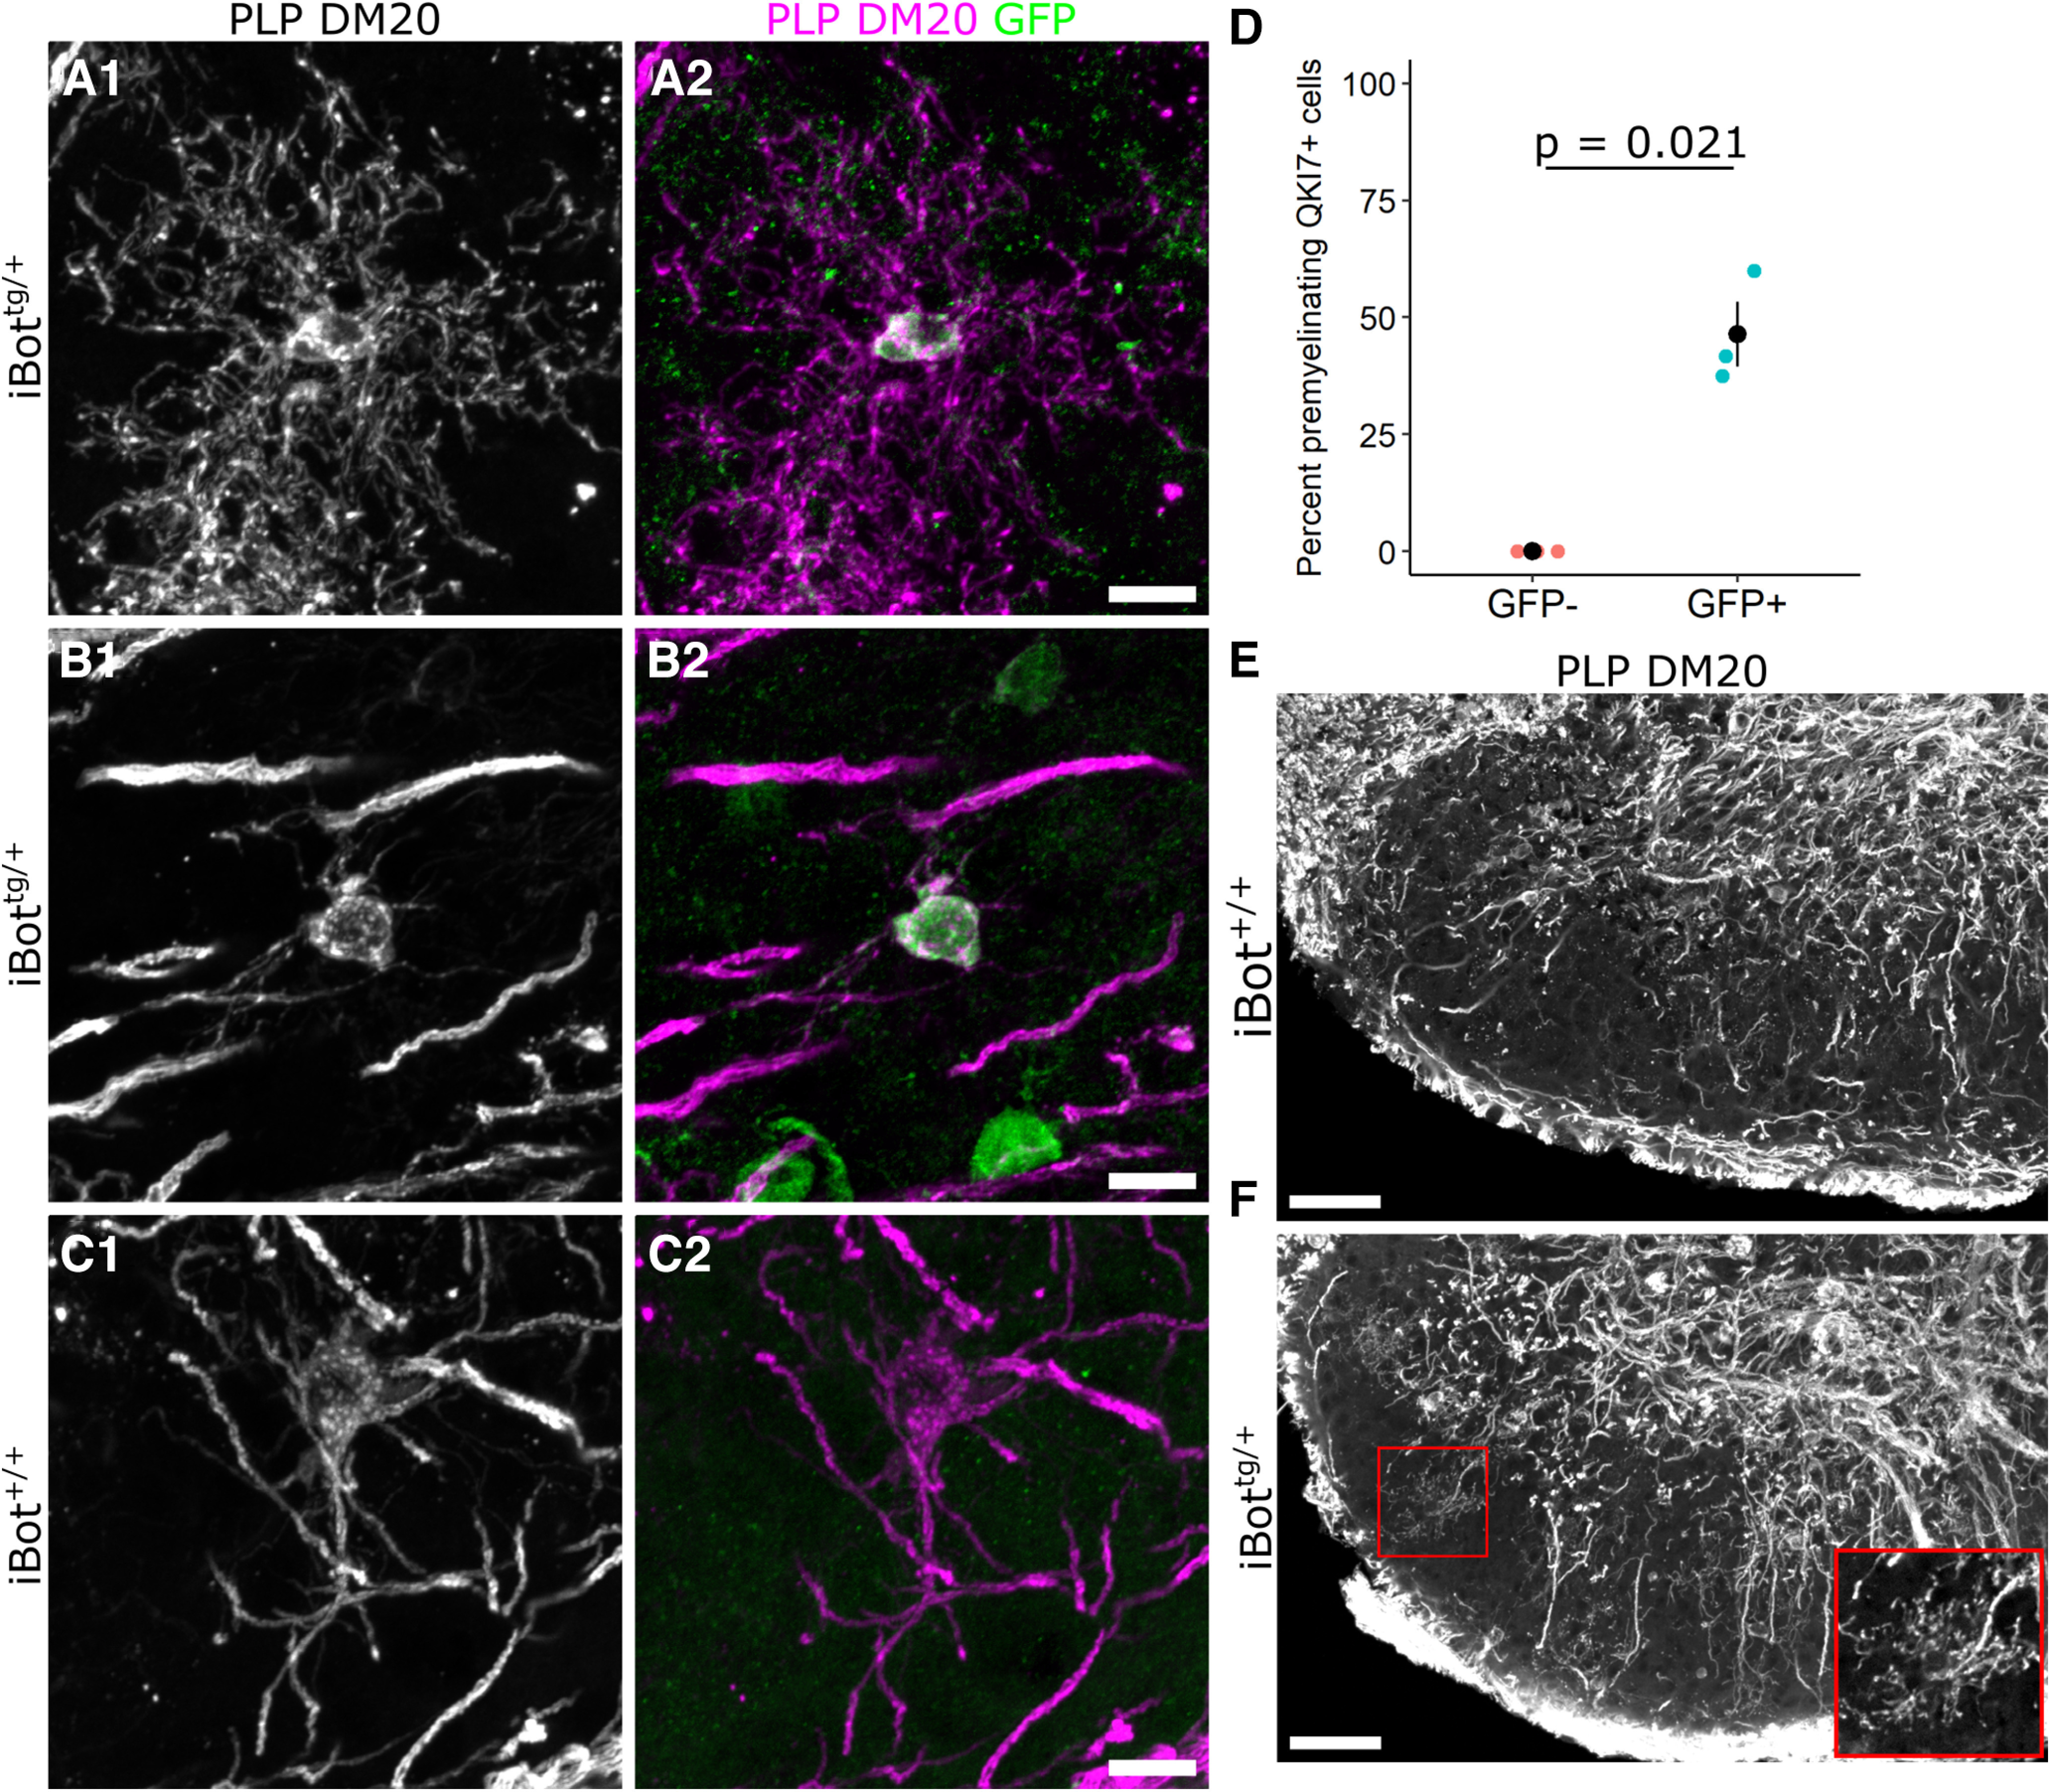
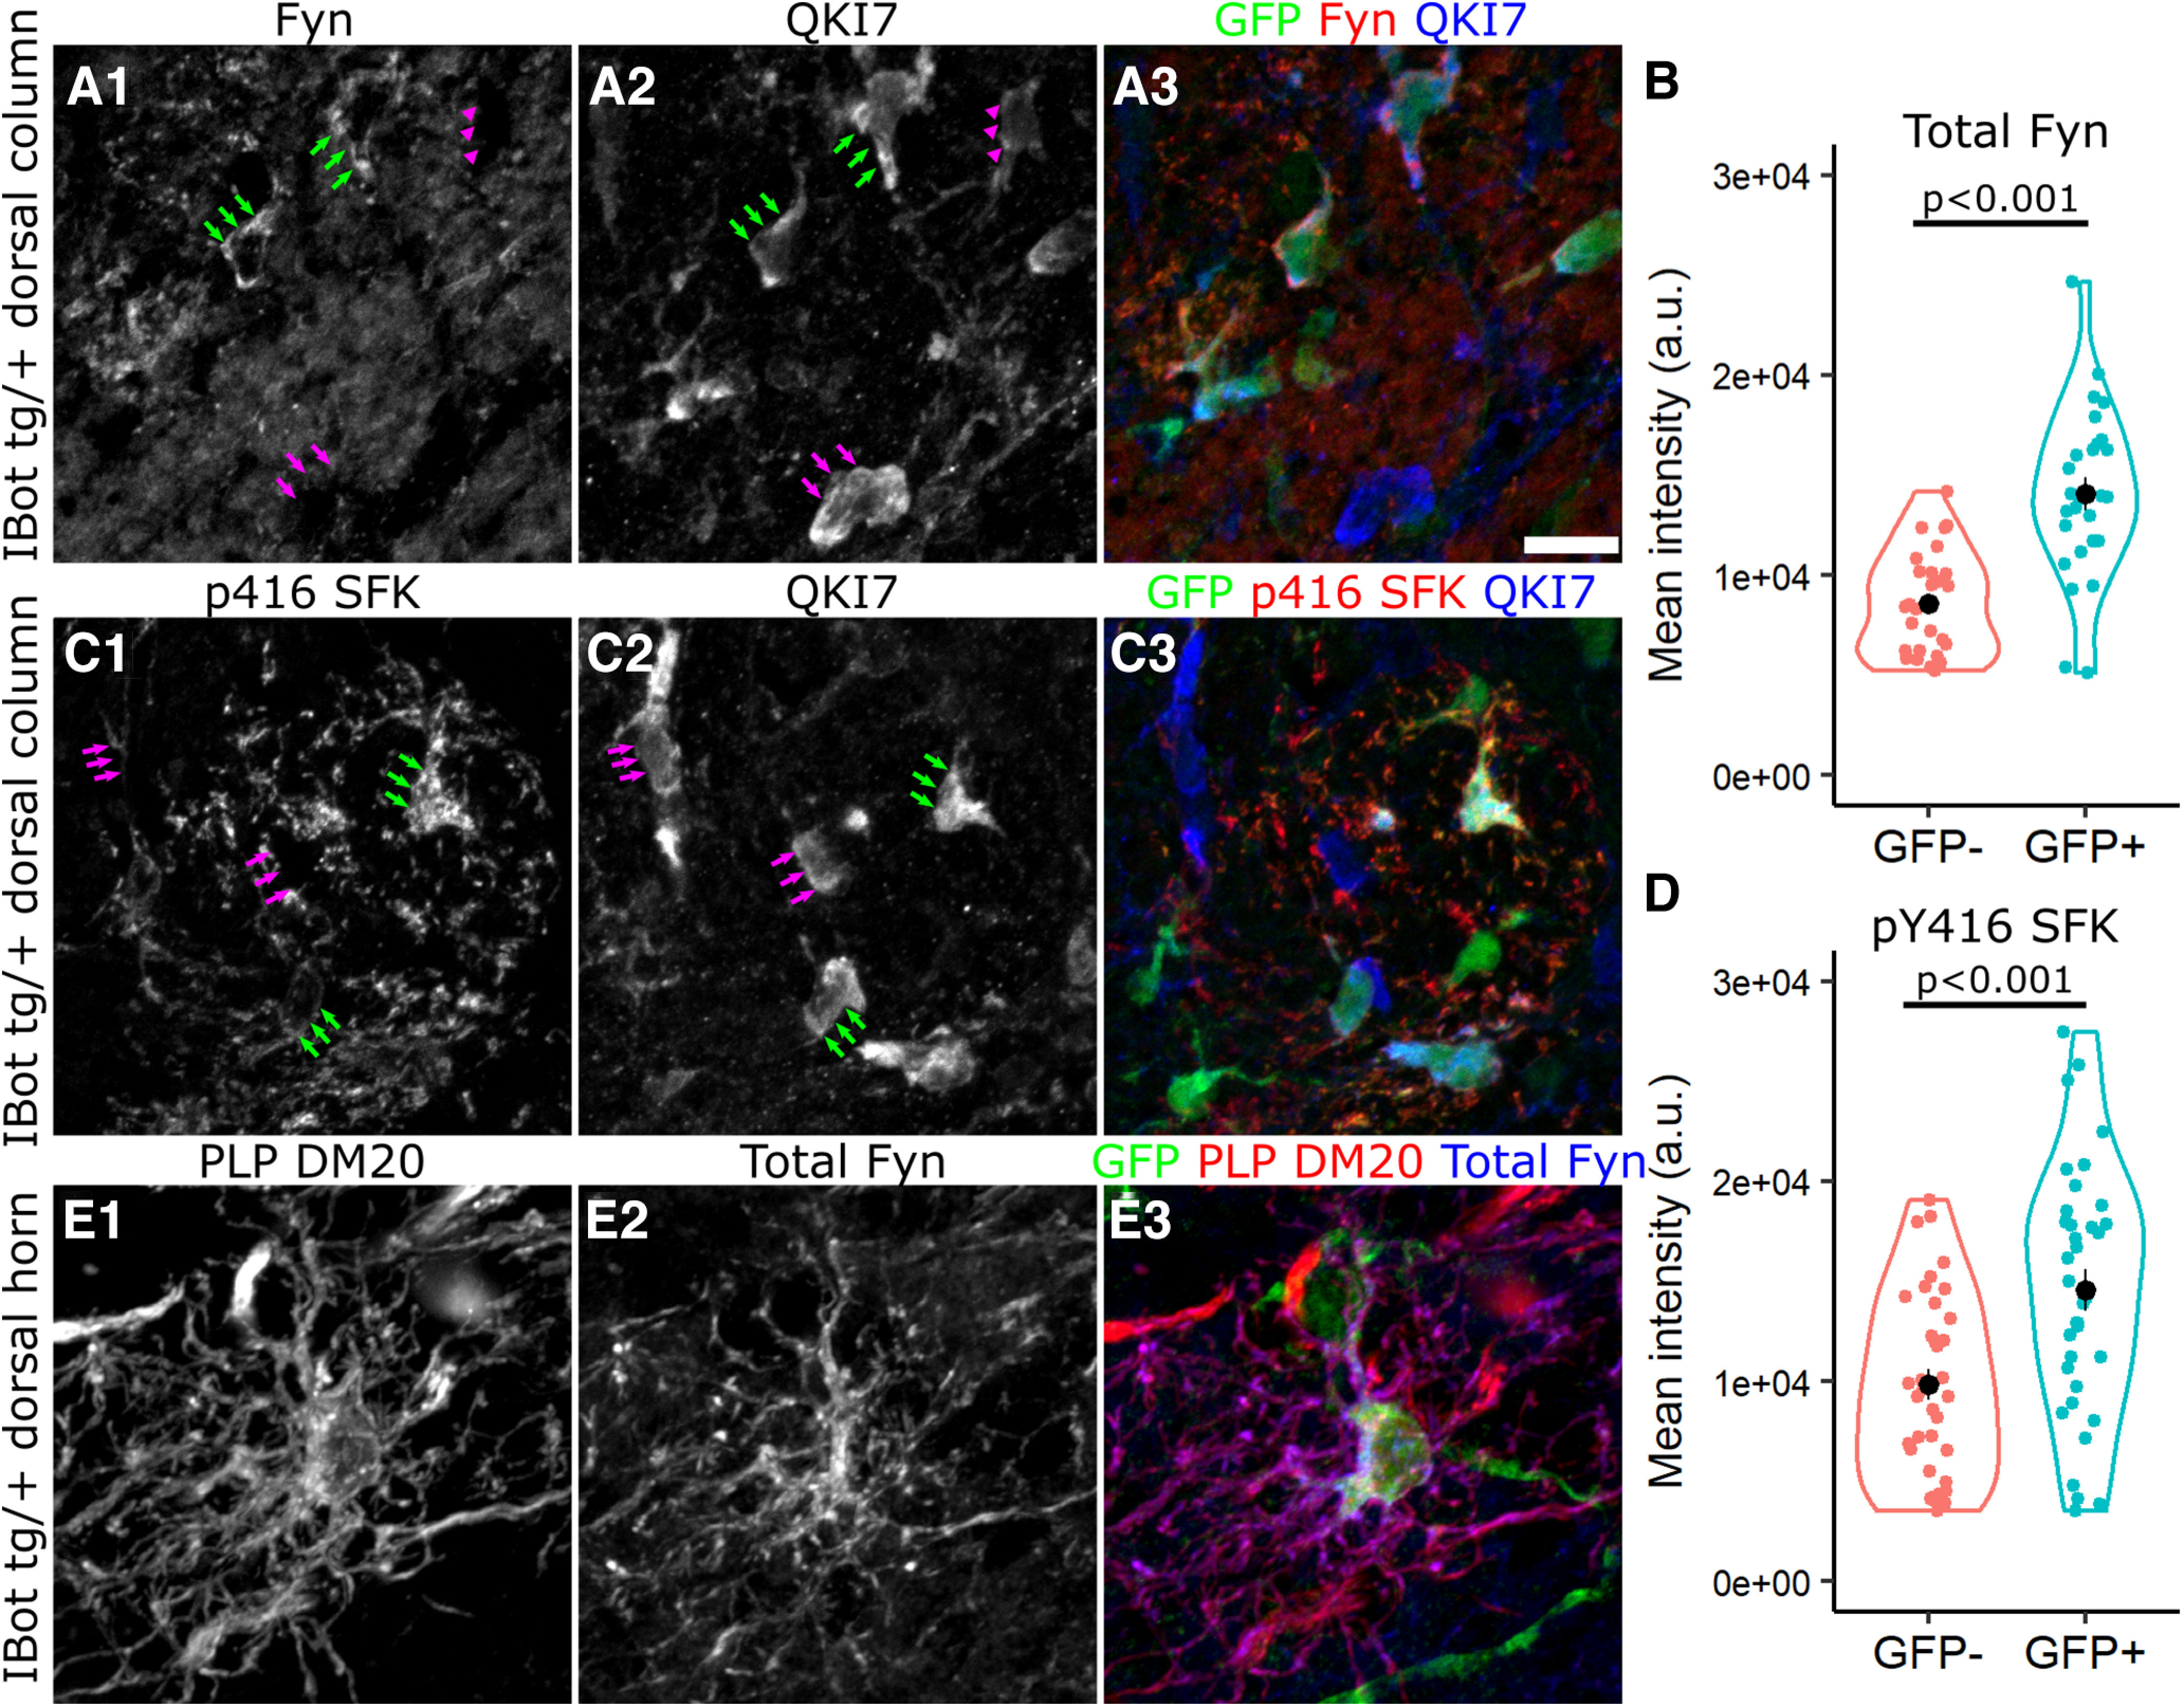
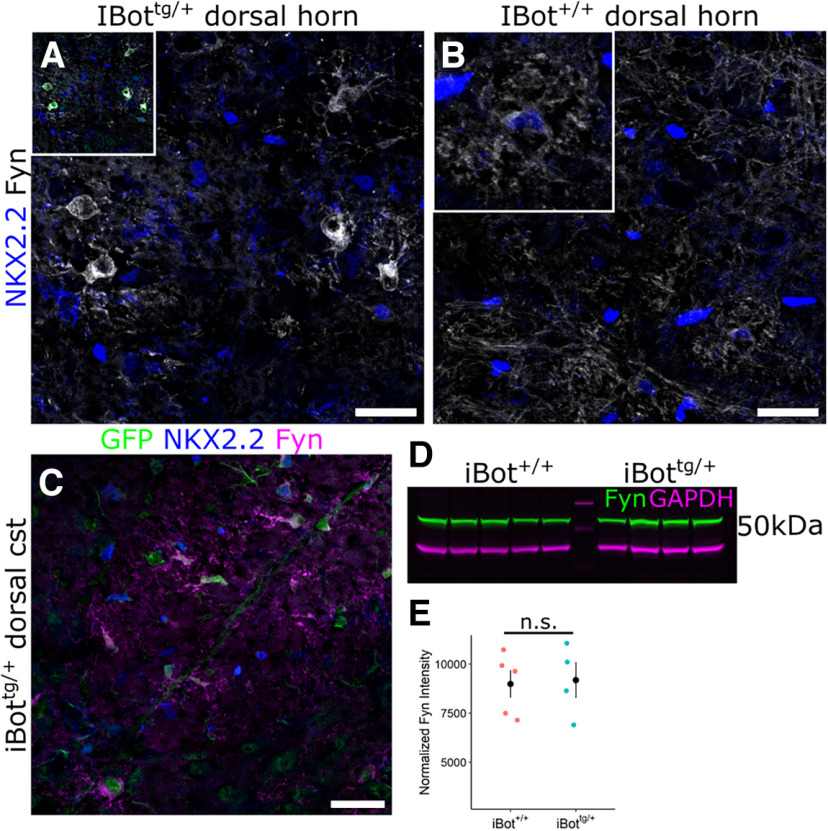
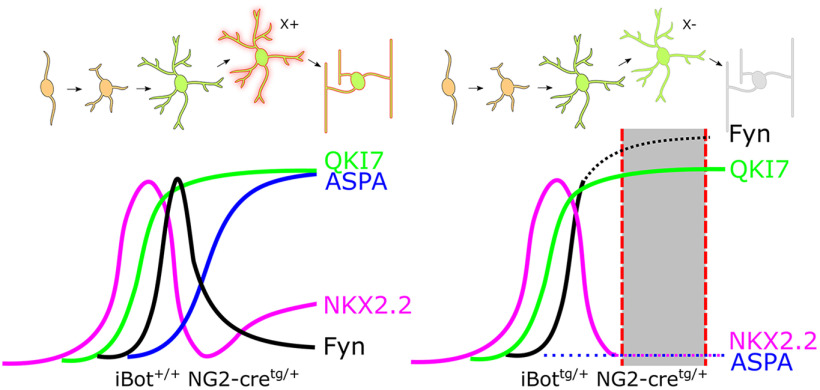
In the developing and adult CNS, new oligodendrocytes (OLs) are generated from a population of cells known as oligodendrocyte precursor cells (OPCs). As they begin to differentiate, OPCs undergo a series of highly regulated changes to morphology, gene expression, and membrane organization. This stage represents a critical bottleneck in oligodendrogliogenesis, and the regulatory program that guides it is still not fully understood. Here, we show that in vivo toxin-mediated cleavage of the vesicle associated SNARE proteins VAMP2/3 in the OL lineage of both male and female mice impairs the ability of early OLs to mature into functional, myelinating OLs. In the developing mouse spinal cord, many VAMP2/3-cleaved OLs appeared to stall in the premyelinating, early OL stage, resulting in an overall loss of both myelin density and OL number. The Src kinase Fyn, a key regulator of oligodendrogliogenesis and myelination, is highly expressed among premyelinating OLs, but its expression decreases as OLs mature. We found that OLs with cleaved VAMP2/3 in the spinal cord white matter showed significantly higher expression of Fyn compared with neighboring control cells, potentially because of an extended premyelinating stage. Overall, our results show that functional VAMP2/3 in OL lineage cells is essential for proper myelin formation and plays a major role in controlling the maturation and terminal differentiation of premyelinating OLs.SIGNIFICANCE STATEMENT The production of mature oligodendrocytes (OLs) is essential for CNS myelination during development, myelin remodeling in adulthood, and remyelination following injury or in demyelinating disease. Before myelin sheath formation, newly formed OLs undergo a series of highly regulated changes during a stage of their development known as the premyelinating, or early OL stage. This stage acts as a critical checkpoint in OL development, and much is still unknown about the dynamic regulatory processes involved. In this study, we show that VAMP2/3, SNARE proteins involved in vesicular trafficking and secretion play an essential role in regulating premyelinating OL development and are required for healthy myelination in the developing mouse spinal cord.

Keywords: Fyn; SNARE; VAMP; myelin; oligodendrocyte precursor; spinal cord.


Figures

Figure 1.
Figure 1.
Developmental hypomyelination in iBottg/+ spinal cords. A, Schematic of iBottg/+NG2cretg/+ animals. B, P13–P14 iBottg/+ dorsal column labeled for GFP and PDGFRα (B1) or QKI7 (B2; scale bar = 50 µm). C, Western blot analysis for VAMP3 (bottom) and GAPDH (top) from P14–P15 iBot+/+ and iBottg/+ spinal cord lysate. D, Quantification of VAMP3 levels normalized to GAPDH in iBot+/+ (8.04 × 10³ ± 498.40) and iBottg/+ (2.76 × 10³ ± 586.16) spinal cords (Welch’s two sample t test, t(5.83) = 11.7, p = 2.87 × 10−5, n = 5 iBot+/+ and 4 iBottg/+). E, Fixed spinal cords harvested from an iBot+/+ control animal (top) and an iBottg/+ animal (bottom). F, G, Cervical spinal cord sections labeled for MBP in iBot+/+ (F) and iBottg/+ animals (G). H, I, Fluoromyelin staining in the dorsal column of P13–P14 iBot+/+ (H) and iBottg/+ (I) mice. J, qRT-PCR showing decreased expression of Mbp (3-fold decrease), Cnp (3.4-fold decrease), Plp1 (5.4-fold decrease), and Myrf (2.6-fold decrease) in iBottg/+ spinal cords (Welch’s two sample t test for each gene, n = 3 animals per genotype). Expression values are reported as fold change compared with controls plotted on a log10 scale. K, Western blot analysis showing decreased protein levels of MBP (1.8-fold decrease), CNP (2.3-fold decrease), and PLP (8.6-fold decrease) but not PDGFRα in iBottg/+ animals compared with controls (Welch’s two sample t test for each protein, n = 4 animals per genotype). Band intensity shown is normalized to control values after normalization to the reference marker GAPDH. See Movie 1 for video demonstrating motor impairment in an iBottg/+ mouse.
Figure 2.
Figure 2.
Density of PDGFRα+ OPCs and QKI7+ OLs in the dorsal column. A, B, PDGFRα labeling in P13–P14 iBot+/+ (A) and iBottg/+ (B) dorsal column. C, PDGFRα+ cell density in iBottg/+ dorsal column (5.72 × 10⁴ ± 2.05 × 10³ cells/mm3) and control iBot+/+ dorsal column (4.84 × 10⁴ ± 6.25 × 10³ cells/mm3, Welch’s two sample t test, t(2.43) = −1.338, p =0.293, n = 3 animals for each genotype). D, E, QKI7 labeling in P13–P14 iBot+/+ (D) and iBottg/+ (E) dorsal column. F, QKI7+ cell density in iBottg/+ dorsal column (1.37 × 10⁵ ± 1.45 × 10⁴ cells/mm3) and control iBot+/+ dorsal column (2.34 × 10⁵ ± 1.89 × 10⁴ cells/mm3, Welch’s two sample t test, t(3.77) = 4.074, p = 0.017, n = 3 animals for each genotype).
Figure 3.
Figure 3.
EdU pulse chase labeling of iBottg/+ and control animals from P10–P13. A, Schematic illustrating design of EdU pulse chase experiment. B, C, Double label for QKI7 and EdU in P13 iBot+/+ (B) and iBottg/+ (C) dorsal column. D, Labeling for GFP, QKI7, and EdU from the area marked in C showing GFP+/QKI7+/EdU− OLs (red arrows) and GFP+/QKI7+/EdU+ OLs (blue arrows). E, EdU+/QKI7+ cell density in iBot+/+ (1.82 × 10⁴ ± 6.16 × 10³ cells/mm3) and iBottg/+ dorsal column (1.67 × 10⁴ ± 4.97 × 10³ cells/mm3, Welch’s two sample t test, t(5) = 0.196, p = 0.852, n = 4 iBot+/+ and 3 iBottg/+ animals). Scale bars = 20 µm (B, C), 25 µm (D).
Figure 4.
Figure 4.
Defective OL maturation in P13–P14 iBottg/+ dorsal column and following Vamp2/3 knock-down. A, B, Labeling for GSTπ and QKI7 at P13 in iBot+/+ (A) and iBottg/+ dorsal column (B). Arrowheads in B show QKI7+/GSTπ-negative early OLs, and arrows show QKI7+/GSTπ+ mature OLs. C, Percentage of QKI7+ OLs also labeled by GSTπ in iBottg/+ (31.3 ± 3.6%) and iBot+/+ dorsal column (56.6 ± 1.0%, Welch’s two sample t test, t(2.33) = 6.856, p = 0.014, n = 3 animals for each genotype). D, Percentage of QKI7+ OLs that were ASPA+ at P13–P14 in iBot+/+ dorsal column (58.4 ± 2.5%), among GFP− cells in iBottg/+ dorsal column (41.3 ± 8.0%), and among GFP+ cells in iBottg/+ dorsal column (10.6 ± 4.7%, ANOVA, F(2,7) = 23.07, p = 8.30 × 10−4, Tukey’s HSD post hoc tests, p = 6.55 × 10−4 for iBot+/+:iBottg/+GFP+). E–G, Dissociated rat spinal cord OPCs transduced with lentivirus encoding control-GFP (E), Vamp2shRNA-GFP (F), or Vamp3shRNA-GFP (G) and stained for MBP after 6 d in differentiation media. H, Proportion of MBP+ GFP+ cells with mature OL morphology, exhibiting membranous processes. One-way ANOVA, Brown–Forsythe test, F(2,6) = 6.340, p = 0.0331. Scale bars = 50 µm.
Figure 5.
Figure 5.
Expression of NKX2.2 among QKI7+ and ASPA+ OLs in iBot+/+ and iBottg/+ dorsal column. A, B, NKX2.2 labeling in spinal cord sections from P13 to P14 iBot+/+ (A) and iBottg/+ (B) mice. C, Density of NKX2.2+/QKI7+ cells in dorsal column of iBot+/+ (3.93 × 10⁴ ± 1.80 × 10³ cells/mm3) and iBottg/+ mice (2.08 × 10⁴ ± 2.30 × 10³ cells/mm3; t(3.79) = 6.31, p = 0.0039). D, Density of NKX2.2high/QKI7+ in dorsal column of iBot+/+ (9.29 × 10³ ± 263.90 cells/mm3) and iBottg/+ mice (1.33 × 10⁴ ± 2.42 × 10³ cells/mm3; t(2.05) = −1.65, p = 0.2377). E, Labeling for NKX2.2 and ASPA in the dorsal column of iBot+/+ control mice showing NKX2.2high/ASPA− cells (red arrows) and NKX2.2low/ASPA+ cells (white arrows). F, Quantification of the percentage of ASPA+ OLs with detectable nuclear NKX2.2 expression in iBot+/+ (31.06 ± 3.05%) and iBottg/+ (10.53 ± 2.83%) dorsal column (t(3.98) = 4.93, p = 0.008). G, Immunofluorescent labeling for NKX2.2 and QKI7 in iBot+/+ dorsal column showing NKX2.2low OLs (white arrows). H, Labeling for NKX2.2 and QKI7 in iBottg/+ dorsal column showing NKX2.2high (red arrows) and NKX2.2− OLs (white arrows). I, Quantification of the percentage of NKX2.2+ QKI7+ OLs in iBot+/+ (33.68 ± 0.90%) and iBottg/+ dorsal column (27.60 ± 1.05%; t(3.90) = 4.40, p = 0.0124). J, Percentage of NKX2.2high/QKI7+ OLs in iBot+/+ (8.01 ± 0.55%) and iBottg/+ dorsal column (17.64 ± 2.88%; t(2.15) = −3.28, p = 0.0744). All statistical tests done using Welch’s two sample t test with n = 3 animals for each genotype. Scale bars = 50 µm (A, B), 20 µm (E, G, H).
Figure 6.
Figure 6.
Cleaved caspase 3 labeling for apoptotic cells in P13 dorsal column. A, B, Double label for cCasp3 and Olig2 with DAPI in dorsal column of P13 iBot+/+ (A) and iBottg/+ mice (B) showing cCasp3+ apoptotic cells (arrows). C, cCasp3+ cell density in the dorsal column of P13 iBot+/+ mice (1.64 × 10³ ± 429.9 cells/mm3) and iBottg/+ mice (4.45 × 10³ ± 992.8 cells/mm3, Welch’s two sample t test, t(6.8) = −2.60, p = 0.036, n = 6 iBot+/+ and 6 iBottg/+ animals). D, Density of double labeled cCasp3+/Olig2+ cells in the dorsal column of P13 iBot+/+ mice (868.8 ± 369.6 cells/mm3) and iBottg/+ mice (3.89 × 10³ ± 1.59 × 10³ cells/mm3, Welch’s two sample t test, t(2.22) = −1.852, p = 0.193, n = 5 iBot+/+ and 3 iBot tg/+ animals). E, Density of double labeled cCasp3+/ALDH1L1+ cells in the dorsal column of P13 iBot+/+ mice (659.4 ± 659.4 cells/mm3) and iBottg/+ mice (0 cells/mm3, Welch’s two sample t test, t(2) = 1, p = 0.4226, n = 3 animals for each genotype). F, cCasp3+/GFP+ double labeled cells (arrows) in P13 iBottg/+ dorsal column. Scale bars = 50 µm (A, B), 10 µm (F).
Figure 7.
Figure 7.
Morphologic features of iBottg/+ and iBot+/+ OLs in the dorsal horn at P13. A–C, Double label for PLP/DM20 and GFP in iBottg/+ (A, B) and iBot+/+ mice (C) showing a premyelinating OL (A) or myelinating OLs (B, C) in the dorsal horn at P13. D, Percentage of QKI7+ OLs scored as having a premyelinating morphology among GFP− OLs (0%) and GFP+ OLs (46.4 ± 6.9%, Welch’s two sample t test, t(2) = −6.712, p = 0.021, n = 3 iBottg/+ animals, cells were scored from two different images taken in the dorsal horn of each animal). E, F, Low-magnification images of PLP/DM20 labeling in the dorsal horn of iBot+/+ (E) and iBottg/+ (F) mice at P13. Inset shows a magnified view of the premyelinating OL from the region outlined in red (F). γ Was adjusted to 0.5 (E, F) to better visualize premyelinating OLs. Scale bars = 10 µm (A–C), 50 µm (E, F).
Figure 8.
Figure 8.
Fyn is highly expressed throughout the soma and processes of iBottg/+ OLs. A, C, Labeling for QKI7, GFP and either Fyn (A) or p416 SFK (C) around the border of iBottg/+ (GFP+, green arrows) and iBot+/+ OLs (GFP−, magenta arrows) in iBottg/+ corticospinal tract. B, Average fluorescence intensity of Fyn staining along the edge of GFP− (8.61 × 10³ ± 495.1 a.u.) and GFP+ (1.41 × 10⁴ ± 819.3 a.u.) OLs in the dorsal column of iBottg/+ animals (Welch’s two sample t test, t(42.76) = −5.70, p = 1.03 × 10−6, n = 27 cells per condition from 3 iBottg/+ animals). D, Average fluorescence intensity of p416 SFK staining along the edge of GFP− (9.83 × 10³ ± 757 a.u.) and GFP+ OLs (1.45 × 10⁴ ± 1.03 × 10³ a.u., Welch’s two sample t test, t(64.13) = −3.679, p = 4.81 × 10−4, n = 36 cells per condition from 4 iBottg/+ animals). E, GFP+ premyelinating OL labeled for PLP/DM20, Fyn, and GFP in P13 iBottg/+ dorsal horn. Scale bar = 10 µm (A, C).
Figure 9.
Figure 9.
Fyn expression in iBottg/+ spinal cords is concentrated in NKX2.2− BoNT/B-expressing OLs. A, Immunolabeling for Fyn and NKX2.2 in iBottg/+ dorsal horn, inset shows overlay with GFP. B, Immunolabeling for Fyn and NKX2.2 iBot+/+ dorsal horn, inset shows enlarged view of control premyelinating OL. C, GFP, NKX2.2, and Fyn labeling in iBottg/+ dorsal corticospinal tract. D, Western blot analysis for total Fyn (green) and GAPDH (magenta) from P14–P15 iBot+/+ and iBottg/+ spinal cord lysates. E, Quantification of total Fyn signal normalized to GAPDH from iBot+/+ (8.99 × 10³ ± 705.49 a.u.) and iBottg/+ (9.18 × 10³ ± 907.86 a.u.) spinal cord lysates (Welch’s two sample t test, t(6.06) = −0.168, p = 0.872, n = 5 iBot+/+ and 4 iBottg/+ mice). Scale bar = 25 µm (AC).
Figure 10.
Figure 10.
Proposed model of OL lineage development and gene expression timing in iBot+/+ and iBottg/+ spinal cords. Dotted lines indicate abnormal expression timing observed in the iBottg/+ mice relative to control, while the shaded region denotes the approximate stage in which iBottg/+ OLs are lost. Impaired VAMP2/3-dependent secretion and/or trafficking of a hypothetical molecule X is indicated at the transition between premyelinating and myelinating stages of development.

Similar articles

Cited by

References

    1. Barres BA, Hart IK, Coles HSR, Burne JF, Voyvodic JT, Richardson WD, Raff MC (1992) Cell death and control of cell survival in the oligodendrocyte lineage. Cell 70:31–46. 10.1016/0092-8674(92)90531-g - DOI - PubMed
    1. Bijlard M, Klunder B, de Jonge JC, Nomden A, Tyagi S, de Vries H, Hoekstra D, Baron W (2015) Transcriptional expression of myelin basic protein in oligodendrocytes depends on functional syntaxin 4: a potential correlation with autocrine signaling. Mol Cell Biol 35:675–687. 10.1128/MCB.01389-14 - DOI - PMC - PubMed
    1. Bin JM, Harris SN, Kennedy TE (2016) The oligodendrocyte-specific antibody ‘CC1’ binds quaking 7. J Neurochem 139:181–186. 10.1111/jnc.13745 - DOI - PubMed
    1. Binz T, Sikorra S, Mahrhold S (2010) Clostridial neurotoxins: mechanism of SNARE cleavage and outlook on potential substrate specificity reengineering. Toxins (Basel) 2:665–682. 10.3390/toxins2040665 - DOI - PMC - PubMed
    1. Bu J, Banki A, Wu Q, Nishiyama A (2004) Increased NG2+ glial cell proliferation and oligodendrocyte generation in the hypomyelinating mutant shiverer. Glia 48:51–63. 10.1002/glia.20055 - DOI - PubMed

Publication types

Substances