. 2023 Aug 24;14(1):5165.
doi: 10.1038/s41467-023-40816-7.

Circadian clock regulator Bmal1 gates axon regeneration via Tet3 epigenetics in mouse sensory neurons

Affiliations

Circadian clock regulator Bmal1 gates axon regeneration via Tet3 epigenetics in mouse sensory neurons

Dalia Halawani et al. Nat Commun. .

Abstract

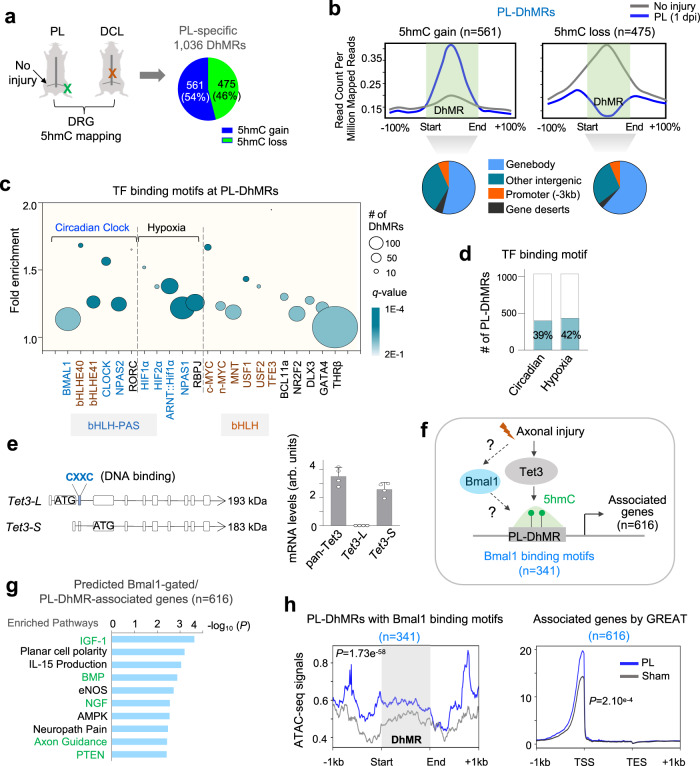
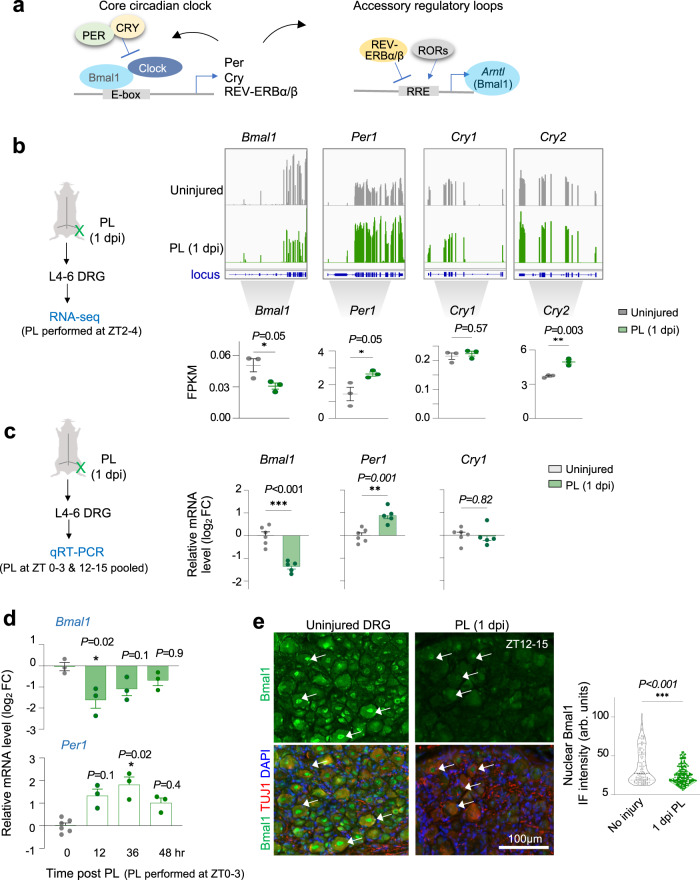
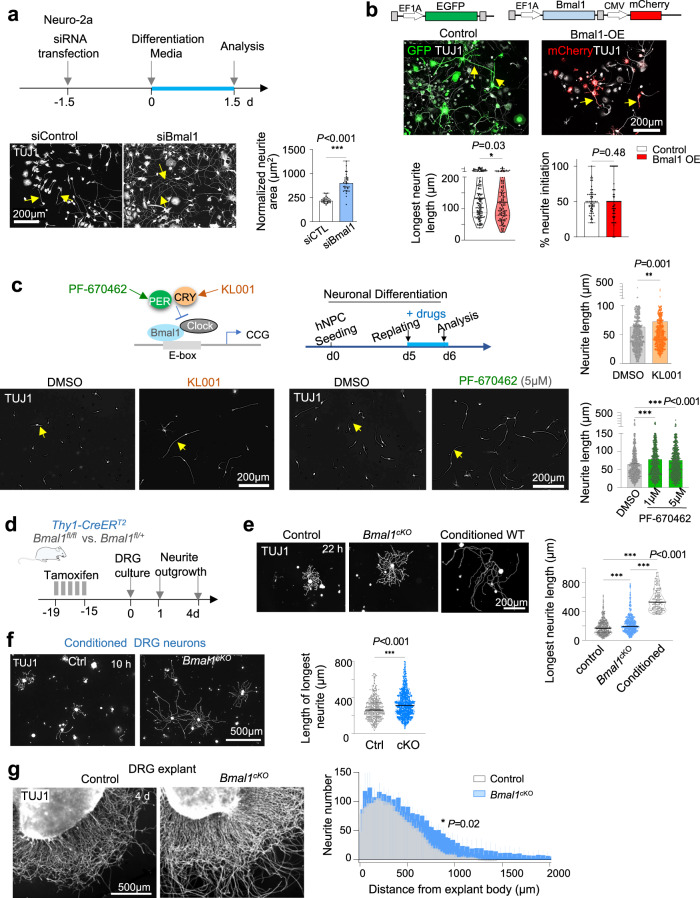
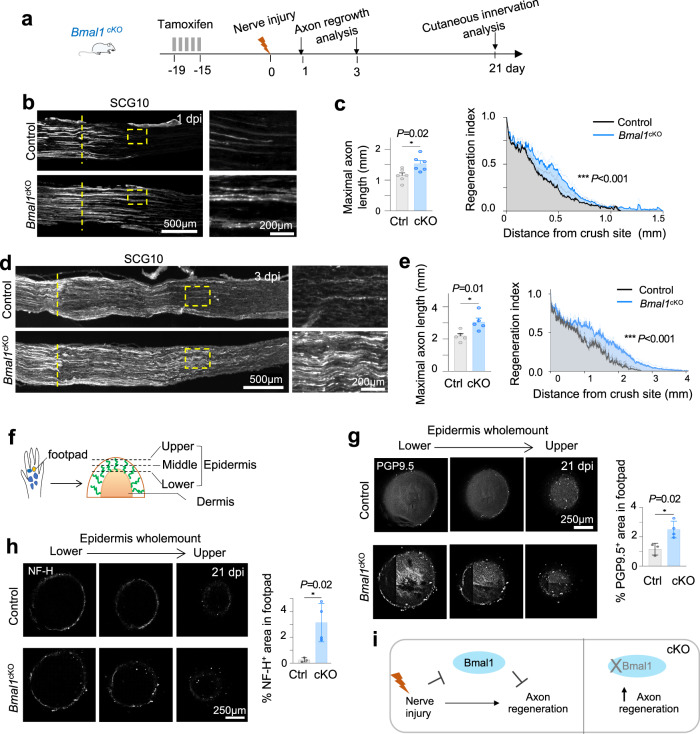
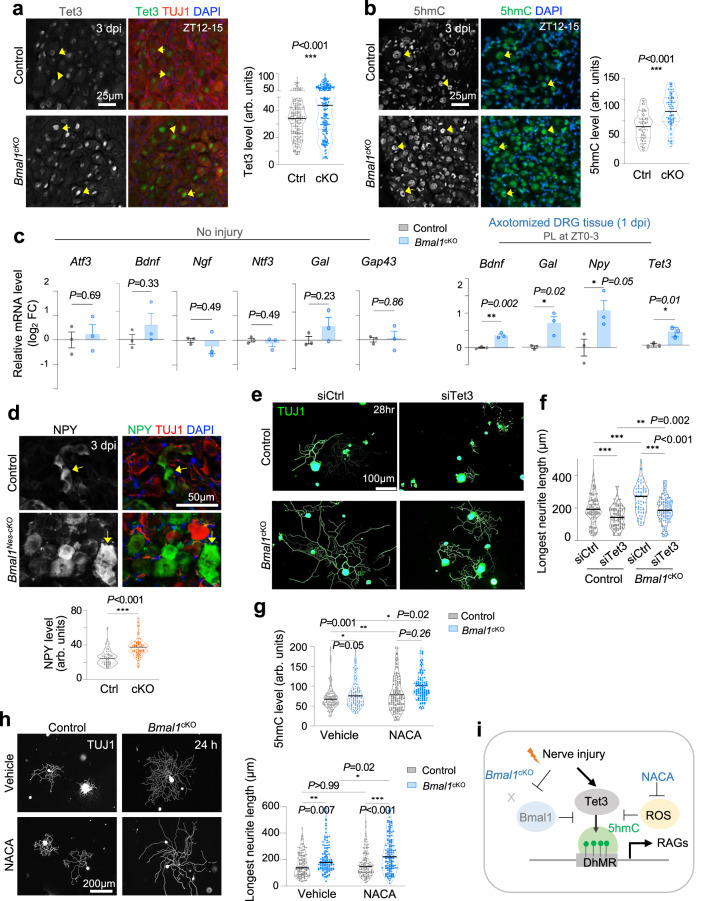
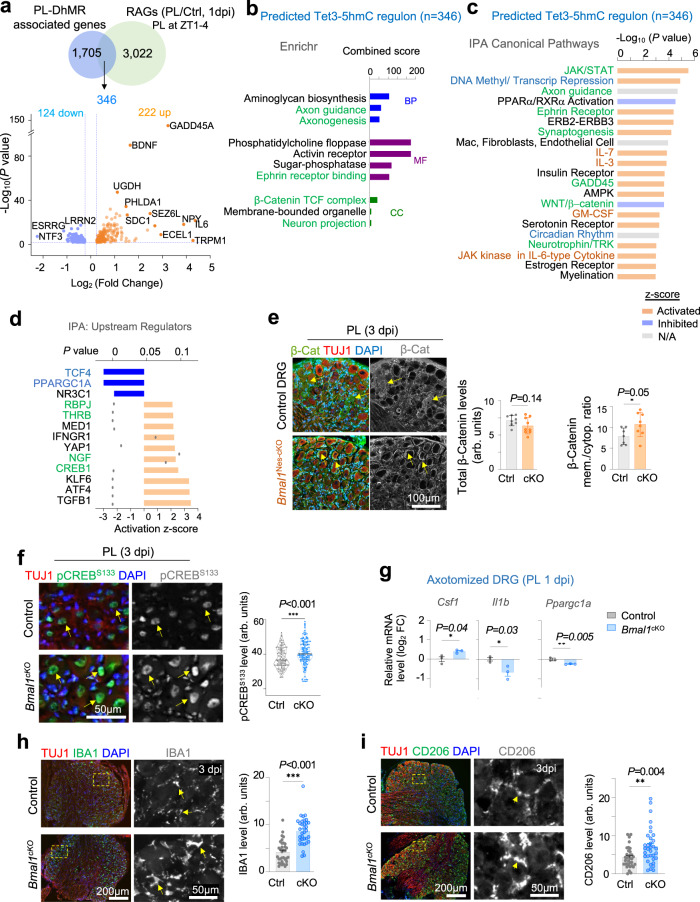
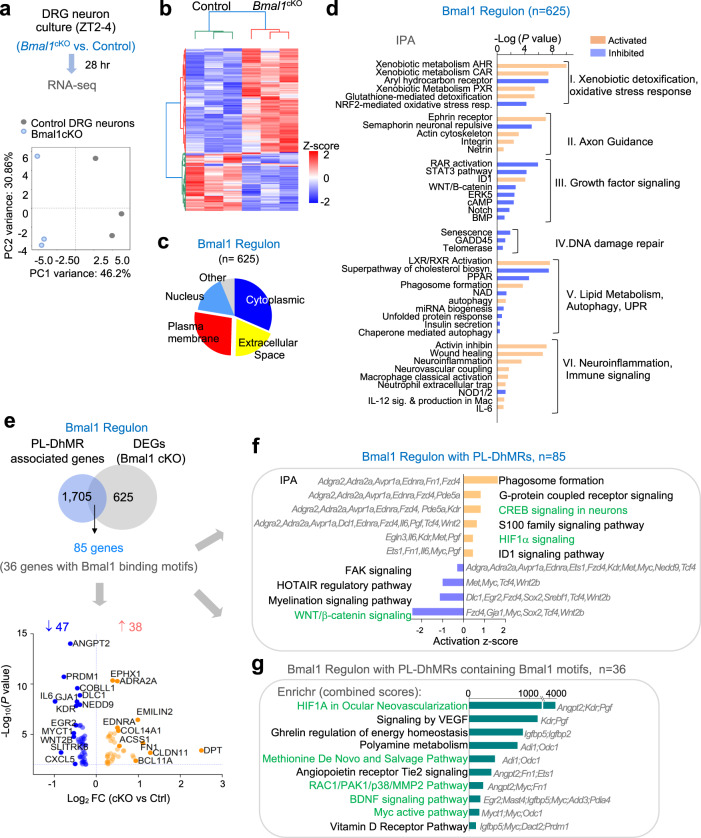
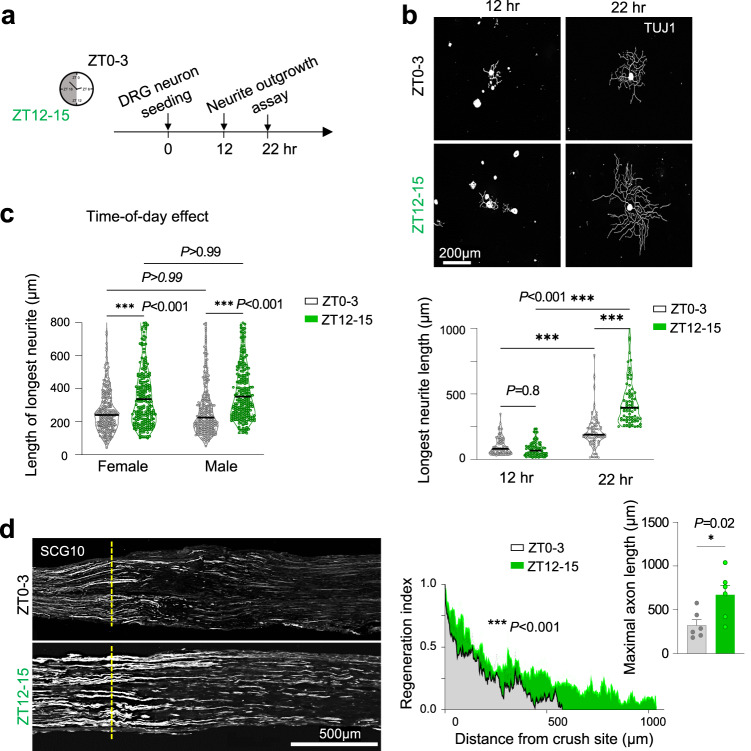
Axon regeneration of dorsal root ganglia (DRG) neurons after peripheral axotomy involves reconfiguration of gene regulatory circuits to establish regenerative gene programs. However, the underlying mechanisms remain unclear. Here, through an unbiased survey, we show that the binding motif of Bmal1, a central transcription factor of the circadian clock, is enriched in differentially hydroxymethylated regions (DhMRs) of mouse DRG after peripheral lesion. By applying conditional deletion of Bmal1 in neurons, in vitro and in vivo neurite outgrowth assays, as well as transcriptomic profiling, we demonstrate that Bmal1 inhibits axon regeneration, in part through a functional link with the epigenetic factor Tet3. Mechanistically, we reveal that Bmal1 acts as a gatekeeper of neuroepigenetic responses to axonal injury by limiting Tet3 expression and restricting 5hmC modifications. Bmal1-regulated genes not only concern axon growth, but also stress responses and energy homeostasis. Furthermore, we uncover an epigenetic rhythm of diurnal oscillation of Tet3 and 5hmC levels in DRG neurons, corresponding to time-of-day effect on axon growth potential. Collectively, our studies demonstrate that targeting Bmal1 enhances axon regeneration.


Conflict of interest statement

The authors declare no competing interests.

Figures

Fig. 1
Fig. 1. Bmal1 is linked to peripheral lesion of DRG and interacts with Tet3.
a Graphical summary of genome-wide mapping of 5hmC reconfigurations after PL (peripheral lesion) vs. DCL (dorsal column lesion) or no injury, which identified 1,036 differentially hydroxymethylated regions (DhMRs) after PL. Pie chart shows proportion of PL-DhMRs with 5hmC gain versus loss. b Top, normalized 5hmC signals after PL versus no injury across DhMRs. Bottom, pie charts showing distribution of DhMRs in genomic regions. c Bubble plot showing enriched TF binding motifs in PL-specific DhMRs. Members of the bHLH-PAS family are labeled in blue and members of the bHLH family in brown. Circle size indicates DhMR numbers and color scale indicates significance of enrichment. d Bar graphs showing the number (y-axis) and percentage of PL-specific DhMRs that contain binding motifs for circadian-related or hypoxia-related transcription factors. e Left, diagram of the long and short isoforms of Tet3. ATG denotes start codon, CXXC indicates DNA binding domain. Right, qRT-PCR shows predominant expression of short isoform Tet3-S in uninjured DRGs. Data represent mean ± SEM. n = 4 independent studies, each with 6-9 pooled DRGs. f Model of potential Bmal1 and Tet3 interaction at DhMRs that may impact Tet3 targeting and 5hmC reconfigurations after peripheral lesion of DRG. g Ingenuity pathway analysis (IPA) highlighting the top enriched pathways for the 616 genes harboring PL-specific DhMRs with Bmal1 binding motif in response to axonal injury. Right-tailed Fisher’s exact test. h Analysis of ATAC-seq signals from DRG after sham or PL at 1 dpi (raw data from Palmisano et al.) showed increased chromatin accessibility at PL-specific DhMRs with Bmal1 binding motif and associated genes near transcription start sites (TSS). TES, transcription end site. Welch’s two-sample t-test.
Fig. 2
Fig. 2. Peripheral lesion of DRG axons results in downregulation of Bmal1.
a Schematic of core circadian clock components and feedback loops that control Bmal1 expression and activity. E-box, enhancer box; RRE, REV-ERB/ROR response element. b Left, experimental paradigm of ipsilateral L4–L6 DRGs analyzed by RNA-seq at 1-day after peripheral lesion (PL at ZT2-4) or no injury. Top right, RNA-seq coverage tracks for differentially expressed circadian genes after PL at 1 dpi pooled from n = 3 samples per group. Bottom right, the expression levels of circadian clock genes as fragments-per-kilobase-per-million reads (FPKM). n = 3, each pooled from L4–L6 DRGs. Data represent mean ± SEM. Unpaired two-tailed Student’s t-test. c Left, experimental paradigm of peripheral lesion (PL) and collection of ipsilateral L4–L6 DRGs for gene expression analysis. Right, qRT-PCR shows transcriptional changes of circadian clock genes in axotomized DRG at 1 dpi after PL as compared to uninjured DRG. n = 5–6 independent samples, each pooled from L4–L6 DRGs. Data represent mean ± SEM. Unpaired two-tailed Student’s t-test. d Time-course analysis of Bmal1 transcription in L4–6 DRGs after PL by qRT-PCR. n = 3 independent DRG samples, pooled from two CD1 mice. Data represent mean ± SEM. Kruskal–Wallis with Dunn’s multiple comparison’s test. e Representative IF images and quantification of L5 DRGs show diminished nuclear signal of Bmal1 in axotomized DRG neurons (TUJ1+) at 1 dpi after PL. Violin plots of n = 100 uninjured and 183 axotomized neurons from 4 DRGs from 4 mice per group. Median is shown by black line. Mann–Whitney test.
Fig. 3
Fig. 3. Bmal1 inhibition enhances axon outgrowth.
a Top, experimental paradigm. Bottom, representative IF images and quantification of TUJ1+ area normalized to the number of soma per image, n = 39 images from 2 independent experiment. Data represent mean ± SEM, Mann–Whitney test. b Top, schematic of lentiviral vectors. Bottom, representative IF images and quantification of neurite length and percentage of neurite initiation of control (EGFP+) or Bmal1 overexpression (mCherry+) in Neuro-2a cells. n > 140 neurons for neurite length, and 60 images per group for percentage of neurite initiation. Data represent mean ± SEM. Mann–Whitney test. c Top left, diagram of pharmacological drugs stabilizing negative regulators of Bmal1 transcriptional activity. Top right, paradigm of neurite outgrowth assay of iNeurons. Bottom, representative IF images show longer neurite outgrowth from drug-treated iNeurons. Arrows point to neurites. Quantification: n = 600–900 neurons pooled from 3 independent cultures. Data represent mean ± SEM. Mann–Whitney test for KL001 vs. DMSO. Kruskal–Wallis with Dunn’s multiple comparison test for PF-670462 vs. DMSO. d Experimental paradigm for tamoxifen administration to adult mice for neuron specific Bmal1 cKO. e IF images and quantification of neurite outgrowth of primary DRG neurons. Violin plots of n = 348 control, 305 Bmal1cKO, and 148 conditioned neurons from n = 3 mice. Median is shown by black line. Kruskal–Wallis with Dunn’s multiple comparison test. f IF images show that Bmal1 cKO could augment DRG conditioning lesion effect (with PL 3 days prior) in enhancing neurite outgrowth. Note early time point at 10 h after plating due to exuberant neurite outgrowth from the conditioning effect. Violin plots of n = 375 control and 626 Bmal1cKO neurons collected from n = 3 mice per group. Data represent mean ± SEM. Two-way ANOVA followed by Bonferroni’s multiple comparison test. g IF images of adult DRG explants show longer neurite outgrowth from Bmal1cKO DRGs compared to control at 4 d of culture. Quantification of 8 images collected from n = 6 DRGs (L4–L6) from n = 2 mice per group. Two-way ANOVA followed by Bonferroni’s multiple comparison test.
Fig. 4
Fig. 4. Neuronal deletion of Bmal1 accelerates axon regeneration after sciatic nerve injury.
a Experimental paradigm of in vivo axon regeneration analysis at 1, 3, and 21 d after sciatic nerve injury. Representative IF images and quantifications of axon regeneration (SCG10+) at sciatic nerve crush site at 1 dpi (b, c) or 3 dpi (d, e). Note enhanced axon regeneration in Bmal1 cKO as compared to littermate controls. Dashed vertical lines denote lesion center defined by maximal SCG10 immunointensity. Right panels show enlarged images of boxed areas. Data represent mean ± SEM and unpaired two-tailed Student’s t test for maximal axon length. Two-way ANOVA for regeneration index, measured by SCG10 immunointensity normalized to value at lesion center. n = 5–6 mice per genotype. f Diagram of analysis of innervation of footpad epidermis. Representative images and quantifications of whole mount IF staining for pan-neuronal marker PGP9.5 (g) or axon marker NF-H (h) show improved footpad epidermis innervation in Bmal1 cKO at 21 dpi. Micrographs are representative confocal scans of a 400 µm segment, spanning the top, middle, and lower portion of the epidermis. n = 3 control and 4 Bmal1cKO mice per group. Data represent mean ± SEM. Unpaired two-tailed Student’s t-test. i Working model for a role of Bmal1 as repressor of axon regeneration; removing this brake augments axon regeneration after peripheral nerve injury.
Fig. 5
Fig. 5. Bmal1 affects Tet3-5hmC induction and RAGs expression after peripheral lesion of DRG.
Representative IF images of Tet3 (a) and 5hmC (b) expression in lumbar DRGs at 3 dpi after PL (ZT12–15). Violin plots of n = 225 control and 250 Bmal1cKO (Tet3) and n = 90 (5hmC) DRG neurons from n = 9 L4–6 DRGs of 3 mice per genotype. Median is shown by black line. Mann–Whitney test. c qRT-PCR of gene expression in lumbar DRGs with no injury (left) or PL at 1 dpi (right panel). Bmal1 cKO augmented RAGs expression only after PL. n = 3 independent studies at ZT0–3, each with 6 L4–6 DRGs pooled from 2 mice. Data represent mean ± SEM. Unpaired two-tailed Student’s t-test. d IF images of NPY expression in L4–L6 DRGs at 3 dpi after PL. n = ~70 neurons from n = 9 L4–6 DRGs of 3 mice per genotype. Median is shown by black line. Mann–Whitney test. e, f IF images of primary DRG neurons at 28 h after plating show that siTet3 reversed the growth advantage of Bmal1 deletion. n = 70–124 DRG neurons pooled from 2 mice per condition. Median is shown by black line. Two-way ANOVA followed by Bonferroni’s multiple comparison test. g Quantification of 5hmC immunointensity in individual DRG neurons. Violin plots of n = 150–170 DRG neurons (L4–L6) from 2 mice for each condition. Black lines represent median. Two-way ANOVA followed by Bonferroni’s multiple comparison test. h IF images of neurite outgrowth and quantification. Violin plots of n = 115–145 DRG neurons (L4–6) from 2 mice for each condition. Median is shown by black line. Two-way ANOVA followed by Bonferroni’s multiple comparison test. i Model of Bmal1 and DNA hydroxymethylation in conditioned DRG neurons. Bmal1 deletion augments Tet3 induction, but elevated ROS inhibits Tet3 activity. NACA alleviates ROS inhibition, leading to further 5hmC gains and axon regeneration. ROS Reactive oxygen species, NACA N-acetyl-cysteine amide.
Fig. 6
Fig. 6. Tet3-5hmC regulon governs axon growth and immune response after peripheral lesion of DRG.
a Top, Venn diagram showing the overlap of genes associated with PL-DhMRs (n = 1705) and differentially regulated genes (DEGs) at 1-day post sciatic nerve crush injury compared to no injury (RAGs), identified by RNA-seq. Bottom, volcano plot of the 346 overlapping PL RAGs, with labeled top DEGs. Welch’s two-sample t-test. b Enrichr analysis showing top enriched ontologies of the 346 RAGs identified in (a). c IPA showing the top enriched canonical pathways of the 346 RAGs. Bar color indicates predicted activation (orange), and inhibition (blue) of pathways, and gray bars indicate insufficient evidence for prediction of activation state. Right-tailed Fisher’s exact test. d IPA analysis for top upstream transcriptional regulators of the 346 RAGs. Bar color indicates predicted activation (orange) or inhibition (blue) of pathways. Right-tailed Fisher’s exact test. e Representative IF images and quantifications show higher membrane association of β-catenin in axotomized lumbar Bmal1cKO DRG neurons than in controls (TUJ1+) at 3 dpi after PL, but overall levels were comparable. Quantification of images from n = 2-3 DRGs from 3 mice for each genotype. Data represent mean ± SEM. Unpaired two-tailed Student’s t-test. f Representative IF images and quantifications show higher levels of nuclear pCrebS133 in axotomized Bmal1cKO DRG neurons than controls (TUJ1+) at 3 dpi after PL. Violin plots of n = 150 control and 170 Bmal1cKO neurons from n = 8 DRGs from n = 3 mice for each genotype. Median shown by black line. Mann-Whitney test. g. qRT-PCR validation of the effect of Bmal1 ablation on gene expression related to immune or metabolism in axotomized lumbar DRGs at 1 dpi after PL. n = 3 independent samples of L4–L6 DRGs, each pooled from 2 mice for each genotype. Data represent mean ± SEM. Unpaired two-tailed Student’s t-test. Representative IF images and quantifications show increased expression of immune cell markers IBA1 (h) and CD206 (i) in axotomized lumbar DRGs at 3 d after sciatic nerve injury in Bmal1 cKO than control mice. n = 17 DRGs collected from 6 pairs of mice. Data represent mean ± SEM. Mann–Whitney test.
Fig. 7
Fig. 7. Bmal1 regulon concerns stress responses and energy homeostasis during axon regeneration.
a Top, schematic of experimental paradigm for RNA-seq analysis on primary DRG neurons isolated from Bmal1 cKO or control mice at ZT2–4 and cultured for 28 h. Bottom, principal component analysis of RNA-seq data shows segregation of samples from Bmal1 cKO vs. control DRG neurons. b Heatmap of DEGs between Bmal1 cKO and control neurons, cutoff: abs (log2 FC) > 0.38 and P < 0.01. c Pie chart of subcellular localization of n = 625 Bmal1-regulated genes computed by IPA, cutoff: abs (log2 FC) > 0.25 and P < 0.01. d IPA showing the top enriched canonical pathways of Bmal1 regulon, with color of bars indicating predicted activation (orange) or inhibition (blue) of pathways. Right-tailed Fisher’s exact test. e Top, Venn diagram showing the overlap between genes associated with PL-DhMRs (n = 1705) and Bmal1 regulated genes (n = 625). Bottom, volcano plot of the 85 overlapping genes, with top DEGs labeled. f IPA highlights top canonical pathways of 85 Bmal1-regulated genes containing PL-DhMRs. Bar color indicates predicted activation (orange) or inhibition (blue). Pathway associated genes are labeled. Note, predicted activation of CREB and repression of Wnt/β-catenin signaling with Bmal1 cKO. Right-tailed Fisher’s exact test. g. Enrichr result of top pathways enriched in 36 Bmal1 regulated genes with Bmal1-motif in DhMRs.
Fig. 8
Fig. 8. Diurnal expression changes of Tet3 and 5hmC in DRG neurons.
a qRT-PCR reveals diurnal transcriptional changes of circadian clock genes in DRGs. Note the anti-phasic expression of Bmal1 and circadian genes of the translation/transcription feedback loops that control Bmal1 rhythmicity. n = 6 independent samples for Bmal1, Clock, Per1, Per2, Cry1 and n = 4 for Nr1d1 and Nr1d2, each sample pooled from n = 2 mice. Samples were collected on consecutive days at the indicated ZT. Data represent mean ± SEM. Unpaired two-tailed Student’s t-test. b Representative IF images and quantifications show higher nuclear levels of Tet3 in uninjured DRG neurons at ZT12–15 than ZT0–3. Note the time-of-day effect persisted on Tet3 upregulation after PL, with higher level at 1 dpi when injury occurred at ZT12–15. n = 9 DRGs isolated from 3 mice per condition. Data represent mean ± SEM. Two-way ANOVA followed by Bonferroni’s multiple comparison test. c qRT-PCR shows diurnal changes of Tet3 transcription in uninjured DRGs, higher at ZT12–15 than ZT0–3. PL resulted in a robust Tet3 induction for ZT0–3, and no further gain for ZT12–15 (which has a high baseline level of Tet3). n = 4 independent samples from 4 mice for each condition. Data represent mean ± SEM, Two-way ANOVA followed by Bonferroni’s multiple comparison test. d Representative IF images and quantifications show diurnal changes of 5hmC in uninjured or axotomized DRG neurons (TUJ1+). Note more pronounced 5hmC elevation for PL at ZT12–15 than ZT0–3. n = 9 DRGs (L4–L6) isolated from 3 mice per condition. Median is shown by black line. Two-way ANOVA followed by Bonferroni’s multiple comparison test. e. Schematic model of epigenetic rhythm of Tet3-5hmC in DRG neurons.
Fig. 9
Fig. 9. Time-of-day effect on axon regeneration after conditioning lesion.
a Experimental scheme of neurite outgrowth assay with primary DRG neurons isolated at ZT0–3 or ZT12–15. b Representative IF images and quantification show DRG neurons from ZT12–15 extended longer neurites than those from ZT0–3 at 22 h but not 12 h in vitro. Violin plots of n = 77 neurons, pooled from 3 independent cultures isolated from 3 mice per group. Median shown by black line. Kruskal–Wallis with Dunn’s multiple comparison’s test. c Quantifications show time-of-day effect on neurite outgrowth from DRG neurons isolated from both male and female mice. n = 250 neurons from 3 mice per group. Median shown by black line. Two-way ANOVA followed by Bonferroni’s multiple comparison test. d Representative IF images and quantifications show faster axonal regeneration (SCG10+) at 1 d after sciatic nerve crush injury at ZT12–15 compared to ZT0–3. For regeneration index, Two-way ANOVA. n = 6 mice per group. For maximal axon length, data represent mean ± SEM. Unpaired two-tailed Student’s t-test.
Fig. 10
Fig. 10. Time-of-day impact on conditioning lesion effect for axonal regrowth.
a Experimental scheme to evaluate time-of-day effect on the conditioning effect from PL. Mice were subjected to sciatic nerve lesion (PL) at ZT12–15 or ZT0–3, and DRGs were dissociated at 1 dpi for neurite outgrowth assay. b qRT-PCR shows that Bmal1 downregulation at 1 dpi was more pronounced when the sciatic nerve injury occurred at ZT12–15 than ZT0–3 (uninjured DRG data were also shown in Fig. 8a). Each sample pooled from 3 ipsilateral lumbar DRGs from n = 4 mice per group. Data represent mean ± SEM. Two-way ANOVA followed by Bonferroni’s multiple comparison test. c Representative IF images and quantification of neurite outgrowth of DRG neurons 24 h after plating. A conditioning lesion was performed 1 day prior at either ZT12–15 or ZT0–3. Quantification of 149 neurons collected from n = 4 mice per group. Data represent mean ± SEM. Two-way ANOVA followed by Bonferroni’s multiple comparison test. d Quantification of time-of day effect on neurite outgrowth from Bmal1cKO or control DRG neurons. n = 115–135 DRG neurons for ZT0–3 and n = ~90 for ZT12–15 per group (ZT0–3 for control mice were shown in Fig. 5h). Data represent mean ± SEM. Two-way ANOVA followed by Bonferroni’s multiple comparison test. Quantifications of in vivo axon regrowth show that Bmal1 cKO resulted in enhanced axon regeneration (SCG10+) at 3 dpi for ZT0–3 (e) and ZT12–15 (f) injury groups. Two-way ANOVA. Bar graphs of maximal axon length are shown on right. Data represent mean ± SEM. Unpaired two-tailed Student’s t test. n = 5 mice per genotype. g Working model of how Bmal1 ablation mimics the conditioning lesion in lifting the circadian block, leading to enhanced axon growth capacity, in part through augmented Tet3-5hmC reconfiguration.

References

    1. Ma CH, et al. Accelerating axonal growth promotes motor recovery after peripheral nerve injury in mice. J. Clin. Investig. 2011;121:4332–4347. doi: 10.1172/JCI58675. - DOI - PMC - PubMed
    1. Wahane S, Halawani D, Zhou X, Zou H. Epigenetic regulation of axon regeneration and glial activation in injury responses. Front. Genet. 2019;10:640. doi: 10.3389/fgene.2019.00640. - DOI - PMC - PubMed
    1. Lindborg JA, et al. Molecular and cellular identification of the immune response in peripheral ganglia following nerve injury. J. Neuroinflamm. 2018;15:192. doi: 10.1186/s12974-018-1222-5. - DOI - PMC - PubMed
    1. Niemi JP, et al. A critical role for macrophages near axotomized neuronal cell bodies in stimulating nerve regeneration. J. Neurosci. 2013;33:16236–16248. doi: 10.1523/JNEUROSCI.3319-12.2013. - DOI - PMC - PubMed
    1. Avraham O, et al. Satellite glial cells promote regenerative growth in sensory neurons. Nat. Commun. 2020;11:4891. doi: 10.1038/s41467-020-18642-y. - DOI - PMC - PubMed

Publication types