. 2023 Aug 24;14(1):5170.
doi: 10.1038/s41467-023-40699-8.

Antibody-mediated NK cell activation as a correlate of immunity against influenza infection

Affiliations

Antibody-mediated NK cell activation as a correlate of immunity against influenza infection

Carolyn M Boudreau et al. Nat Commun. .

Abstract

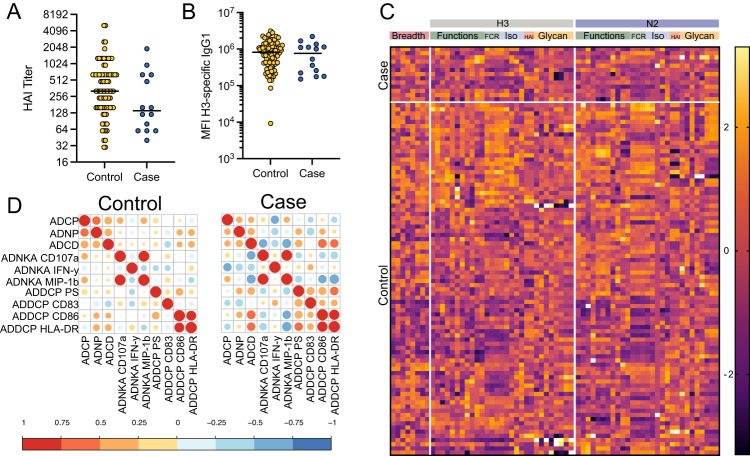
Antibodies play a critical role in protection against influenza; yet titers and viral neutralization represent incomplete correlates of immunity. Instead, the ability of antibodies to leverage the antiviral power of the innate immune system has been implicated in protection from and clearance of influenza infection. Here, post-hoc analysis of the humoral immune response to influenza is comprehensively profiled in a cohort of vaccinated older adults (65 + ) monitored for influenza infection during the 2012/2013 season in the United States (NCT: 01427309). While robust humoral immune responses arose against the vaccine and circulating strains, influenza-specific antibody effector profiles differed in individuals that later became infected with influenza, who are deficient in NK cell activating antibodies to both hemagglutinin and neuraminidase, compared to individuals who remained uninfected. Furthermore, NK cell activation was strongly associated with the NK cell senescence marker CD57, arguing for the need for selective induction of influenza-specific afucosylated NK activating antibodies in older adults to achieve protection. High dose vaccination, currently used for older adults, was insufficient to generate this NK cell-activating humoral response. Next generation vaccines able to selectively bolster NK cell activating antibodies may be required to achieve protection in the setting of progressively senescent NK cells.


Conflict of interest statement

G.A. is a founder and equity holder of Seromyx Systems, a company developing a platform technology that describes the antibody immune response. C.M.B. is an employee and equity holder of Leyden Labs, a company developing pandemic-prevention therapeutics. G.A. is an employee and equity holder in Moderna, a company developing mRNA therapeutics and vaccines. H.K. is an employee and equity holder in SK Biosciences, a vaccine developer. I.D.B., V.L., and S.S. are employees of Sanofi Pasteur, Inc. The remaining authors declare no competing interests.

Figures

Fig. 1
Fig. 1. Protected vaccine recipients show coordinated humoral immune response.
Serum samples, day 28 post vaccination, were analyzed for HAI, influenza-specific antibody levels, and influenza-specific antibody-mediated innate immune functionality. A shows H3N2 A/Victoria/361/2011 HAI titers for controls (n = 86 individuals, yellow) who remained uninfected and cases (n = 14 individuals, blue) who became infected during the season. B shows H3-specific IgG1 levels by Luminex (median fluorescence intensity, MFI) for controls (n = 86) and cases (n = 14), wherein each dot represents the mean of two technical replicates for a single individual. A, B lines show median values and differences are not significant by two-sided Mann–Whitney U test. C Heat map depicts responses across all measured antibody features for cases and controls. Each row represents an individual sample. Each column represents a measured feature for the listed antigen. Breadth features reflect antigen-specific antibody isotype and FcR binding across all tested strains (Table S3). Values for all measurements were Z score normalized with Z score values depicted on the color map. Rows were manually clustered by infection status. ADCP antibody-dependent cellular phagocytosis, ADNP antibody-dependent neutrophil phagocytosis, ADCD antibody-dependent complement deposition, ADNKA antibody-dependent NK cell activation, ADDCP antibody-dependent Dendritic Cell phagocytosis. D Correlation matrices show Spearman R correlations between H3-specific antibody-dependent functions for controls and cases. The size of the circles and the color of the circles represent the strength of the correlation, with red for positive and blue for negative correlations. Source data are provided as a Source Data file.
Fig. 2
Fig. 2. Antibody-dependent NK cell activation is a predictor of protection from influenza infection.
A Partial least squares discriminant analysis separating cases (individuals who became infected; n = 14, blue) from controls (individuals who remained uninfected; n = 86, yellow) using a robust minimal set of antibody features that contribute to the disease outcome (LASSO-Elastic Net). Latent variables (LVs) describe combinations of humoral features, and scores across LVs indicate the percentage of separation described by that axis. Model is significant (p < 0.01) compared to the accuracy of permuted label and random size-matched models (Mann–Whitney U test). B shows scores for individuals across LV1 with bars at median values for each group (cases n = 14; controls n = 86). Each dot represents an individual. Significance tested by two-sided Mann-Whitney U test, ****p < 0.0001. C Variable importance in the projection plot indicates the relative contribution of humoral features to the model depicted in A. ADDCP antibody-dependent Dendritic Cell phagocytosis, ADNKA antibody-dependent NK cell activation. See also Figure S2. Source data are provided as a Source Data file.
Fig. 3
Fig. 3. Antibody Fc glycosylation linked to NK cell activation reflects influenza outcome.
Heat map A shows Spearman R correlations between measures of H3 WT-specific NK cell activation (ADNKA) and FCGR3A binding and H3 WT-specific antibody Fc glycoforms. Dot plot B shows levels of Fc fucosylation of H3 WT-specific antibodies in controls (n = 86, yellow) and cases (n = 14, blue) with lines at median values for each group. Significance tested by two-sided Mann–Whitney U test, ***p = 0.0007. See also Figure S4. Source data are provided as a Source Data file.
Fig. 4
Fig. 4. High-dose vaccination enhances HAI but not antibody-mediated NK cell activation.
A shows H3N2 A/Victoria/361/2011 HAI titers for regular-dose vaccinees and high-dose vaccinees. B shows H3-specific IgG1 levels by Luminex (median fluorescence intensity, MFI) for RD (purple) and HD (green) recipients. A, B Each dot represents the mean of two technical replicates for a single individual. Bars represent medians and significance tested by two-sided Mann–Whitney U test, *p < 0.05. C Heat map depicts responses across all measured antibody features for RD and HD recipients. Each row represents an individual sample. Each column represents a measured feature. Values for all measurements were z score normalized. D shows H3-specific FCGR3A-binding levels for regular and high-dose vaccinees. E shows H3-specific NK cell CD107a expression for regular and high-dose vaccinees. F shows H3-specific NK cell MIP-1b expression for regular and high-dose vaccinees. G shows percentage of H3-specific antibodies that have fucosylated Fc glycans. DG Each dot represents the mean of two technical replicates for a single individual. Bars represent medians and significance tested by Mann–Whitney U test, not significant. AG regular dose vaccinees n = 50; high-dose vaccinees n = 50 individuals. See also Figure S5. Source data are provided as a Source Data file.
Fig. 5
Fig. 5. CD57 as a biomarker for aging NK cells less responsive to FCGR3A-mediated stimulation.
Density plots A show representative gating for NK cells in Fig. 5. NK cells were defined by Size>Single Cells>Live>CDcd3−>CD14−>CD16+CD56+. Bar plots show the percentage of NK cells positive for CD57 (B) and CD16 (C) at baseline condition grouped by age. Dots show individual subjects (<40 n = 10 in blue, >65 n = 19 in red) and bars show mean values for each group. GMFI geometric mean fluorescence intensity. Significance tested by two-sided t test, ***p = 0.0004. Correlation plots show correlations between CD57 and CD107a (D), KIR (E), or NKG2C (F) expression across CD16 stimulation conditions (0–10 μg/ml). Correlation measured by Spearman’s R. ***p = 0.0009, ****p < 0.0001. See also Figure S6. Source data are provided as a Source Data file.

References

    1. Thompson WW, et al. Mortality associated with influenza and respiratory syncytial virus in the United States. JAMA. 2003;289:179–186. - PubMed
    1. Czaja CA, et al. Age-related differences in hospitalization rates, clinical presentation, and outcomes among older adults hospitalized with influenza - U.S. Influenza Hospitalization Surveillance Network (FluSurv-NET) Open Forum Infect. Dis. 2019;6:1–8. - PMC - PubMed
    1. Rondy M, et al. Effectiveness of influenza vaccines in preventing severe influenza illness among adults: a systematic review and meta-analysis of test-negative design case-control studies. J. Infect. 2017;75:381–394. - PMC - PubMed
    1. Centers for Disease Control and Prevention: National Center for Immunization and Respiratory Diseases. Past seasons vaccine effectiveness estimates. Seasonal Influenza (Flu)https://www.cdc.gov/flu/vaccines-work/past-seasons-estimates.html (2020).
    1. Centers for Disease Control and Prevention: National Center For Immunization And Respiratory Diseases. Summary of the 2012-2013 Influenza Season. https://www.cdc.gov/flu/pastseasons/1213season.htm (2019).

Publication types