

Gut microbiota and fecal short chain fatty acids differ with adiposity and country of origin: the METS-microbiome study
- PMID: 37620311
- PMCID: PMC10449869
- DOI: 10.1038/s41467-023-40874-x
Gut microbiota and fecal short chain fatty acids differ with adiposity and country of origin: the METS-microbiome study
Abstract
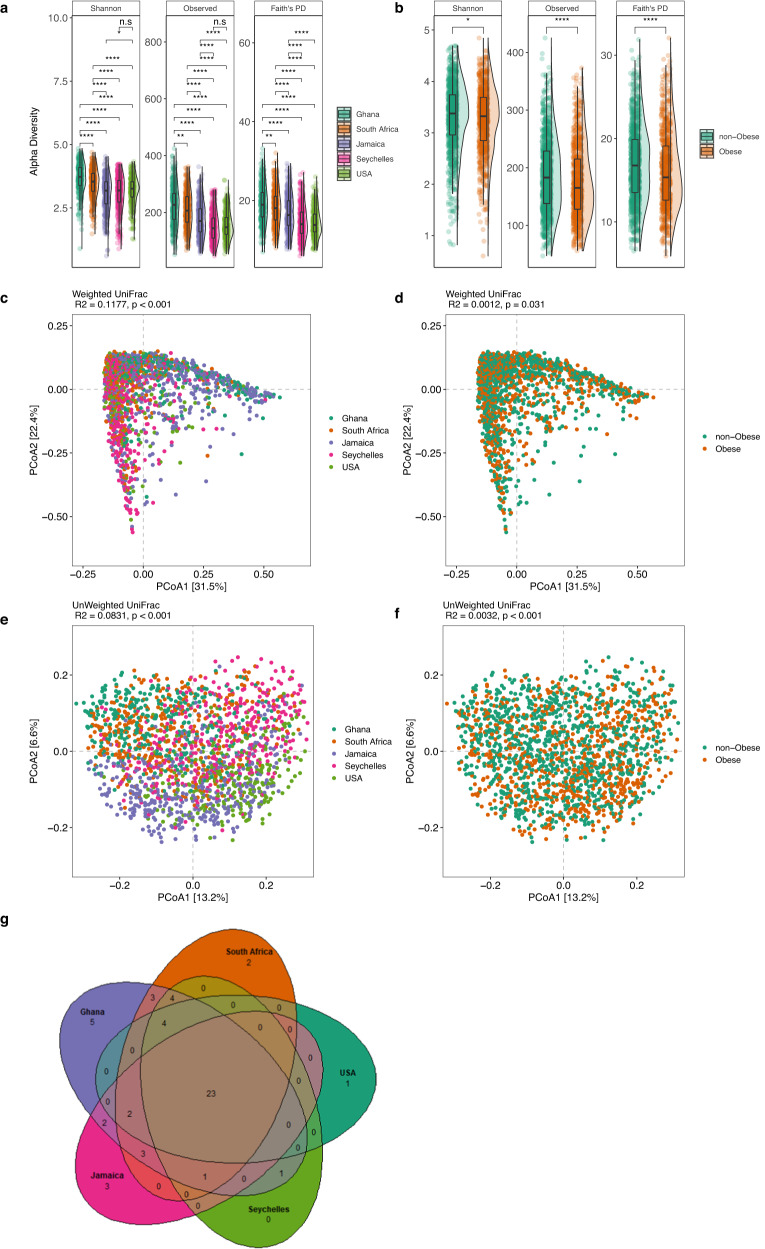
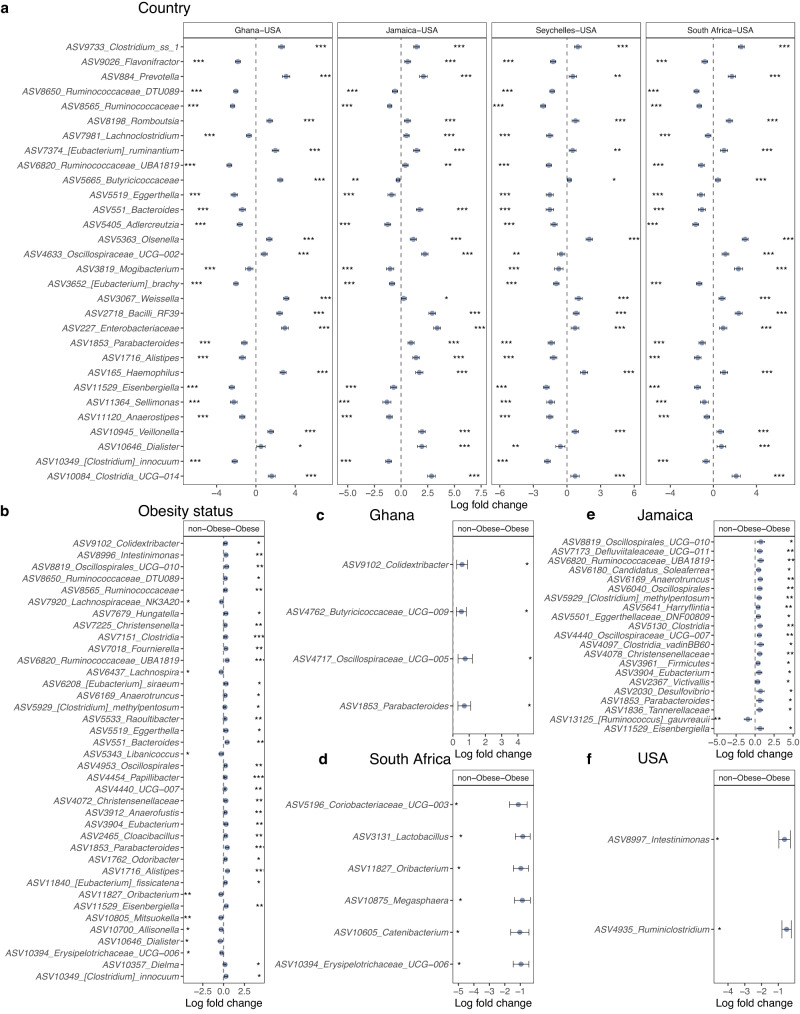
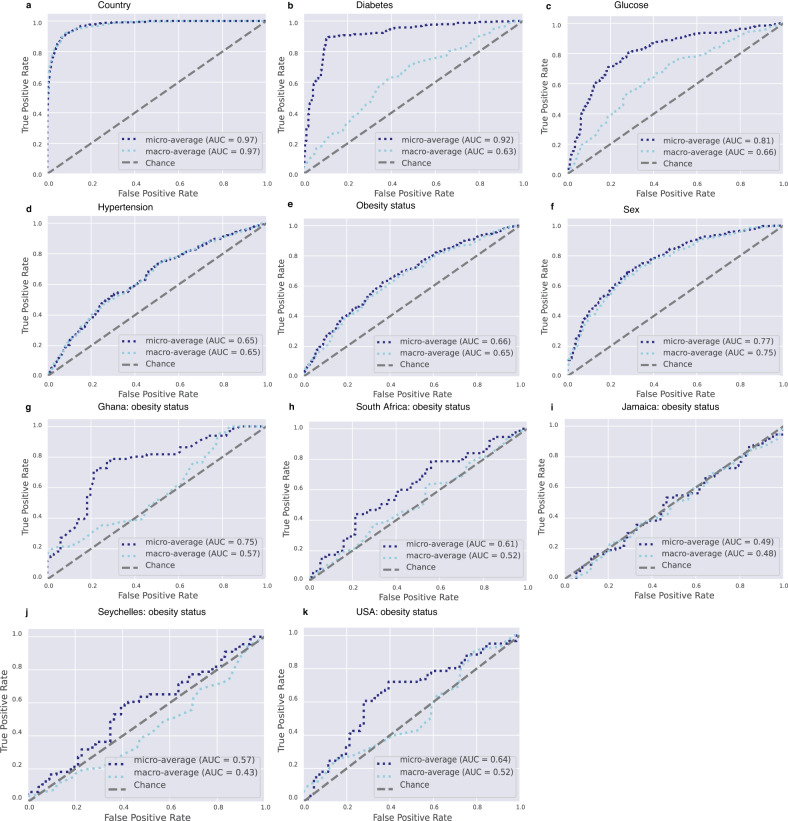
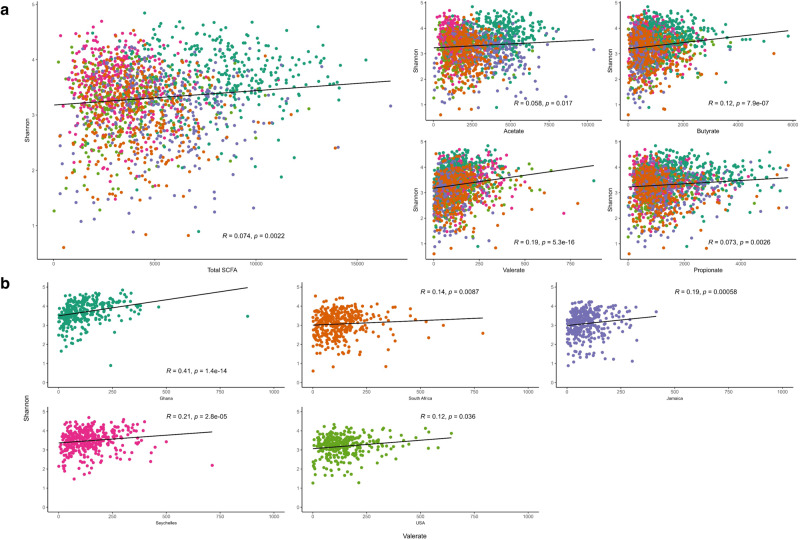
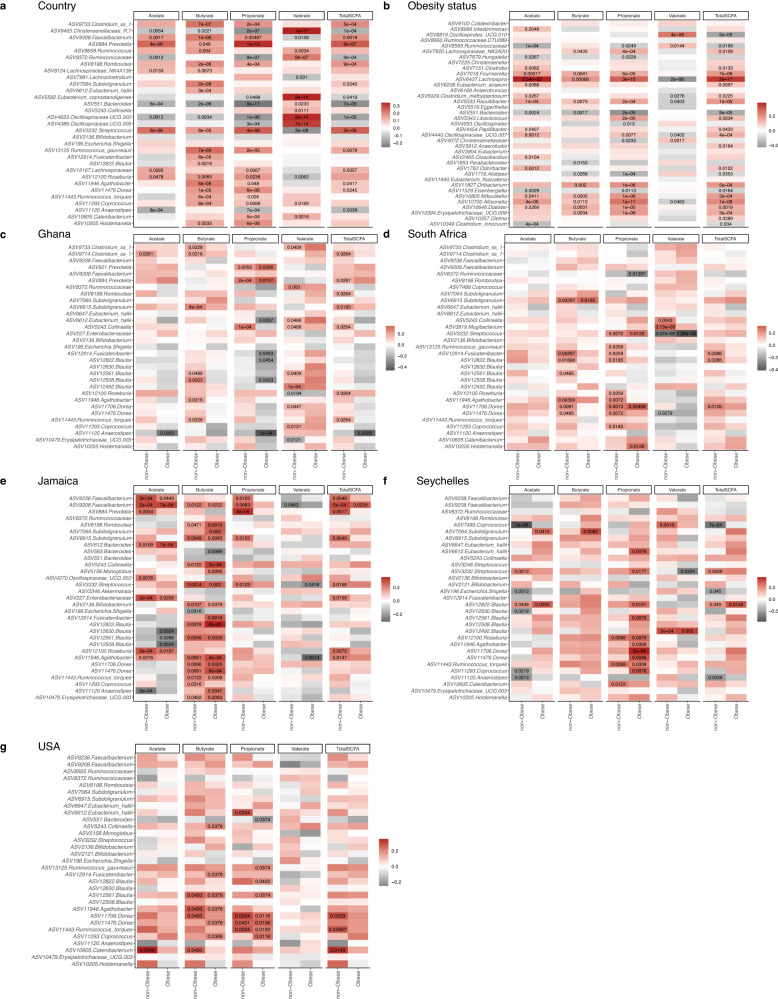
The relationship between microbiota, short chain fatty acids (SCFAs), and obesity remains enigmatic. We employ amplicon sequencing and targeted metabolomics in a large (n = 1904) African origin cohort from Ghana, South Africa, Jamaica, Seychelles, and the US. Microbiota diversity and fecal SCFAs are greatest in Ghanaians, and lowest in Americans, representing each end of the urbanization spectrum. Obesity is significantly associated with a reduction in SCFA concentration, microbial diversity, and SCFA synthesizing bacteria, with country of origin being the strongest explanatory factor. Diabetes, glucose state, hypertension, obesity, and sex can be accurately predicted from the global microbiota, but when analyzed at the level of country, predictive accuracy is only universally maintained for sex. Diabetes, glucose, and hypertension are only predictive in certain low-income countries. Our findings suggest that adiposity-related microbiota differences differ between low-to-middle-income compared to high-income countries. Further investigation is needed to determine the factors driving this association.
© 2023. Springer Nature Limited.
Conflict of interest statement
The authors declare no competing interests.
Figures
Update of
-
Gut microbiota and fecal short chain fatty acids differ with adiposity and country of origin: The METS-Microbiome Study.bioRxiv [Preprint]. 2023 Mar 22:2023.03.21.533195. doi: 10.1101/2023.03.21.533195. bioRxiv. 2023. Update in: Nat Commun. 2023 Aug 24;14(1):5160. doi: 10.1038/s41467-023-40874-x. PMID: 36993742 Free PMC article. Updated. Preprint.
-
Gut microbiota and fecal short chain fatty acids differ with adiposity and country of origin: The METS-Microbiome Study.Res Sq [Preprint]. 2023 Apr 13:rs.3.rs-2791107. doi: 10.21203/rs.3.rs-2791107/v1. Res Sq. 2023. Update in: Nat Commun. 2023 Aug 24;14(1):5160. doi: 10.1038/s41467-023-40874-x. PMID: 37090540 Free PMC article. Updated. Preprint.
Similar articles
-
Gut microbiota and fecal short chain fatty acids differ with adiposity and country of origin: The METS-Microbiome Study.Res Sq [Preprint]. 2023 Apr 13:rs.3.rs-2791107. doi: 10.21203/rs.3.rs-2791107/v1. Res Sq. 2023. Update in: Nat Commun. 2023 Aug 24;14(1):5160. doi: 10.1038/s41467-023-40874-x. PMID: 37090540 Free PMC article. Updated. Preprint.
-
Gut microbiota and fecal short chain fatty acids differ with adiposity and country of origin: The METS-Microbiome Study.bioRxiv [Preprint]. 2023 Mar 22:2023.03.21.533195. doi: 10.1101/2023.03.21.533195. bioRxiv. 2023. Update in: Nat Commun. 2023 Aug 24;14(1):5160. doi: 10.1038/s41467-023-40874-x. PMID: 36993742 Free PMC article. Updated. Preprint.
-
Decreased microbial co-occurrence network stability and SCFA receptor level correlates with obesity in African-origin women.Sci Rep. 2018 Nov 20;8(1):17135. doi: 10.1038/s41598-018-35230-9. Sci Rep. 2018. PMID: 30459320 Free PMC article.
-
Gut Microbiota-Derived Short-Chain Fatty Acids Facilitate Microbiota:Host Cross talk and Modulate Obesity and Hypertension.Curr Hypertens Rep. 2021 Feb 3;23(2):8. doi: 10.1007/s11906-020-01125-2. Curr Hypertens Rep. 2021. PMID: 33537923 Free PMC article. Review.
-
Short-Chain Fatty Acids-A Product of the Microbiome and Its Participation in Two-Way Communication on the Microbiome-Host Mammal Line.Curr Obes Rep. 2023 Jun;12(2):108-126. doi: 10.1007/s13679-023-00503-6. Epub 2023 May 19. Curr Obes Rep. 2023. PMID: 37208544 Free PMC article. Review.
Cited by
-
q2-metnet: QIIME2 package to analyse 16S rRNA data via high-quality metabolic reconstructions of the human gut microbiota.Bioinformatics. 2024 Nov 1;40(11):btae455. doi: 10.1093/bioinformatics/btae455. Bioinformatics. 2024. PMID: 39018187 Free PMC article.
-
Investigation of gut microbiota composition in humans carrying blastocystis subtypes 1 and 2 and Entamoeba hartmanni.Gut Pathog. 2024 Nov 29;16(1):72. doi: 10.1186/s13099-024-00661-5. Gut Pathog. 2024. PMID: 39614306 Free PMC article.
-
Fecal Short-Chain Fatty Acids Are Associated with Obesity in Gestational Diabetes.Biomedicines. 2025 Feb 6;13(2):387. doi: 10.3390/biomedicines13020387. Biomedicines. 2025. PMID: 40002799 Free PMC article.
-
Probiotic Supplementation Improves Gut Microbiota in Chronic Metabolic and Cardio-Cerebrovascular Diseases Among Chinese Adults over 60: Study Using Cross-Sectional and Longitudinal Cohorts.Microorganisms. 2025 Jun 27;13(7):1507. doi: 10.3390/microorganisms13071507. Microorganisms. 2025. PMID: 40732015 Free PMC article.
-
Identification of Gut Microbiota Profile Associated with Colorectal Cancer in Saudi Population.Cancers (Basel). 2023 Oct 17;15(20):5019. doi: 10.3390/cancers15205019. Cancers (Basel). 2023. PMID: 37894386 Free PMC article.
References
-
- Obesity and overweight. https://www.who.int/news-room/fact-sheets/detail/obesity-and-overweight.
-
- Hales, C. M., Carroll, M. D., Fryar, C. D. & Ogden, C. L. Prevalence of obesity and severe obesity among adults: United States, 2017-2018. NCHS Data Brief360 1–8 (2020). - PubMed
-
- Tseng C-H, Wu C-Y. The gut microbiome in obesity. J. Formos. Med. Assoc. 2019;118:S3–S9. - PubMed
