. 2023 Aug 24;14(1):5154.
doi: 10.1038/s41467-023-40745-5.

Acquired resistance to anti-PD1 therapy in patients with NSCLC associates with immunosuppressive T cell phenotype

Affiliations

Acquired resistance to anti-PD1 therapy in patients with NSCLC associates with immunosuppressive T cell phenotype

Stefanie Hiltbrunner et al. Nat Commun. .

Abstract

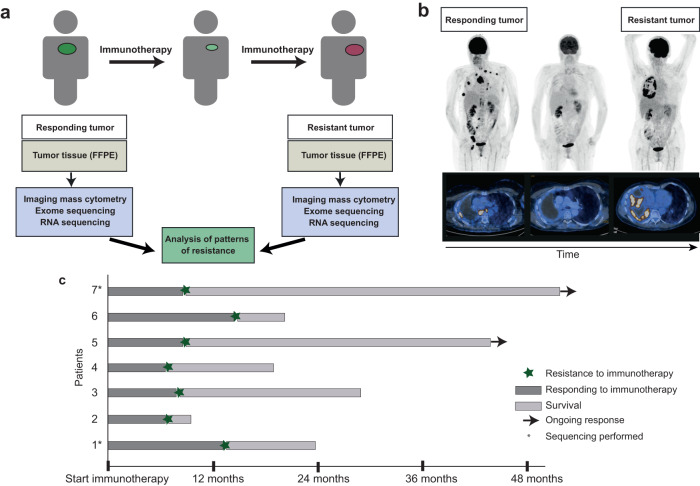
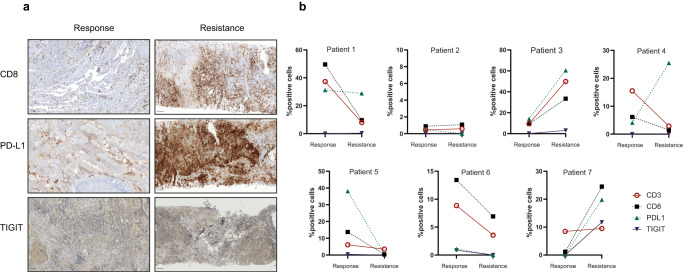
Immune checkpoint inhibitor treatment has the potential to prolong survival in non-small cell lung cancer (NSCLC), however, some of the patients develop resistance following initial response. Here, we analyze the immune phenotype of matching tumor samples from a cohort of NSCLC patients showing good initial response to immune checkpoint inhibitors, followed by acquired resistance at later time points. By using imaging mass cytometry and whole exome and RNA sequencing, we detect two patterns of resistance¨: One group of patients is characterized by reduced numbers of tumor-infiltrating CD8+ T cells and reduced expression of PD-L1 after development of resistance, whereas the other group shows high CD8+ T cell infiltration and high expression of PD-L1 in addition to markedly elevated expression of other immune-inhibitory molecules. In two cases, we detect downregulation of type I and II IFN pathways following progression to resistance, which could lead to an impaired anti-tumor immune response. This study thus captures the development of immune checkpoint inhibitor resistance as it progresses and deepens our mechanistic understanding of immunotherapy response in NSCLC.


Conflict of interest statement

The authors declare no competing interests.

Figures

Fig. 1
Fig. 1. Schematic overview on the cohort of NSCLC patients with acquired resistance to anti-PD-1 therapy.
a Study scheme involved analysis of tumor biopsies collected before immunotherapy began and after the development of resistance. Whole exome sequencing, RNA sequencing, and imaging mass cytometry analyzes were performed on paraffin-embedded tumors. b FDG-PET-CT images of patient #4 before treatment with anti-PD1 (responding tumor), a response, and after development of resistance. c Swimmer’s plot illustrating the cohort of the patients included in the study and the length of anti-PD-1 treatment and development of resistance over the course of the disease.
Fig. 2
Fig. 2. Downregulation of immune signature and upregulation of extracellular matrix reorganization occurs upon resistance development.
Heat map of RNA sequencing data showing up- and down-regulated pathways from two patients at response and resistance. The figure is showing gene set enrichment scores according to ref. .
Fig. 3
Fig. 3. The immune landscape changes at the time of resistance.
Overview of different cell types in the tumor detected by IMC analysis at the response and at resistance as shown by a total numbers and b percentages of indicated cell types. T cells are defined as CD3+ cells, myeloid cells as CD11b+ cells, tumor cells as pan cytokeratin+ cells, endothelial cells as CD31+ cells, and fibroblasts as SMA+ cells.
Fig. 4
Fig. 4. The intratumoral T cell phenotypes are altered upon resistance development.
a Heat map of T cell marker expression (y-axis) and phenotypic clusters (x-axis) were calculated from IMC raw data. Marker expressions were calculated using the mean intensities for each marker, counts were arcsinh transformed and the clusters were defined using PhenoGraph. The top color bar defines different T cell subsets present in the tumors. b Cluster compositions of tumor samples taken from each patient initially and upon resistance development. c Percentages of each T cell subtype in tumor samples taken from each patient initially and upon resistance development. d t-distributed stochastic neighbor embedding (t-SNE) map of all T cells color-coded by each patient. e t-SNE plot overall T cells color-coded by the different T cell subtype defined in the heat map. f t-SNE plot color-coded by responding and resistant tumors.
Fig. 5
Fig. 5. Changes in the myeloid compartment due to resistance detected by IMC differ in each patient.
a Heat map of myeloid cell marker expression (y-axis) and phenotypic clusters (x-axis) were calculated from IMC raw data. Marker expressions were calculated using the mean intensities for each marker, counts were arcsinh transformed and the clusters were defined using PhenoGraph. The top color bar defines different myeloid cell subsets present in the tumors. b Percentages of cells from each patient in indicated clusters at response and at resistance. c Percentages of macrophages in M1 (defined as CD169+, HLA-DR+, STING+, and CD38+ myeloid cells) and M2 states (define as CD163+, CD204+, and CD206+ myeloid cells) at response and resistance for each patient. d t-SNE plot of all macrophages color-coded by patient origin. e t-SNE plot color-coded by M1 and M2 macrophage types. f t-SNE plot of macrophages color-coded by responding and resistant tumors.
Fig. 6
Fig. 6. Immunohistochemical analysis reveal two patterns of T cell infiltration during resistance.
a Representative immunohistochemistry analyzes of immune markers on tumors collected at response and resistance. Scale bar indicates 100 µm. b Percentage positivity of specific markers in responsive and resistant tumor samples calculated using QuPath software (one tumor sample per patient was stained for each marker at each time point).

References

    1. Siegel RL, Miller KD, Jemal A. Cancer Statistics, 2017. CA Cancer J. Clin. 2017;67:7–30. - PubMed
    1. Gettinger S, et al. Five-year follow-up of nivolumab in previously treated advanced non-small-cell lung cancer: results from the ca209-003 study. J. Clin. Oncol. 2018;36:1675–1684. - PubMed
    1. Le DT, et al. Mismatch repair deficiency predicts response of solid tumors to PD-1 blockade. Science. 2017;357:409–413. - PMC - PubMed
    1. Barber DL, et al. Restoring function in exhausted CD8 T cells during chronic viral infection. Nature. 2006;439:682–687. - PubMed
    1. Ahmadzadeh M, et al. Tumor antigen-specific CD8 T cells infiltrating the tumor express high levels of PD-1 and are functionally impaired. Blood. 2009;114:1537–1544. - PMC - PubMed

Publication types

MeSH terms