

Analysis of subcellular RNA fractions demonstrates significant genetic regulation of gene expression in human brain post-transcriptionally
- PMID: 37620324
- PMCID: PMC10449874
- DOI: 10.1038/s41598-023-40324-0
Analysis of subcellular RNA fractions demonstrates significant genetic regulation of gene expression in human brain post-transcriptionally
Abstract
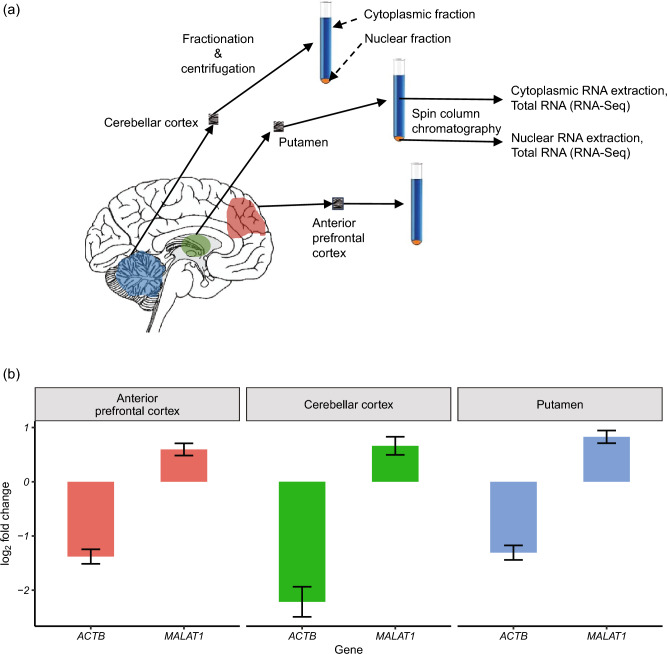
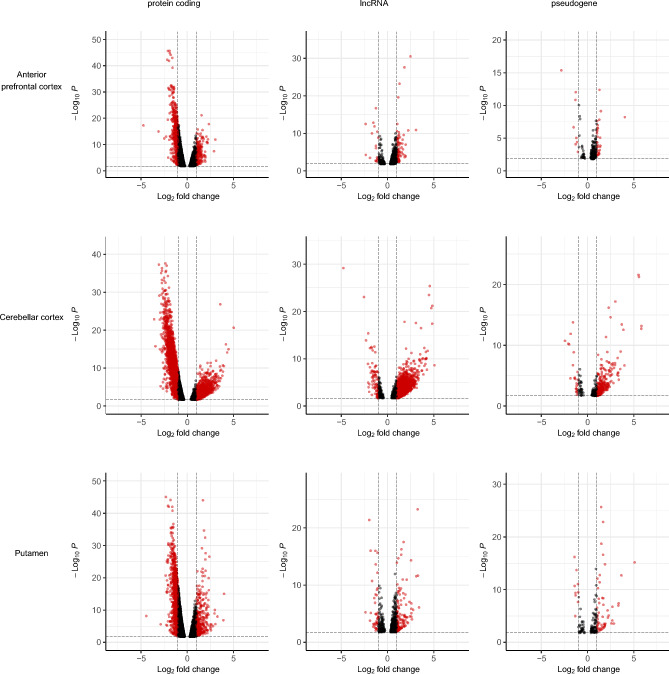
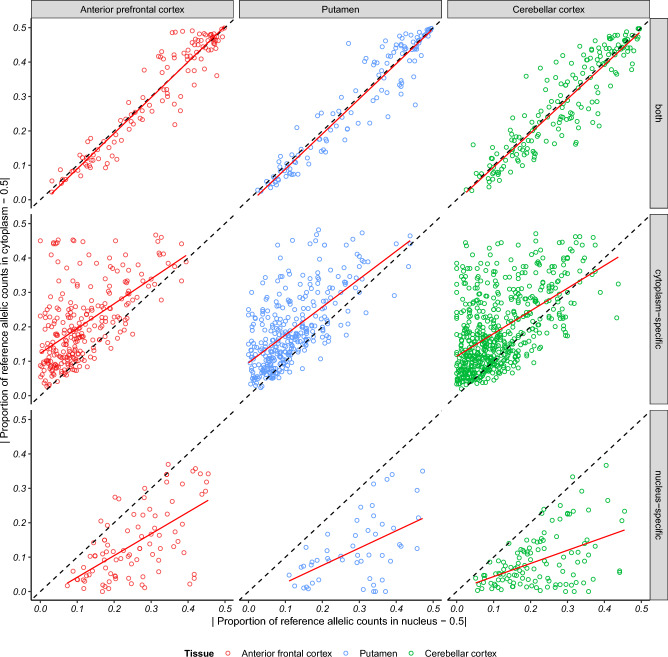
Gaining insight into the genetic regulation of gene expression in human brain is key to the interpretation of genome-wide association studies for major neurological and neuropsychiatric diseases. Expression quantitative trait loci (eQTL) analyses have largely been used to achieve this, providing valuable insights into the genetic regulation of steady-state RNA in human brain, but not distinguishing between molecular processes regulating transcription and stability. RNA quantification within cellular fractions can disentangle these processes in cell types and tissues which are challenging to model in vitro. We investigated the underlying molecular processes driving the genetic regulation of gene expression specific to a cellular fraction using allele-specific expression (ASE). Applying ASE analysis to genomic and transcriptomic data from paired nuclear and cytoplasmic fractions of anterior prefrontal cortex, cerebellar cortex and putamen tissues from 4 post-mortem neuropathologically-confirmed control human brains, we demonstrate that a significant proportion of genetic regulation of gene expression occurs post-transcriptionally in the cytoplasm, with genes undergoing this form of regulation more likely to be synaptic. These findings have implications for understanding the structure of gene expression regulation in human brain, and importantly the interpretation of rapidly growing single-nucleus brain RNA-sequencing and eQTL datasets, where cytoplasm-specific regulatory events could be missed.
© 2023. Springer Nature Limited.
Conflict of interest statement
Author M.E.W. is an employee of Genomics plc, a genomics based healthcare company. His involvement in the conduct of this research was solely in his former capacity as a Reader in Statistical Genetics at King’s College London. Author S.G. is an employee of Verge Genomics, a genomics based healthcare company. His involvement in the conduct of this research was solely in his former capacity as a post doctoral researcher at University College London. The remaining authors declare no competing interests.
Figures
References
-
- Bigdeli TB, Fanous AH, Li Y, Rajeevan N, Sayward F, Genovese G, Gupta R, Radhakrishnan K, Malhotra AK, Sun N, et al. Genome-wide association studies of schizophrenia and bipolar disorder in a diverse cohort of US veterans. Schizophr. Bull. 2021;47:517–529. doi: 10.1093/schbul/sbaa133. - DOI - PMC - PubMed
Publication types
MeSH terms
Substances
Grants and funding
LinkOut - more resources
Full Text Sources
