. 2023 Aug 24;14(1):5172.
doi: 10.1038/s41467-023-40977-5.

Diurnal rhythms of wrist temperature are associated with future disease risk in the UK Biobank

Affiliations

Diurnal rhythms of wrist temperature are associated with future disease risk in the UK Biobank

Thomas G Brooks et al. Nat Commun. .

Abstract

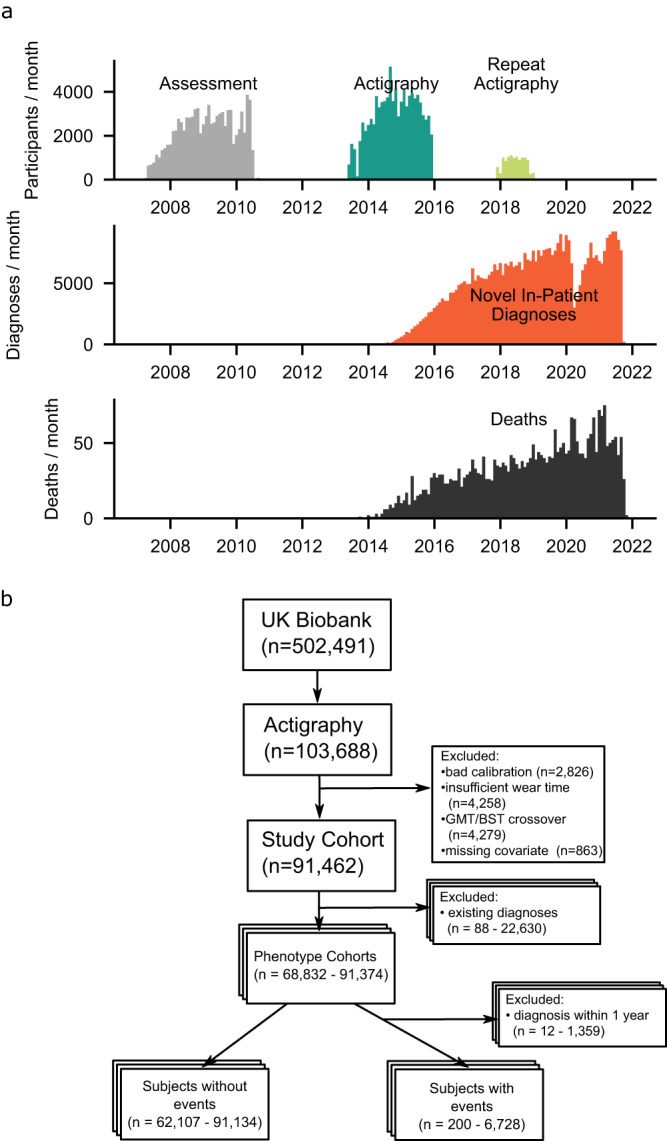
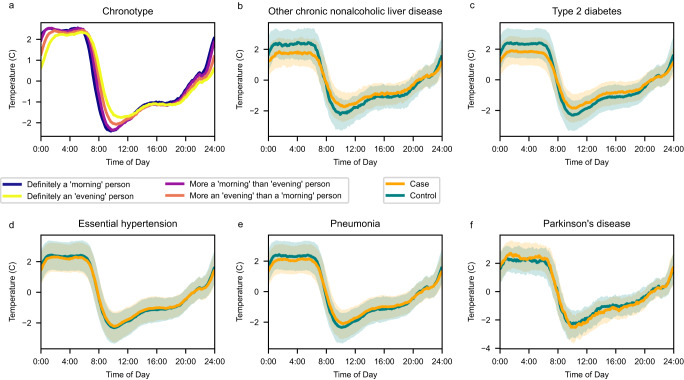
Many chronic disease symptomatologies involve desynchronized sleep-wake cycles, indicative of disrupted biorhythms. This can be interrogated using body temperature rhythms, which have circadian as well as sleep-wake behavior/environmental evoked components. Here, we investigated the association of wrist temperature amplitudes with a future onset of disease in the UK Biobank one year after actigraphy. Among 425 disease conditions (range n = 200-6728) compared to controls (range n = 62,107-91,134), a total of 73 (17%) disease phenotypes were significantly associated with decreased amplitudes of wrist temperature (Benjamini-Hochberg FDR q < 0.05) and 26 (6.1%) PheCODEs passed a more stringent significance level (Bonferroni-correction α < 0.05). A two-standard deviation (1.8° Celsius) lower wrist temperature amplitude corresponded to hazard ratios of 1.91 (1.58-2.31 95% CI) for NAFLD, 1.69 (1.53-1.88) for type 2 diabetes, 1.25 (1.14-1.37) for renal failure, 1.23 (1.17-1.3) for hypertension, and 1.22 (1.11-1.33) for pneumonia (phenome-wide atlas available at http://bioinf.itmat.upenn.edu/biorhythm_atlas/ ). This work suggests peripheral thermoregulation as a digital biomarker.


Conflict of interest statement

G.A.F. is an advisor to Calico Laboratories. T.G.B. received funding from Calico Laboratories. C.S. is an advisor to Antibe Therapeutics Inc and received funding from Calico Laboratories. The authors declare no other competing interests.

Figures

Fig. 1
Fig. 1. Study design.
The UK Biobank actigraphy study yielded 91,462 individuals with high-quality actigraphy health measurements and complete covariate data. A total of 451,994 distinct patient-diagnoses (4.9 per participant) and 3061 deaths (3.3%) were recorded among these participants as per data downloaded on February 23, 2022. a Timeline of data collection by year. Participants had a mean of 5.7 years between covariate assessment and actigraphy collection and a mean of 5.9 years of follow-up starting one year after actigraphy. b Flow diagram of participants. For each phenotype, subjects were excluded from analysis if they had prior diagnosis of the PheCODE or of any of the PheCODEs defined as exclusion criteria by the PheCODE map. Diagnoses within one year of actigraphy were also excluded, due to the likelihood of disease onset occurring before diagnosis. Source data are provided as a Source Data file.
Fig. 2
Fig. 2. Wrist temperature traces.
Wrist temperature traces by (a) chronotype (morningness/eveningness), and by case-status in pairs matched by age and sex for (b) NAFLD, (c) type 2 diabetes, (d) hypertension, (e) pneumonia, and (f) Parkinson’s disease. Please note that the temperature curve for Parkinson’s disease in Panel (f) separates from the controls but with opposite directionality compared to the disease conditions displayed in panels (b–e). In plots with just two groups (bf), the interquartile range (25th to 75th percentiles) of the population are displayed in shaded regions (controls in blue, cases in yellow and overlap in grayish green). Wrist temperature is normalized so that each individual’s daily median is 0. Source data are provided as a Source Data file.
Fig. 3
Fig. 3. Diurnal Rhythmicity Associate with Diagnoses.
To test whether diurnal rhythmicity associate with future disease, a Cox proportional hazards model was performed for each phenotype (PheCODE), using the two-sided Wald test for effects from the wrist temperature amplitude. Individuals with diagnoses prior to the actigraphy measurement were excluded as well as those with a new diagnosis code within the first year following actigraphy. a Manhattan plot-style display of phenome-wide results. In many phenotypes, weaker wrist temperature rhythms are associated with future onset of disease. Uncorrected p-values are plotted along with the solid line showing Bonferroni-correction significance threshold for α ≤ 0.05 and the dashed line showing the Benjamini-Hochberg false discovery rate (FDR) at 0.05 cutoff. Phenotypes range from n = 200 events (diagnoses) to n = 6728 events (exact n values in Supplementary Data 1). b A selection of significant phenotypes shown in detail. Left: significance of the overall effect size (irrespective of age and sex). Right: three panels, effect sizes of the overall model, by sex model, and by-age model. Effect sizes were measured as the hazard ratio (HR) per 1 °C decrease in the wrist temperature amplitude. Circles denote the point estimate of HR and lines denote their 95% CI. Number of events (first diagnoses) n for each phenotype are shown on the far right. Extrapyramidal disease and Parkinson’s disease had insufficient cases to run by age and sex. Anxiety disorders and Parkinson’s disease are slightly above the q < 0.05 threshold, at q = 0.20 and 0.11, respectively. No phenotypes displayed significant differences by sex or by age after correction for multiple testing (q ≥ 0.48 for all phenotypes). Source data are provided as a Source Data file.
Fig. 4
Fig. 4. Temperature biorhythm atlas guide.
We have made the results of this study easily explorable on a web-based atlas (http://bioinf.itmat.upenn.edu/biorhythm_atlas/). Users select a phenotype (PheCODE) of interest from a drop-down list. Then, they are presented with results pertaining to that phenotype. First, average traces by time-of-day are shown for matched case/control pairs, as in Fig. 2. Next, effect sizes and statistical significance in a tabular format, broken down by sex and age (for phenotypes with sufficient case counts in each category). Then a plot of distributions of wrist temperature amplitudes in both the cases and controls, along with a plot of the risk of the disease stratified by temperature amplitude rhythms. Non-constant risk rates indicate an association of rhythm with disease. Lastly, details about the definition of cases and controls for the phenotype are given, including the specific ICD-10 codes (with case counts) used to identify cases, as well as the exclusion criterion. These allow investigators interested in a single phenotype to quickly assess it for connections to diurnal rhythm disruption.

Update of

References

    1. Benefits of Physical Activity. Centers for Disease Control and Prevention, https://www.cdc.gov/physicalactivity/basics/pa-health/index.htm (2022).
    1. Basics About Sleep. Centers for Disease Control and Prevention, https://www.cdc.gov/sleep/about_sleep/index.html (2022).
    1. Barker J, et al. Physical activity of UK adults with chronic disease: cross-sectional analysis of accelerometer-measured physical activity in 96 706 UK Biobank participants. Int. J. Epidemiol. 2019;48:1167–1174. - PMC - PubMed
    1. Strain T, et al. Wearable-device-measured physical activity and future health risk. Nat. Med. 2020;26:1385–1391. - PMC - PubMed
    1. (No authors listed) Fitbit step counts clarify the association between activity and chronic disease risk. Nat. Med.28, 2263–2264 (2022). - PubMed

Publication types