. 2023 Aug 24;14(1):5151.
doi: 10.1038/s41467-023-40483-8.

Structural basis of peptidoglycan synthesis by E. coli RodA-PBP2 complex

Affiliations

Structural basis of peptidoglycan synthesis by E. coli RodA-PBP2 complex

Rie Nygaard et al. Nat Commun. .

Abstract

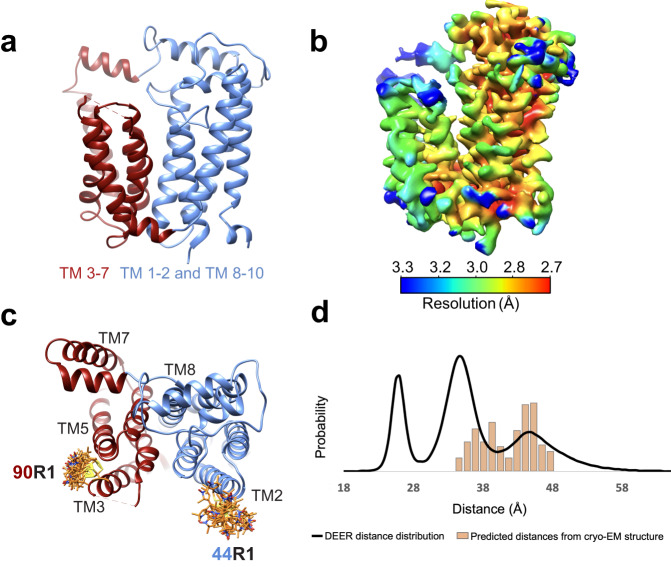
Peptidoglycan (PG) is an essential structural component of the bacterial cell wall that is synthetized during cell division and elongation. PG forms an extracellular polymer crucial for cellular viability, the synthesis of which is the target of many antibiotics. PG assembly requires a glycosyltransferase (GT) to generate a glycan polymer using a Lipid II substrate, which is then crosslinked to the existing PG via a transpeptidase (TP) reaction. A Shape, Elongation, Division and Sporulation (SEDS) GT enzyme and a Class B Penicillin Binding Protein (PBP) form the core of the multi-protein complex required for PG assembly. Here we used single particle cryo-electron microscopy to determine the structure of a cell elongation-specific E. coli RodA-PBP2 complex. We combine this information with biochemical, genetic, spectroscopic, and computational analyses to identify the Lipid II binding sites and propose a mechanism for Lipid II polymerization. Our data suggest a hypothesis for the movement of the glycan strand from the Lipid II polymerization site of RodA towards the TP site of PBP2, functionally linking these two central enzymatic activities required for cell wall peptidoglycan biosynthesis.


Conflict of interest statement

The authors declare no competing interest.

Figures

Fig. 1
Fig. 1. Mechanism and overall structure of RodA-PBP2 complex.
a Above, schematic representation of the reaction catalyzed by RodA (green) and PBP2 (blue). Below, the chemical representation of peptidoglycan synthesis with Lipid II building blocks and chemical components of Lipid II are shown in a box on the top left. b Cryo-EM density map of the RodA-PBP2 complex. Density corresponding to RodA and PBP2 is shown in green and blue, respectively. c Structure of the RodA-PBP2 complex shown as a ribbon with RodA in green and PBP2 in blue. Approximate membrane boundaries are represented as dotted lines. d Schematic diagram showing the topology of RodA colored in rainbow from C (blue) to N terminus (red), consisting of ten TM helices and a well-ordered periplasmic region between TM helix 7 and 8. e Structure of RodA shown rotated 90°, with the ten TM helices colored as in e. Approximate membrane boundaries are again shown as dotted lines.
Fig. 2
Fig. 2. Lipid II binding cavities.
a Cavity analysis of the RodA-PBP2 structure with RodA-PBP2 shown as surface colored by conservation on a green (no conservation) to purple (absolute conservation) scale. The cavities are shown as a semi-transparent surface in orange. Volumes were calculated using the Voss Volume Voxelator (3 V) server using probes with 10 and 2 Å radii, corresponding to the outer and inner probe, respectively. b Structure of the transmembrane region of RodA-PBP2 shown as a ribbon with residues of interest shown as sticks, and the cavities shown as in a. Cut-outs from Weblogo plots, as in Supplementary Fig. 6, shown for regions of interest. c Density plot of Lipid II from 50 repeats of 10 μs in unbiased CG MD simulations of the RodA-PBP2 complex. The plot shows two preferred binding sites of Lipid II overlapping with cavity A and cavity B. d Comparison of (left) lipid-like density observed in cavity A in the cryo-EM map (only the region of the map corresponding to the lipid like density is shown) with (right) average density of Und-PP from unbiased atomistic MD simulation of RodA-PBP2 with Und-PP initially docked into cavity A. e Functional analysis of RodA-PBP2 GT activity using in vitro Lipid II polymerization assay where the effect of different residues was studied by introducing point mutations and testing for activity. Source data are provided as a Source Data file.
Fig. 3
Fig. 3. Dynamics within the RodA.
a RodA shown as ribbon colored by domain with TM helices 3-7 red and TM helices 1-2 and TM helices 8-10 blue. b Local resolution of the transmembrane region of the RodA-PBP2 complex from the final local resolution refinement with a mask around the transmembrane part of the complex. It is apparent that the domain consisting of TM helices 3-7 overall has lower local resolution. c Sterically allowed rotamers of nitroxide spin labels (R1) are illustrated for Gly44R1/Asp90R1 on the cryo-EM structure (orange sidechains). d Resulting DEER distance distributions (solid black line) are compared to predicted distance distributions (bars) based on the sterically allowed rotamers shown in the structures (colored as sidechains).
Fig. 4
Fig. 4. Mechanism of Lipid II transglycosylation.
a RodA active site with RodA shown as green ribbon and PBP2 shown as blue ribbon, residues of interest represented as sticks. Cut-out from Weblogo plot, as in Supplementary Fig. 6, shown for residues of interest, residues are represented as sticks. Cryo-EM density in cavity A proposed to correspond to Und-PP displayed as a yellow surface. b Functional analysis of RodA-PBP2 GT activity using in vitro Lipid II polymerization assay, monitoring the effect of different mutations on selected residues. Source data are provided as a Source Data file. c Schematic representation of the mechanistic model for the GT reaction between two Lipid II molecules by RodA viewed from the periplasmic side of the membrane. The active site Asp262 is highlighted in green.
Fig. 5
Fig. 5. Dynamics within the RodA-PBP2 complex.
a The two extreme conformations of PBP2 from the cryo-EM 3D variability analysis. b RodA-PBP2 shown as ribbon colored by RMSF over 3 MD simulations of 1 μs aligned to the RodA backbone, with the ribbon increasing in thickness with greater RMSF. c Sterically allowed rotamers of nitroxide spin labels (R1) are illustrated for Gly44R1/Gln99R1 on the cryo-EM structure (left; orange sidechains) and a structure from an MD simulation (right; yellow sidechains). d Resulting DEER distance distributions (solid black line) are compared to predicted distance distributions (bars) based on the sterically allowed rotamers shown in the structures (colored as sidechains).
Fig. 6
Fig. 6. Elongation of the glycan strand.
Modelling of the different steps that occur during elongation of the glycan strand. Starting from the left RodA-PBP2 is shown in complex with two Lipid II molecules. Once these two molecules are connected through the GT activity of RodA, Und-PP is released from cavity A either between TM helix 7 and the core of RodA, or under the JM helices into the membrane. We have modelled RodA-PBP2 bound sequentially to Lipid II, Lipid IV, up to Lipid XXII, and here we show different complexes during the elongation until the glycan chain reaches the active site of PBP2. RodA-PBP2 is shown as surface representation in grey. The previously suggested opening and closing of the head and anchor domain of PBP2 upon binding of the regulator protein MreC is not modelled here,,,. The Und-PP lipid is represented in black sticks and the disaccharides with the pentapeptide stem attached as sticks in different colors.

References

    1. Typas A, Banzhaf M, Gross CA, Vollmer W. From the regulation of peptidoglycan synthesis to bacterial growth and morphology. Nat. Rev. Microbiol. 2011;10:123–136. - PMC - PubMed
    1. Skalweit MJ, Li M. Bulgecin A as a β-lactam enhancer for carbapenem-resistant Pseudomonas aeruginosa and carbapenem-resistant Acinetobacter baumannii clinical isolates containing various resistance mechanisms. Drug Des. Dev. Ther. 2016;10:3013–3020. - PMC - PubMed
    1. Page JE, Walker S. Natural products that target the cell envelope. Curr. Opin. Microbiol. 2021;61:16–24. - PMC - PubMed
    1. Novak R, Charpentier E, Braun JS, Tuomanen E. Signal Transduction by a Death Signal Peptide: Uncovering the Mechanism of Bacterial Killing by Penicillin. Mol. Cell. 2000;5:49–57. - PubMed
    1. Zgurskaya HI, López CA, Gnanakaran S. Permeability Barrier of Gram-Negative Cell Envelopes and Approaches To Bypass It. ACS Infect. Dis. 2015;1:512–522. - PMC - PubMed

Publication types