. 2023 Aug 24;14(1):5147.
doi: 10.1038/s41467-023-40924-4.

RNAPII-dependent ATM signaling at collisions with replication forks

Affiliations

RNAPII-dependent ATM signaling at collisions with replication forks

Elias Einig et al. Nat Commun. .

Abstract

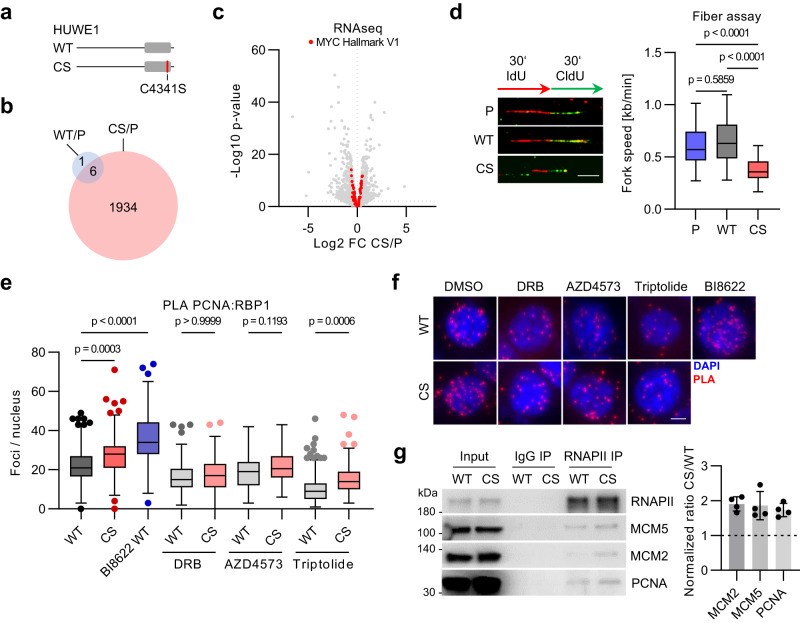
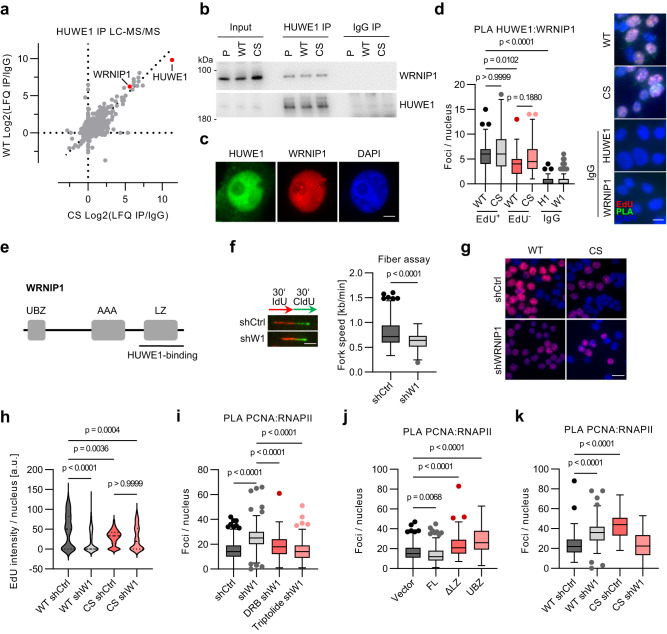
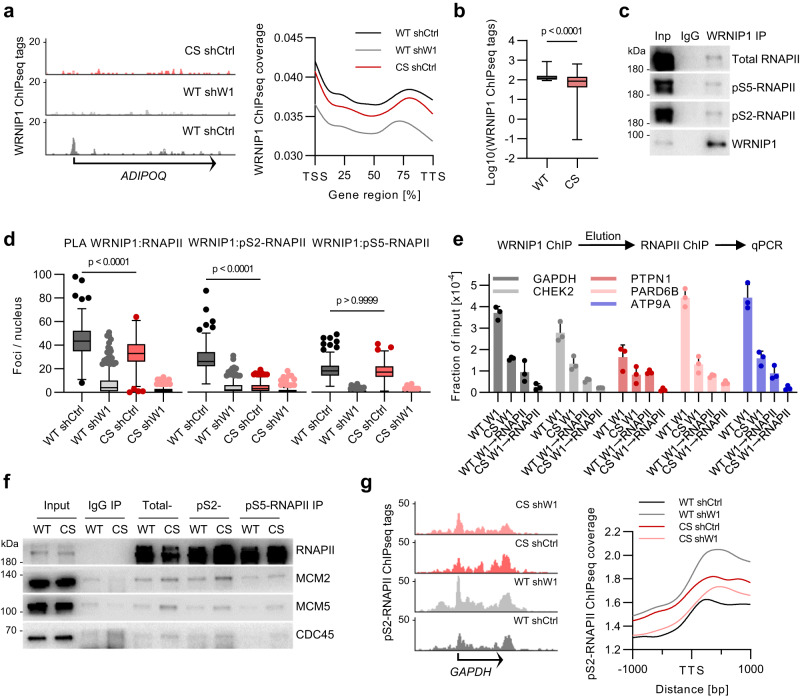
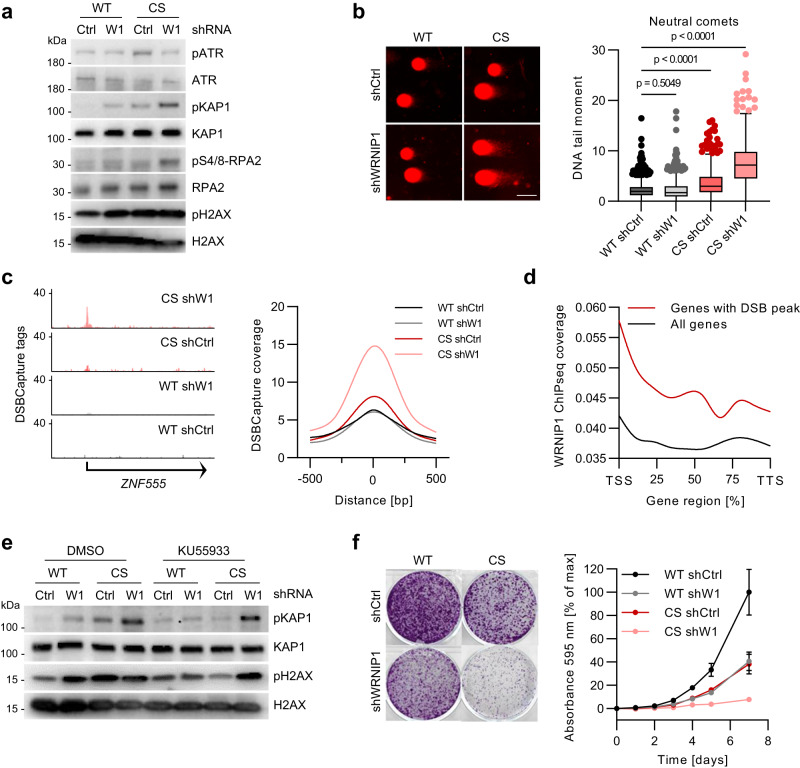
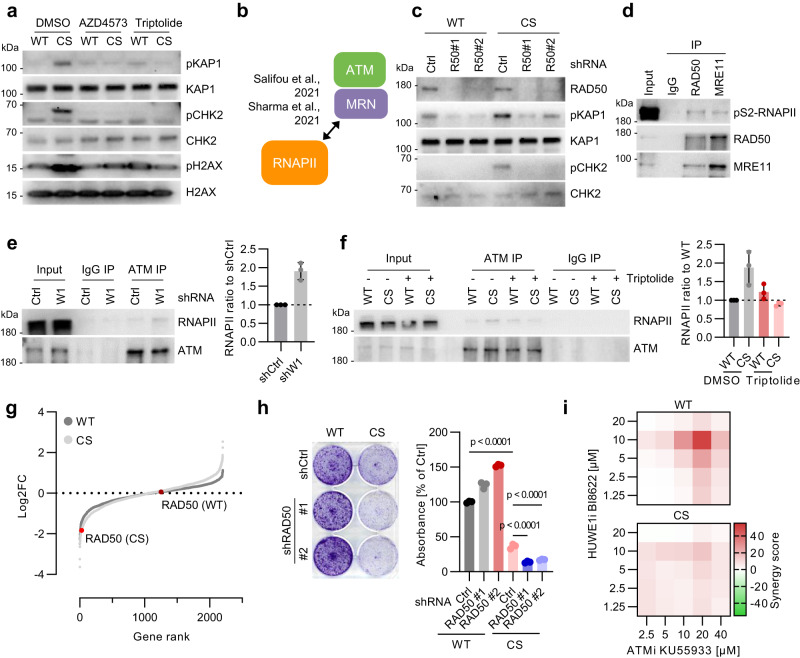
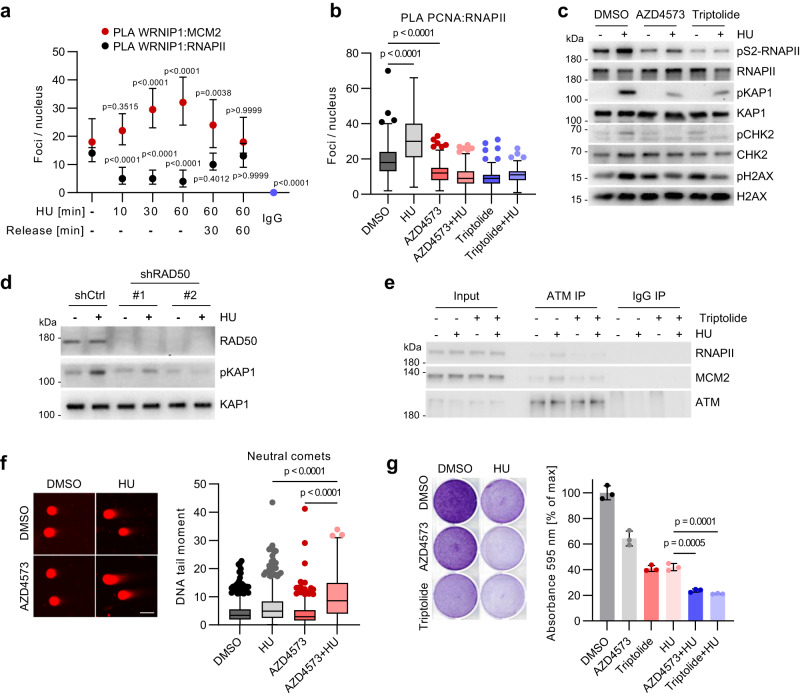
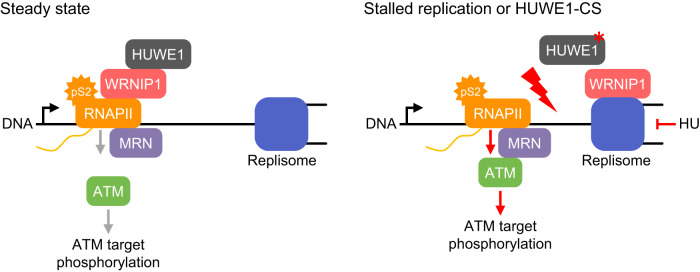
Deregulation of RNA Polymerase II (RNAPII) by oncogenic signaling leads to collisions of RNAPII with DNA synthesis machinery (transcription-replication conflicts, TRCs). TRCs can result in DNA damage and are thought to underlie genomic instability in tumor cells. Here we provide evidence that elongating RNAPII nucleates activation of the ATM kinase at TRCs to stimulate DNA repair. We show the ATPase WRNIP1 associates with RNAPII and limits ATM activation during unperturbed cell cycle. WRNIP1 binding to elongating RNAPII requires catalytic activity of the ubiquitin ligase HUWE1. Mutation of HUWE1 induces TRCs, promotes WRNIP1 dissociation from RNAPII and binding to the replisome, stimulating ATM recruitment and activation at RNAPII. TRCs and translocation of WRNIP1 are rapidly induced in response to hydroxyurea treatment to activate ATM and facilitate subsequent DNA repair. We propose that TRCs can provide a controlled mechanism for stalling of replication forks and ATM activation, instrumental in cellular response to replicative stress.


Conflict of interest statement

The authors declare no competing interests.

Figures

Fig. 1
Fig. 1. Mutation of HUWE1 induces transcription-replication conflicts.
a The catalytic cysteine of the endogenous HUWE1 HECT domain (gray) was replaced by a serine (HUWE1-CS, CS) or the wild type cysteine (HUWE1-WT, WT) in parental HCT116 cells (P). b Transcriptome analysis of HUWE1-P, HUWE1-WT and HUWE1-CS cells. Overlap of genes significantly deregulated (p-value ≤ 0.01, FDR ≤ 0.01, n = 3) in HUWE1-WT or HUWE1-CS cells relative to parental HUWE1-P cells. c Volcano plot of RNAseq analysis (n = 11350 transcripts over 3 biological replicates). Members of the MYC hallmark V1 gene set are highlighted in red. d DNA fiber assay in parental HCT116 (P), HUWE1-WT and HUWE1-CS cells. Representative images of single DNA fibers (left) and quantification (right) are shown (n = 50 forks per group). Scale bar: 4 µm; n = 3 experiments e, f Proximity ligation assay (PLA) with antibodies to PCNA and RNAPII in HUWE1-WT and HUWE1-CS cells treated with 100 µM DRB, 10 nM AZD4573, 100 nM triptolide or the HUWE1 inhibitor BI-8622 (5 µM) for 7 h. e Quantification of proximity pairs within nuclei for n = 181,173,154,165,169,147,142,196,152 cells. f Representative images. Scale bar: 5 µm. g Immunoprecipitation (IP) of RNAPII in formaldehyde-crosslinked and sonicated HUWE1-WT and HUWE1-CS cells. A representative image (left) and quantification of the CS/WT ratio (right) are shown (n = 4, mean ± SD). d, e Boxplots show median±quartiles with whiskers ranging up to 1.5-fold of the inter-quartile range. P-values were determined using Kruskal–Wallis test followed by Dunn’s multiple comparison. Source data are provided as a Source Data file.
Fig. 2
Fig. 2. HUWE1 interacts with WRNIP1.
a LC-MS/MS analysis of HUWE1 immunoprecipitates in HUWE1-WT and HUWE1-CS cells. b Validation of WRNIP1 as an interactor f HUWE1 by immunoprecipitation (IP) and immunoblotting (n = 3). c Immunofluorescence staining of HUWE1 and WRNIP1 in HCT116 cells (n = 3). Scale bar: 5 µm. d PLA assay with HUWE1 and WRNIP1 antibodies in WT and CS cells after pulse-labeling with 25 µM EdU for 30 min. PLA foci were quantified and are displayed for EdU-positive (EdU+) and EdU-negative (EdU−) cell populations and for cells stained solely with either the HUWE1-IgG (H1) or the WRNIP1-IgG (W1). From left, n = 128, 161, 107, 92,199, 214 cells. Scale bar: 10 µm. e Mapping of the WRNIP1 domain required for HUWE1 binding. UBZ: Ubiquitin binding zinc finger; LZ: Leucine zipper; AAA: AAA+ ATPase domain. See also Supplementary Fig. 2e, f. f DNA fiber assay in HCT116 cell expressing either shCtrl or shWRNIP1. Example images (left) and quantification (right) are shown (n = 125 fibers per group). P-values were determined using the non-parametric, two-tailed Mann–Whitney test. Scale bar: 4 µm. g EdU incorporation assay in WT or CS cells expressing shCtrl or shWRNIP1 (shW1). Scale bar: 20 µm, n = 2. h Quantification of the EdU incorporation assay shown in (g). From left, n = 192,165,184,115 cells. i Quantification of RNAPII-PCNA PLA foci in control and WRNIP1-depleted cells treated with 100 µM DRB or 100 nM triptolide for 6 h (≥100 cells per group). j RNAPII-PCNA PLA foci quantification of cells expressing full-length (FL) HA-WRNIP1, WRNIP1 lacking the leucine zipper domain (ΔLZ) or only the WRNIP1 UBZ domain (UBZ). See also Supplementary Fig. 2f. From left, n = 190,185,176,179 cells. k Quantification of RNAPII-PCNA PLA in HUWE1-WT and HUWE1-CS cells, expressing shCtrl or shWRNIP1. From left, n = 177,140,137,132 cells. d, hk Boxplots show median±quartiles with whiskers ranging up to 1.5-fold of the inter-quartile range. P-values were determined using Kruskal–Wallis test followed by Dunn’s multiple comparison. Source data are provided as a Source Data file.
Fig. 3
Fig. 3. HUWE1 controls association of WRNIP1 with elongating RNAPII.
a Representative genome browser tracks (left) and quantification (right) of WRNIP1 ChIPseq experiments. WRNIP1 ChIPseq tags were quantified at genic regions of all genes and displayed as scaled metagenes. b WRNIP1 ChIPseq normalized tag counts for the top 1000 WRNIP1-bound genes in HUWE1-WT cells compared with HUWE1-CS cells (n = 1000 genes). Boxplots represent median±quartiles with whiskers ranging from minimum to maximum values. Significance was determined using a paired, two-tailed t test. c Immunoprecipitation (IP) analysis with WRNIP1 in benzonase-treated HCT116 lysates (n = 3). d PLA with antibodies to WRNIP1 and RNAPII (n = 202, 221, 230, 182 cells), pS2-RNAPII (n = 179, 216, 232, 207 cells) and pS5-RNAPII (n = 181, 202, 252, 182 cells) in HUWE1-WT and HUWE1-CS cells expressing shWRNIP1 (shW1) or a shCtrl. Boxplots show median±quartiles with whiskers ranging up to 1.5-fold of the inter-quartile range. P-values were determined using Kruskal-Wallis test followed by Dunn’s multiple comparison. e Re-ChIP experiment consisting of a first ChIP with WRNIP1 antibodies followed by elution of protein-DNA complexes and a second ChIP with RNAPII antibodies. Purified DNA was analyzed by qPCR with the indicated primer pairs (n = 3, mean ± SD). f Immunoprecipitation of total, pS2-, or pS5-RNAPII in formaldehyde-crosslinked WT and CS cells (n = 2). g ChIPseq analysis of pS2-RNAPII in the indicated cell lines. Representative genome browser tracks (left) and quantification of pS2-RNAPII ChIPseq tag coverage at all transcription termination sites (right). Source data are provided as a Source Data file.
Fig. 4
Fig. 4. HUWE1 and WRNIP1 suppress ATM signaling.
a Immunoblotting analysis of HUWE1-WT and HUWE1-CS cells expressing shWRNIP1 or shCtrl (n = 3). b Neutral comet assay of HUWE1-WT and HUWE1-CS cells with or without WRNIP1 depletion (n = 1395, 1045, 779, 660 comets). Boxplots (right) show median±quartiles with whiskers ranging up to 1.5-fold of the inter-quartile range. P-values were determined using Kruskal–Wallis test followed by Dunn’s multiple comparison. Scale bar: 50 µm. c Representative tracks (left) and quantification of DSBCapture tag density (right) in HUWE1-WT and HUWE1-CS cells expressing shWRNIP1 or shCtrl. d Metagene analysis of WRNIP1 ChIPseq coverage for all genes and genes with DSBCapture peaks in HUWE1-WT cells. e Immunoblotting analysis of WT and CS cells expressing shCtrl or shWRNIP1, treated with 2.5 µM ATM inhibitor KU55933 or DMSO for 2 h (n = 3). f Analysis of proliferation of HUWE1-WT or HUWE1-CS cells expressing shCtrl or shWRNIP1 by crystal violet staining (n = 3, mean ± SD). Source data are provided as a Source Data file.
Fig. 5
Fig. 5. HUWE1 and WRNIP1 limit ATM activation at RNAPII.
a Immunoblotting analysis of HUWE1-WT and HUWE1-CS cells treated with 20 nM AZD4573 or 20 nM triptolide for 6 h (n = 4). b Scheme of RNAPII-MRN-ATM interaction. See also Supplementary Fig. 5c. c Immunoblot analysis of HUWE1-WT and HUWE1-CS cells expressing shCtrl or shRAD50 (n = 3). d Immunoprecipitation (IP) of RAD50 and MRE11 in benzonase-treated lysates of HCT116 cells (n = 2). e Immunoprecipitation of ATM in benzonase-treated lysates of shWRNIP1 or shCtrl cells. A representative image (left) and densitometry-based quantification (right, n = 3, mean ± SD) are shown. f Immunoprecipitation of ATM in benzonase-treated lysates using HUWE1-WT and HUWE1-CS cells treated with DMSO (−) or 20 nM triptolide (+) for 4 h. A representative image (left) and densitometry-based quantification (right, n = 3, mean ± SD) are shown. g CRISPR-KO screen using a focused sgRNA library targeting genes within GO terms “Cell cycle”, “DNA replication” and “DNA repair” in HUWE1-WT and HUWE1-CS cells. h Crystal violet staining (left) and quantification (right, n = 3, mean ± SD) of HUWE1-WT or HUWE1-CS cells expressing shRAD50 or shCtrl after 7 days of unperturbed growth. P-values were determined with one-way ANOVA followed by Tukey’s multiple comparison. i Synergy of ATM and HUWE1 inhibitors in killing of HUWE1-WT and HUWE1-CS cells determined by WST-8 assay after 4 d of treatment. Source data are provided as a Source Data file.
Fig. 6
Fig. 6. HUWE1 and WRNIP1 control RNAPII-dependent ATM activation upon replicative stress.
a PLA with antibodies against WRNIP1 and MCM2 (n = 190, 167, 132, 140, 175, 172, 207 cells) or WRNIP1 and RNAPII (n = 171, 145, 130, 140, 137, 161, 207 cells) in HCT116 cells treated with 1 mM hydroxyurea (HU) or released from HU for the indicated time. The graph shows median±quartiles for counts of proximity pairs in nuclei. P-values were determined using Kruskal–Wallis test followed by Dunn’s multiple comparison. Displayed p-values correspond to the comparison of the respective sample to the non-treatment control. b PLA with antibodies to PCNA and RNAPII in cells with 2 h pre-treatment using 20 nM AZD4573 or 100 nM triptolide followed by the addition of 1 mM HU for 4 h (n = 187, 160, 195, 223, 198, 171 cells). c Immunoblot analysis of HCT116 cells treated with 1 mM HU for 4 h or in combination with 2 h pre-treatment using 20 nM AZD4573 or 100 nM triptolide (n = 3). d Immunoblot analysis of HCT cells expressing shCtrl or shRAD50 after treatment with 1 mM HU for 2 h (n = 2). e Immunoprecipitation (IP) of ATM in cells treated with 1 mM hydroxyurea or in combination with 20 nM triptolide for 4 h (n = 2). f Neutral comet assay in HCT116 cells treated with DMSO, 1 mM HU alone or in combination with 20 nM AZD4573 for 6 h, followed by a 24 h release phase. Scale bar: 50 µm. From left, n = 585, 517, 376, 320 cells. g Crystal violet staining of HCT116 cells treated with 1 nM AZD4573 or 2.5 nM triptolide for 3 h followed by addition of 250 µM hydroxyurea (HU) for 4 days. P-values were determined using one-way ANOVA followed by Tukey’s multiple comparison. b, f Boxplots show median±quartiles with whiskers ranging up to 1.5-fold of the inter-quartile range. P-values were determined using Kruskal–Wallis test followed by Dunn’s multiple comparison. Source data are provided as a Source Data file.
Fig. 7
Fig. 7. Proposed model of HUWE1 and WRNIP1 dependent coordination of transcription and replication.
HUWE1 binds to WRNIP1 and both proteins prevent transcription-dependent TRCs. HUWE1 promotes the association of WRNIP1 with elongation-competent pS2-RNAPII. Upon induction of replication stress or in HUWE1-CS cells, WRNIP1 translocates from RNAPII to stalled replication forks, leading to stabilization of TRCs and recruitment of ATM to RNAPII via the MRN complex. Stabilization of the collision state induces ATM signaling and limits DNA breakage.

References

    1. Guha S, Bhaumik SR. Transcription-coupled DNA double-strand break repair. DNA Repair (Amst.) 2022;109:103211. - PubMed
    1. Ui A, Chiba N, Yasui A. Relationship among DNA double-strand break (DSB), DSB repair, and transcription prevents genome instability and cancer. Cancer Sci. 2020;111:1443–1451. - PMC - PubMed
    1. Bermejo R, Lai MS, Foiani M. Preventing replication stress to maintain genome stability: resolving conflicts between replication and transcription. Mol. Cell. 2012;45:710–718. - PubMed
    1. Ma J, Wang MD. DNA supercoiling during transcription. Biophys. Rev. 2016;8:75–87. - PMC - PubMed
    1. Garcia-Muse T, Aguilera A. R loops: from physiological to pathological roles. Cell. 2019;179:604–618. - PubMed

Publication types