. 2023 Aug 24;14(1):5177.
doi: 10.1038/s41467-023-40932-4.

A synthetic cell-free 36-enzyme reaction system for vitamin B12 production

Affiliations

A synthetic cell-free 36-enzyme reaction system for vitamin B12 production

Qian Kang et al. Nat Commun. .

Abstract

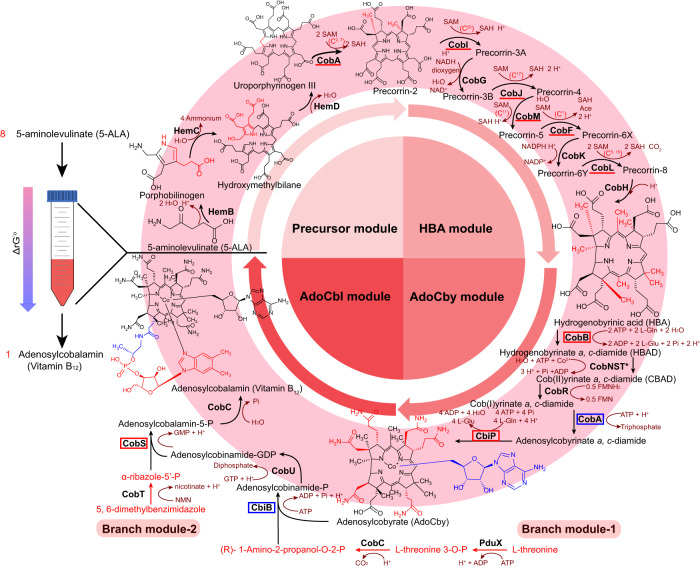
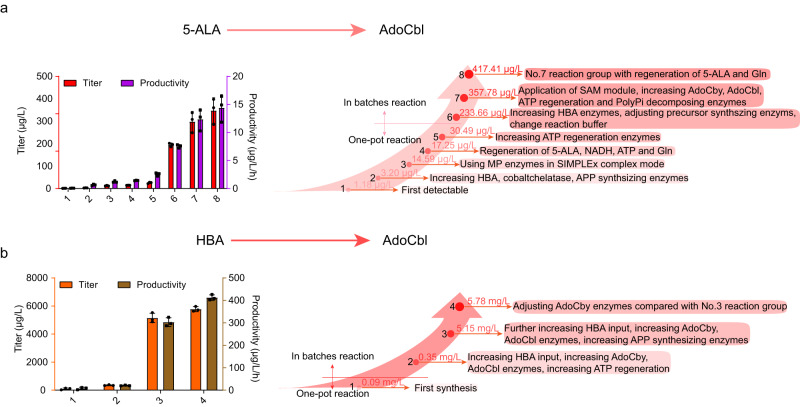
Adenosylcobalamin (AdoCbl), a biologically active form of vitamin B12 (coenzyme B12), is one of the most complex metal-containing natural compounds and an essential vitamin for animals. However, AdoCbl can only be de novo synthesized by prokaryotes, and its industrial manufacturing to date was limited to bacterial fermentation. Here, we report a method for the synthesis of AdoCbl based on a cell-free reaction system performing a cascade of catalytic reactions from 5-aminolevulinic acid (5-ALA), an inexpensive compound. More than 30 biocatalytic reactions are integrated and optimized to achieve the complete cell-free synthesis of AdoCbl, after overcoming feedback inhibition, the complicated detection, instability of intermediate products, as well as imbalance and competition of cofactors. In the end, this cell-free system produces 417.41 μg/L and 5.78 mg/L of AdoCbl using 5-ALA and the purified intermediate product hydrogenobyrate as substrates, respectively. The strategies of coordinating synthetic modules of complex cell-free system describe here will be generally useful for developing cell-free platforms to produce complex natural compounds with long and complicated biosynthetic pathways.


Conflict of interest statement

The authors declare no competing interests.

Figures

Fig. 1
Fig. 1. The cell-free synthetic system for adenosylcobalamin production.
Schematic diagram of AdoCbl synthetic pathway. The arrow with gradient color form red to blue in the left of illustration means that the Gibbs free energy of the whole catalytic pathway is decreased through the catalytic process from 5-ALA to Adenosylcobalamin. The whole pathway was separated into five modules, with compounds shown in black and enzymes in bold black fonts. Cofactors and by-products are shown in red brown. In the precursor module (upper left of the circle), eight 5-ALA units are assembled into one precorrin-2 catalyzed by HemB, HemC, and HemD, followed by modification by CobA. The red portion of the structural formula indicates the reaction catalyzed by the previous enzymatic reaction. In the HBA module (upper right of the circle), precorrin-2 is catalyzed by eight Cob enzymes to produce HBA, including methylation by CobI, CobJ, CobM, CobF, CobL with SAM serving as the methyl donors. The methyltransferase is highlighted with a red underline in HBA synthesis, and the methylation position is labeled above the reactions. The red portions in HBA structural formula indicate the eight methylated modifications catalyzed by the HBA module (and CobA in precursor module). In the AdoCby module (bottom right of the circle), HBA undergoes amidation, reduction and adenylation, after which the adenosine group is assembled onto the porphyrin ring as the upper ligand to yield adenosylcobyrate (AdoCby). The six amidate groups introduced by CobB and CbiP are highlighted in red in the structure formula, while the adenosyl group introduced by CobA is highlighted in blue, and enzymes are marked with the same color frames as structures. The enzymes CobNST asterisked means the enzyme complex assembled with CobN, CobS and CobT. Two branch modules (red words in the bottom of the figure) are responsible for providing (R)−1-amino-2-propanol-O-2-P and α-ribazole-5’-P from l-threonine and 5, 6-dimetylbenzimidazole in branch module-1 and -2, respectively. In the AdoCbl module (bottom left of the circle), the modified down ligand from 5,6-dimethylbenzimidazole is assembled onto adenosylcobyrate to form adenosylcobalamin. The highlighted enzymes are shown with blue or red frames with the same color indicating the structure parts introduced from the branch module, respectively. 5-ALA 5-aminolevulinate, HBA hydrogenobyrinic acid, HBAD hydrogenobyrinate a, c-diamide, CBAD cob(II)yrinate a, c-diamide, AdoCby adenosylcobyrate, AdoCbl, adenosylcobalamin, SAM S-adenosyl-l-methionine, SAH S-adenosyl-l-homocysteine.
Fig. 2
Fig. 2. The standard Gibbs free energy change in the whole AdoCbl synthesis pathway.
The standard Gibbs free energy change (ΔG′°) of every enzyme involved in our reaction system were listed in supplementary Table 1. The black line indicates the synthetic pathway of AdoCbl from 5-ALA, while the red line indicates the regeneration module coupled synthetic pathway which involved with MetK, MtnN, RocG, OGDH, HemA, GlnA, and PpA, which were calculated according to the consumption of SAM, NADH and l-glutamine and accumulated polyphosphate. Every bold platform in this line graph indicates an intermediate product, while the red bold lines highlight the key compounds at each end of a synthetic module. The ΔG′° from 5-ALA to adenosylcobalamin is −486.80 kcal/mol and −685.84 kcal/mol in original pathway and regeneration module coupled pathway, respectively. 5-ALA 5-aminolevulinate, HBA hydrogenobyrinic acid, AdoCby adenosylcobyrate, AdoCbl adenosylcobalamin. Source data are provided as a Source Data file.
Fig. 3
Fig. 3. Dead-end by-product uroporphyrin III in the precursor module.
a Schematic diagram of cascade reaction in the precursor module. b illustration and LC-MS detection of uroporphyrinogen III oxidating. 5-ALA 5-aminolevulinate. Source data are provided as a Source Data file.
Fig. 4
Fig. 4. Cell-free synthesis in the HBA module.
a Schematic diagram of the cell free synthesis of HBA and LC-MS detection of synthetic HBA. Four different engineered E. coli MG1655 (DE3) strains harboring one pET28a-drived plasmid with the HBA Cob operon, working as a source of crude cell extracts to synthesize HBA. HemB, HemC, HemD, and CobA enzymes used in the form of purified enzymes, but other Cob enzymes was expressed in a pET28a-drived plasmid illustrated in graph and used in crude cell extracts. The knock out of endogenous complete or partial CysG are also illustrated in this graph. b Synthesis of HBA by different crude cell extracts supplied Cob enzymes. Every reaction mixture contained 0.1 μM HemB, 1 μM HemC, 1 μM HemD, 10 μM CobA, 77.9 mg/ml wet cell weight of HBA crude cell extract (corresponding to 8.9 mg/ml dry cell weight of HBA crude cell extract and 3.1 mg/ml total protein of HBA crude cell extract. Detailed information was illustrated in Supplementary Fig. 11), 2 mM NADH, 1 mM NADPH, 5 mM MgCl2, 10 mM KCl, 5 mM NaCl in 50 mM Tris-HCl (pH 8.0) buffer, 5 mM 5-ALA and 5 mM SAM was added 1 mM per hour for 5 h, and synthetic HBA was treated and detected by HPLC according to detection method. Reactions were performed in triplicate (n = 3 biologically independent samples) and data are presented as mean values ± SD. Two-sided unpaired t test is carried out between HBA2, 3, 4 reactions and HBA1. Unpaired t test of data: HBA2 to HBA1, P = 0.0240 (t = 3.540); HBA3 to HBA1, P = 0.0409 (t = 2.977); HBA4 to HBA1, P = 0.0476 (t = 2.825). *, P < 0.05. c Optimization of the cascade reactions in the precursor module by introducing MetK and MtnN. The reaction was performed in 100 mM Tris-HCl buffer (pH 8.0) with 5 mM MgCl2, 100 mM KCl, 50 mM NaCl, 0.1 μM HemB, 1 μM HemC, 1 μM HemD, 10 μM CobA and 3 mM ALA. 5 μM MetK, 5 μM PpK, 10 μM MtnN, 2 mM AMP, and 1 mM SMPP were externally added to the l-Met reaction mixture. Titration of SAM and l-Met. Reactions were performed in triplicate (n = 3 biologically independent samples) and data are presented as mean values ± SD. Two-sided unpaired t test is carried out with the titer of precorrin-2 between using l-Met and SAM in the same concentration. Unpaired t test of data: 0.05, P = 0.2468 (t = 1.355); 0.1, P = 0.0296 (t = 3.313); 0.2, P < 0.0001 (t = 221.37); 0.5, P = 0.0001 (t = 14.71); 1, P < 0.0001 (t = 29.37), 3, P < 0.0001 (t = 17.62); 5, P = 0.0032 (t = 6.300); 7.5, P = 0.0005 (t = 10.23); 10, P = 0.0001 (t = 14.06); 12.5, P = 0.0016 (t = 7.647); 15, P = 0.0001 (t = 14.78); 20, P = 0.0003 (t = 11.65). ns, P > 0.05; *, P < 0.05; **, P < 0.01; ***, P < 0.001; ****, P < 0.0001. Source data are provided as a Source Data file.
Fig. 5
Fig. 5. Optimization of the HBA synthetic module.
a Buffer screening of the HBA synthetic module with different pH value. Reactions were performed in triplicate (n = 3 biologically independent samples) and shown with line running through the mean values ± SD. b Evaluating the optimization of the sources of SAM module and reaction buffer. Reactions were performed in triplicate (n = 3 biologically independent samples) and data are presented as mean values ± SD. Two-sided unpaired t test is carried out with titer in different reaction system in the same pH condition. Unpaired t test of data: pH 7.6, P = 0.0226 (t = 3.606); pH 8.0, P = 0.0006 (t = 10.02). *, P < 0.05; ***, P < 0.001. c Influence of 5-ALA addition mode in the optimized HBA reaction system. Reactions were performed in triplicate (n = 3 biologically independent samples) and data are presented as mean values ± SD. Two-sided unpaired t test is carried out with titer between one-pot reaction and fed-batch reaction. Unpaired t test: P = 0.4869 (t = 0.7650). ns, P > 0.05. Source data are provided as a Source Data file.
Fig. 6
Fig. 6. Reactions in the AdoCby module.
a General schematic diagram of reactions in AdoCby synthetic module. b Schematic diagram of reaction catalyzed by hydrogenobyrinate a, c-diamide synthase and corresponding UPLC-MS detection. c Screening of eight hydrogenobyrinate a, c- diamide synthases from different organisms. Reactions were performed in triplicate (n = 3 biologically independent samples) and data are presented as mean values ± SD. d Chromatogram of the screened hydrogenobyrinate a, c-diamide synthases reaction. The retention time of HBA was 10.603 min, that of HBAM was 10.426 min and that of HBAD was 10.168 min. e Upper graph, detecting the CBAD reduction catalyzed by CobR. Control: FMN, NADH and CobR were incubated in 100 mM Tris-HCl buffer (pH 8.0); CobR: Control group with CBAD reactant (HBAD incubated after cobalt chelation); CobR-CobA: CobR reaction system with external addition of cobinamide adenosyltransferase CobA. Reactions above were incubated at 32 °C for 6 min, and the increasing concentration of FMN demonstrating the reduction of CBAD. Reactions were performed in triplicate (n = 3 biologically independent samples) and data are presented as mean values ± SD. Two-sided unpaired t test is carried out with FMN recovery between CobR reaction or CobR-CobA reaction with control reaction. Unpaired t test: CobR to control, P = 0.1246 (t = 1.939); CobR-CobA to control, P = 0.0157 (t = 4.033). ns, P > 0.05; *, P < 0.05. Lower graph, Stop-flow detection in AdoCby synthetic module. CobR-CobA, cascade reaction system from HBAD to adenosylcobyrinate a, c-diamide. CobR-CobA-CbiP, cascade reaction system from HBAD to AdoCby. The results were normalized to the control. Reactions were performed in triplicate (n = 3 biologically independent samples) with detection of Pi and in decuple (n = 10 biologically independent samples) with detection of ATP. Data are presented as mean values ± SD. Two-sided unpaired t test is carried out with ATP, phosphate and triphosphate between CobR-CobA reaction and CobR-CobA-CbiP reaction. Unpaired t test: ATP, P < 0.0001 (t = 10.91); phosphate, P = 0.0003 (t = 11.54); triphosphate, P = 0.9345 (t = 0.08752). ns, P > 0.05; ***, P < 0.001; ****, P < 0.0001. f UPLC-MS detection of synthetic adenosylcobyrinate a, c-diamide and adenosylcobyrate. HBA hydrogenobyrinic acid, HBAD hydrogenobyrate a, c- diamide, HBAM hydrogenobyrate c- monoamide, Pi phosphate, Pi3 triphosphate. Source data are provided as a Source Data file.
Fig. 7
Fig. 7. Designed regeneration system for AdoCbl synthesis system.
The AdoCbl synthetic pathway is simplified into three key parts showing in the middle of this graph. Consumption (red box) and production (gray box) of each cofactor was listed around the reaction pathway. The regeneration module was split into five sub-modules shown in the two sides. In module 1, NADH and 5-ALA were regenerated from NAD+ and l-glutamate catalyzed by RocG, OGDH and HemA. NAD+ (highlight in red words) was considered as the stoichiometric limiting reagent in the theoretical calculation in this graph. In module 2, l-glutamine was regenerated from l-glutamate by consuming same stoichiometric ATP. Ammonium (highlight in red words) was considered as the stoichiometric limiting reagent in the theoretical calculation in this graph. In module 3, ATP was regenerated from ADP by PpK at the expense of externally added polyphosphate (Pi(n)). In module 4, accumulated triphosphate and diphosphate were hydrolyzed by PpA to prevent feedback inhibition. In SAM module, SAM was synthesized from l-Met by MetK consuming ATP and by-product SAH was removed by MtnN to SRHcy. 5-ALA 5-aminolevulinate; HBA hydrogenobyrinic acid, AdoCby adenosylcobyrate, AdoCbl adenosylcobalamin, SAM S-adenosyl-l-methionine, SAH S-adenosyl-l-homocysteine, l-Met l-methionine, SRHcy S-ribosyl-homocysteine, NMN β-nicotinamide d-ribonucleotide, Pi phosphate.
Fig. 8
Fig. 8. Synthesis of AdoCbl in vitro.
a Titer and productivity of the cell-free reaction system from 5-ALA to AdoCbl during optimization. Reactions were performed in triplicate (n = 3 biologically independent samples) and data are presented as mean values ± SD. b Titer and productivity of the cell-free reaction system from purified HBA to AdoCbl during optimization. The significant strategy causing the improvement of every reaction system was highlight in the right axis of evolution, and specific reaction composition were listed in supplementary Table 2. Reactions were performed in triplicate (n = 3 biologically independent samples) and data are presented as mean values ± SD. Source data are provided as a Source Data file.

References

    1. Green R, et al. Vitamin B(12) deficiency. Nat. Rev. Dis. Prim. 2017;3:17040. - PubMed
    1. Woodward RB. The total synthesis of vitamin B 12. Pure Appl. Chem. 1973;33:145–177. - PubMed
    1. Wang ZJ, et al. Improved vitamin B(12) production by step-wise reduction of oxygen uptake rate under dissolved oxygen limiting level during fermentation process. Bioresor Technol. 2010;101:2845–2852. - PubMed
    1. Wang P, Zhang Z, Jiao Y, Liu S, Wang Y. Improved propionic acid and 5,6-dimethylbenzimidazole control strategy for vitamin B12 fermentation by Propionibacterium freudenreichii. J. Biotechnol. 2015;193:123–129. - PubMed
    1. Dong H, et al. A newly isolated and identified vitamin B12 producing strain: Sinorhizobium meliloti 320. Bioprocess Biosyst. Eng. 2016;39:1527–1537. - PubMed

Publication types

LinkOut - more resources