. 2023 Aug 24;13(1):13849.
doi: 10.1038/s41598-023-40683-8.

Cross-species comparative analysis of single presynapses

Affiliations

Cross-species comparative analysis of single presynapses

Eloïse Berson et al. Sci Rep. .

Abstract

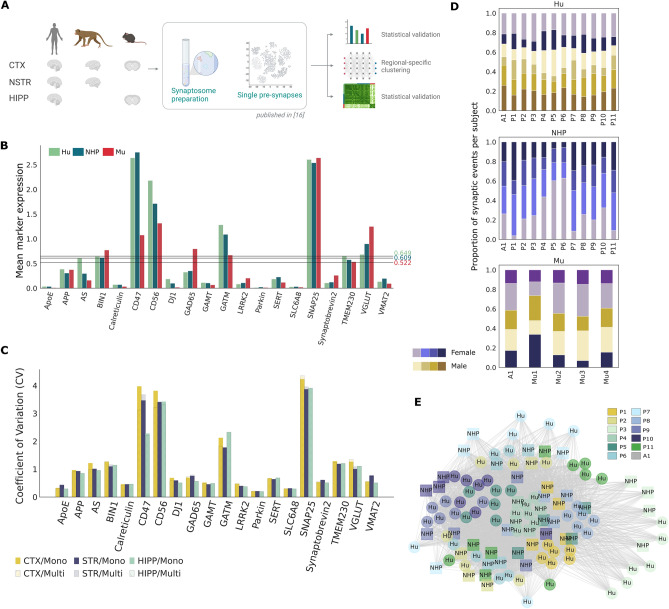
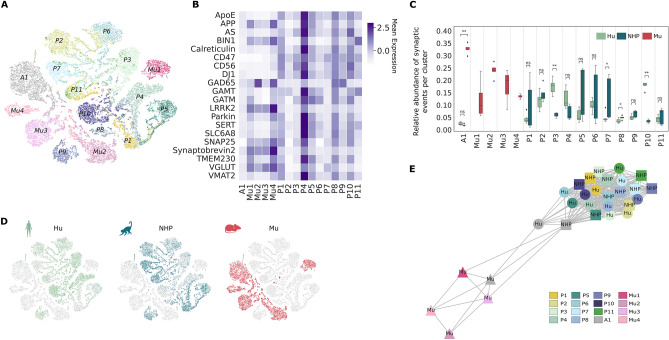
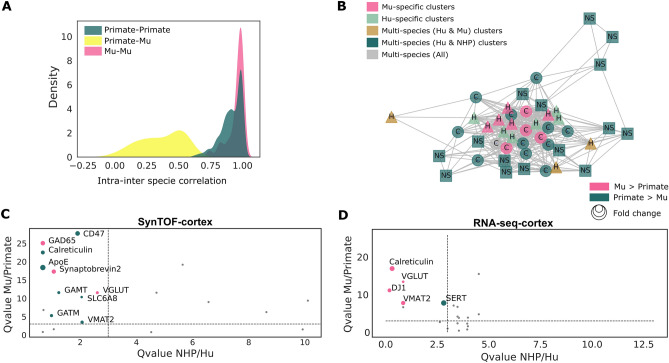
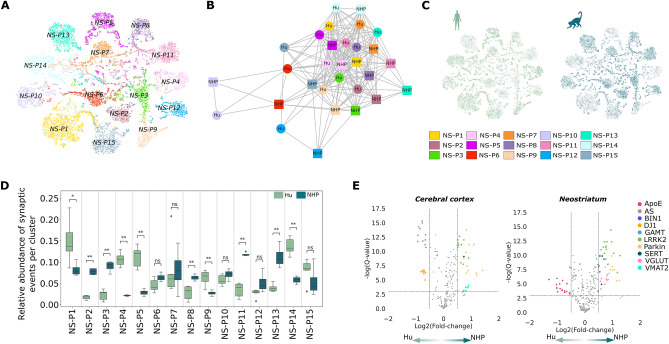
Comparing brain structure across species and regions enables key functional insights. Leveraging publicly available data from a novel mass cytometry-based method, synaptometry by time of flight (SynTOF), we applied an unsupervised machine learning approach to conduct a comparative study of presynapse molecular abundance across three species and three brain regions. We used neural networks and their attractive properties to model complex relationships among high dimensional data to develop a unified, unsupervised framework for comparing the profile of more than 4.5 million single presynapses among normal human, macaque, and mouse samples. An extensive validation showed the feasibility of performing cross-species comparison using SynTOF profiling. Integrative analysis of the abundance of 20 presynaptic proteins revealed near-complete separation between primates and mice involving synaptic pruning, cellular energy, lipid metabolism, and neurotransmission. In addition, our analysis revealed a strong overlap between the presynaptic composition of human and macaque in the cerebral cortex and neostriatum. Our unique approach illuminates species- and region-specific variation in presynapse molecular composition.


Conflict of interest statement

The authors declare no competing interests.

Figures

Figure 1
Figure 1
Cross-species presynaptic event comparison in cerebral cortex using a learning-based algorithm is minimally impacted by technical confounders. (A) Public available SynTOF data collected on synaptosome preparations from three species: human (Hu), non-human primate cynomolgus macaques (Macaca fascicularis, NHP), and C57Bl6 mouse (Mu) from different brain regions was leveraged in our study. A region-specific machine-learning pipeline was developed to compare these more than 4 M pre-synapses between species from three different brain regions: cerebral cortex (CTX, isocortical organization) from all three species (Brodmann area 9 for Hu and frontal cortex for NHP); neostriatum (NSTR) from Hu and NHP (Mu NSTR was not collected); and hippocampus (HIPP; allocortical organization) from Hu (at the level of the lateral geniculate nucleus) and Mu (NHP HIPP was unavailable because of commitments to other projects). (B) Mean species cross-reactive protein expression levels for Hu, NHP and Mu in cerebral cortex. One-way ANOVA test revealed no significant differences between the three species’ mean levels (P-value > 0.05). Lines represent mean value for each species. (C) Coefficient of variation computed on mono-species (Hu) and multi-species dataset per protein for three brain regions. (CTX, cortex; STR, Striatum; HIPP, Hippocampus). (D) Proportion of subject-specific synaptic events per cluster stratified by species. Presynaptic events across samples group together based on clustering assignment, no clusters were clearly segregated by subjects or sex, suggesting that our method is unaltered by intra-species or sex variation. (E) Nearest-neighbor graph built using the mean expression of single events from 11 primate-specific clusters (P1–P11) and one multi-species cluster (A1) (nodes). Edges correspond to the inter and intra-species one minus the normalized Euclidean distances between two subjects. Only edges superior to the mean distance value are shown. The model derives a latent space that brings closer events from the same nature regardless of the species origin. Node positions are computed based on the Fruchterman-Reingold algorithm. (AS, alpha-synuclein).
Figure 2
Figure 2
Presynaptic landscape across species in cerebral cortex. (A) t-SNE of single presynaptic events after nonlinear dimension reduction colored by annotated clusters. (B) Row-normalized cross-species mean expression heatmap of 20 proteins per cluster. (C) Mean frequency of presynaptic events per cluster stratified by species after removing events present in less than 0.01. Symbols indicate significant differences using Wilcoxon’s P-value < 0.05 after Benjamini–Hochberg correction. (D) t-SNE of single presynaptic events after nonlinear dimension reduction colored by species. (E) Graph based on the Fruchterman-Reingold algorithm of mean expression values displaying the underlying organization of the 15 clusters in the cerebral cortex. Nodes represent mean expression vectors embedded in the latent space, while edges indicate Pearson correlation coefficients after Bonferroni correction (P-value < 0.05). Only edges superior to the global mean Pearson correlation value were drawn. (AS, alpha-synuclein).
Figure 3
Figure 3
Divergence in presynaptic molecular signatures between primate and Mu in the cerebral cortex. (A) Inter-individual variations: density plot showing inter-species Pearson correlation coefficient distribution of markers in the cerebral cortex. (B) Meta-analysis across brain regions visualized through a Pearson correlation graph. Each node represents the mean expression in one brain region-dependent cluster. Edges correspond to the Pearson correlation coefficient between these nodes. Only significant edges (P-value < 0.05 using non-correlation testing corrected using Bonferroni's method), above the global mean edge value, are drawn. Nodes are colored by species-specificity of each cluster and positioned based on the Fruchterman-Reingold algorithm. (C) Significant pseudo-bulk presynaptic differential protein mean expression analysis between primates and Mu in cerebral cortex in SynTOF and RNA-seq data. Only significantly different proteins between Mu and primates, with fold-change greater than 0.5, and that show no significant differences between the two primates, are colored. P-values are derived using Wilcoxon's test after Benjamini–Hochberg correction. (D) Significant pseudo-bulk presynaptic differential protein mean expression analysis between primates and Mu in cerebral cortex in RNA-seq data from. Similar to (C), only significantly different genes between Mu and primates that showed no differences in primates are colored. (AS, alpha-synuclein).
Figure 4
Figure 4
SynTOF analysis reveals a strong proximity between Hu and NHP presynaptic events with species specificity at the protein level. (A) t-SNE of presynaptic events after nonlinear dimension reduction colored by clusters. (B) Visualization of the connection between mean expression of Hu and NHP samples from different clusters. Nodes represent mean expression vectors per cluster stratified by species, edges correspond to Pearson correlation between nodes vectors. Only significant edges (P-value < 0.05 using non-correlation testing) above the global mean edge value are displayed. Homogeneity was observed across the two datasets, suggesting a high similarity between identified presynaptic events in the two species. Node positions were computed based on the Fruchterman-Reingold algorithm. (C) Original single events from neostriatum embedded and projected in two dimensions using t-SNE, colored by species. (D) Mean frequency of Hu and NHP synaptic events per cluster after removing events present in less than 0.01. Symbols indicate significant differences using Wilcoxon’s P-value < 0.05 (*) after Benjamini–Hochberg correction. (E) Volcano plot of differential protein expression between Hu and NHP, per cluster in cerebral cortex and neostriatum after multiple testing corrected Wilcoxon’s test. Only significantly different marker expressions are colored.

References

    1. Südhof TC. Towards an understanding of synapse formation. Neuron. 2018;2018:276–293. doi: 10.1016/j.neuron.2018.09.040. - DOI - PMC - PubMed
    1. Terry RD, Masliah E, Salmon DP, Butters N, DeTeresa R, Hill R, et al. Physical basis of cognitive alterations in Alzheimer’s disease: Synapse loss is the major correlate of cognitive impairment. Ann. Neurol. 1991;1981:572–580. doi: 10.1002/ana.410300410. - DOI - PubMed
    1. Honer WG, Barr AM, Sawada K, Thornton AE, Morris MC, Leurgans SE, et al. Cognitive reserve, presynaptic proteins and dementia in the elderly. Transl. Psychiatry. 2012;2:e114. doi: 10.1038/tp.2012.38. - DOI - PMC - PubMed
    1. Masliah E, Terry RD, Alford M, DeTeresa R, Hansen LA. Cortical and subcortical patterns of synaptophysin like immunoreactivity in Alzheimer’s disease. Am. J. Pathol. 1991;138:235–246. - PMC - PubMed
    1. DeKosky ST, Scheff SW. Synapse loss in frontal cortex biopsies in Alzheimer’s disease: Correlation with cognitive severity. Ann. Neurol. 1990;27:457–464. doi: 10.1002/ana.410270502. - DOI - PubMed

Publication types