. 2023 Aug 24;14(1):5164.
doi: 10.1038/s41467-023-40898-3.

Long-read whole-genome analysis of human single cells

Affiliations

Long-read whole-genome analysis of human single cells

Joanna Hård et al. Nat Commun. .

Abstract

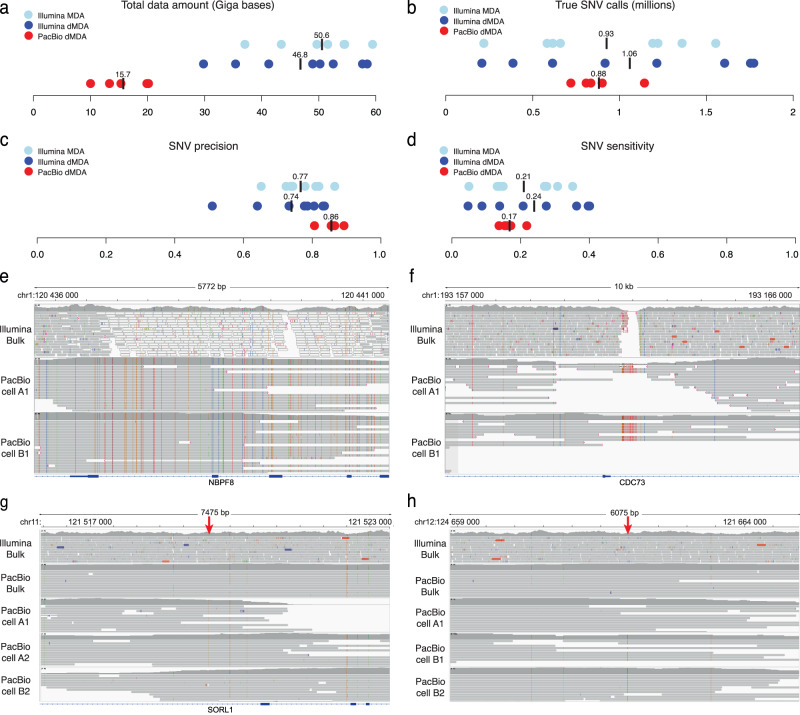
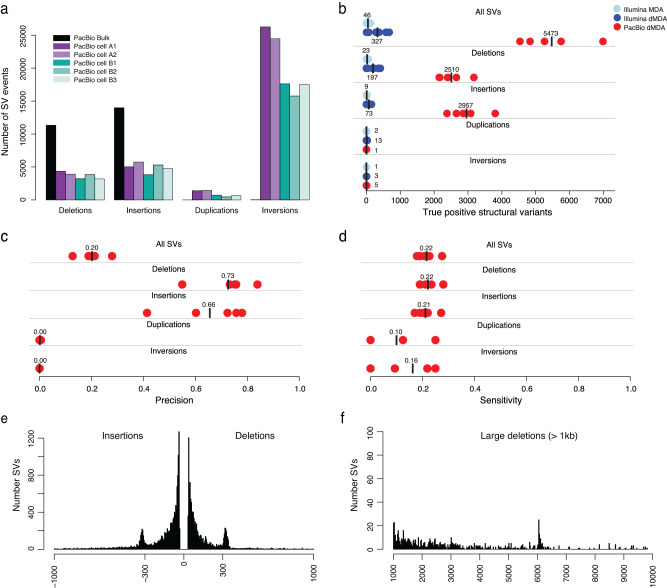
Long-read sequencing has dramatically increased our understanding of human genome variation. Here, we demonstrate that long-read technology can give new insights into the genomic architecture of individual cells. Clonally expanded CD8+ T-cells from a human donor were subjected to droplet-based multiple displacement amplification (dMDA) to generate long molecules with reduced bias. PacBio sequencing generated up to 40% genome coverage per single-cell, enabling detection of single nucleotide variants (SNVs), structural variants (SVs), and tandem repeats, also in regions inaccessible by short reads. 28 somatic SNVs were detected, including one case of mitochondrial heteroplasmy. 5473 high-confidence SVs/cell were discovered, a sixteen-fold increase compared to Illumina-based results from clonally related cells. Single-cell de novo assembly generated a genome size of up to 598 Mb and 1762 (12.8%) complete gene models. In summary, our work shows the promise of long-read sequencing toward characterization of the full spectrum of genetic variation in single cells.


Conflict of interest statement

C.-S.C. is an employee and shareholder of GeneDX, LLC. The other authors declare no competing interests. Parts of the sequencing costs were funded by Samplix.

Figures

Fig. 1
Fig. 1. Overview of the single-cell DNA amplification and sequencing experiment.
a An individual cell is isolated by fluorescence-activated cell sorting (FACS) and placed into a well-containing lysis buffer. DNA molecules from the lysed single cell are then encapsulated in picoliter droplets using the Xdrop microfluidic system, after which dMDA whole-genome amplification takes place inside each droplet. After amplification, the droplets are broken and DNA is released, followed by library preparation and whole-genome sequencing using short- (Illumina) and long-read (PacBio) technologies. b Image showing how droplets are formed in the Xdrop microfluidic system. An aqueous phase containing lysed DNA and dMDA reagents encounters an oil layer, resulting in <100 µm diameter droplets where single DNA fragments are captured. The Xdrop system has the capacity to produce around 50,000 droplets in 45 s. c Two human memory T cells (cells A and B) from the same individual were used as starting points for the experiments. Collections of daughter cells were obtained by in vitro expansion, and individual cells from clones A and B were analyzed using Illumina and PacBio whole-genome sequencing.
Fig. 2
Fig. 2. Comparison of MDA and dMDA for whole-genome amplification.
These results are based on Illumina MDA, dMDA, and bulk sequencing where the datasets have been randomly downsampled to contain the same number of reads. a The figure displays the average sequencing depth across the human chromosomes. The dMDA single-cell samples display good uniformity of coverage, whereas the MDA data show high spikes due to amplification bias. b Plot showing the percentage of bases in the reference genome (y axis) having a minimal coverage (x axis). On average the dMDA samples have more bases covered at a range 10–30×, as compared to the single-cell samples subjected to regular MDA. c Circle plots showing sequencing coverage in 500 kb bins for all of the Illumina single-cell samples, color-coded from 0× coverage (white) to over 200× coverage (black). Four replicate samples are included in each of the circle plots, and the chromosomal coordinates are displayed in the outermost circle. The dMDA samples at the top row display more even coverage than the MDA samples below, with more of the bins having average coverage in 4–15× coverage range (green). d Dot plot showing the percentage of reads aligning to regions of extreme (≥200×) coverage. Each dot corresponds to an individual sample. The rectangles indicate the average values for different sample/clone combinations (n = 4 cells per group). 68.9 and 16.0 are the average values for all MDA and dMDA samples (n = 8 cells per group). e Dot plot showing the percentage of reference bases that are covered by at least one read. The rectangles indicate the average values for different sample/clone combinations (n = 4 cells per group). 23.4 and 33.8 are the average values for all MDA and dMDA samples (n = 8 cells per group). Source data are provided as a Source Data file.
Fig. 3
Fig. 3. Analysis of SNVs in short- and long-read single-cell data.
a Total data amount for the Illumina and PacBio single-cell samples. Average values are represented by black vertical lines. b Number of true positive SNV calls in the Illumina and PacBio single cells. The true SNVs are defined as those found to be present also in the corresponding bulk sample. c Precision of SNV calls in the single-cell samples. d Sensitivity of SNV calls in the single-cell samples. e Example of a “dark” genic region (NBPF8) where Illumina data fails to align uniquely, while SNVs can be identified and phased in the PacBio single-cell data. f Another example of a “dark” genic region (CDC73), where PacBio reads from the two single cells span across a repetitive region that lacks coverage in the Illumina bulk sequencing data. g A somatic SNV in an intron of SORL1. The position of the somatic SNV is indicated by the red arrow at the top. The PacBio A1 and A2 single-cell samples contain a C > G variant at this position that is linked to several nearby SNVs in the region. In the bulk and PacBio B2 samples, the G is absent from the haplotype. This indicates that the C > G is a somatic variant only present in the T-cells from clone A. h A somatic SNV in an intergenic region on chromosome 12. This G > C variant is only present in T cells from clone B. Source data are provided as a Source Data file.
Fig. 4
Fig. 4. Analysis of SVs in long-read single-cell data.
a Number of deletions, insertions, duplications, and inversions were detected by Sniffles2 in all five PacBio single-cell datasets from the T-cell clones A and B. For comparison, the black bars represent SVs detected in the PacBio HiFi bulk sample. Many more duplications and inversions are detected in the single-cell data than in the bulk sample, as a result of chimeras introduced by dMDA. b Number of true positive SV calls in the Illumina and PacBio single cells. The true positive events are defined as those overlapping with an SV from the corresponding bulk sample. Average values for each SV class are represented by black vertical lines. c Precision of single-cell SV calls for the five PacBio single cells. Duplications and inversions have a precision of zero since virtually none of these events are detected in the PacBio bulk DNA sample. d Sensitivity of single-cell SV calls for the five PacBio single cells. e Length distribution of all true positive inversion and deletion events of up to 1 kb detected in the PacBio single cells. f Length distribution of all true positive deletion events of length 1–10 kb detected in the PacBio single cells. Source data are provided as a Source Data file.
Fig. 5
Fig. 5. Examples of large insertion and deletion events in long-read single-cell data.
a An IGV plot centered around a 711 bp insertion on chromosome 10. The insertion element is detected in the PacBio single-cell A1 (bottom) and can be phased to one of the haplotypes in PacBio bulk DNA data (middle). The insertion is not clearly visible in the Illumina bulk DNA data (at the top) and it would not be possible to resolve the haplotypes from short-read sequencing alone. b A 4891 bp deletion in an intron of CNTNAP4 was identified both in PacBio single-cell and bulk data. The Illumina data shows a drop in coverage indicative of a heterozygous deletion, but the exact breakpoints and haplotypes are not clearly visible.
Fig. 6
Fig. 6. Tandem repeats detected in single-cell long-read data.
a Overview of high-confidence tandem repeats detected across the five single-cell samples. All of these repeats were identified with the same repeat size in the PacBio bulk DNA sample. On the x axis is the repeat unit size and on the y axis is the length difference of the repeat, when compared to the human GRCh38 reference. The n values indicate the total number of analyzed repeat elements of different sizes. A negative value on the y axis corresponds a contraction of the repeat and a positive value corresponds to a repeat expansion. The extreme values are marked in red and blue. The median differences (indicated by gray vertical lines) are zero for most of the repeat units, meaning that most of the repeats have the same size as in GRCh38. b The IGV plot shows a region on chromosome 6 where the single-cell data an AT-repeat of 662 bp was detected in the PacBio single-cell and bulk data. In the alignment, the 662 bases are divided into two separate repeat insertions with 109 bp and 553 bp, respectively. The region is difficult to analyze by Illumina sequencing.

References

    1. Lewin HA, et al. Earth BioGenome Project: sequencing life for the future of life. Proc. Natl Acad. Sci. USA. 2018;115:4325–4333. - PMC - PubMed
    1. Rhie A, et al. Towards complete and error-free genome assemblies of all vertebrate species. Nature. 2021;592:737–746. - PMC - PubMed
    1. Nurk S, et al. The complete sequence of a human genome. Science. 2022;376:44–53. - PMC - PubMed
    1. Audano PA, et al. Characterizing the major structural variant alleles of the human genome. Cell. 2019;176:663–675.e619. - PMC - PubMed
    1. Chaisson MJP, et al. Multi-platform discovery of haplotype-resolved structural variation in human genomes. Nat. Commun. 2019;10:1784. - PMC - PubMed

Publication types