. 2023 Sep;26(9):1489-1504.
doi: 10.1038/s41593-023-01415-3. Epub 2023 Aug 24.

Infiltrating CD8+ T cells exacerbate Alzheimer's disease pathology in a 3D human neuroimmune axis model

Affiliations

Infiltrating CD8+ T cells exacerbate Alzheimer's disease pathology in a 3D human neuroimmune axis model

Mehdi Jorfi et al. Nat Neurosci. 2023 Sep.

Abstract

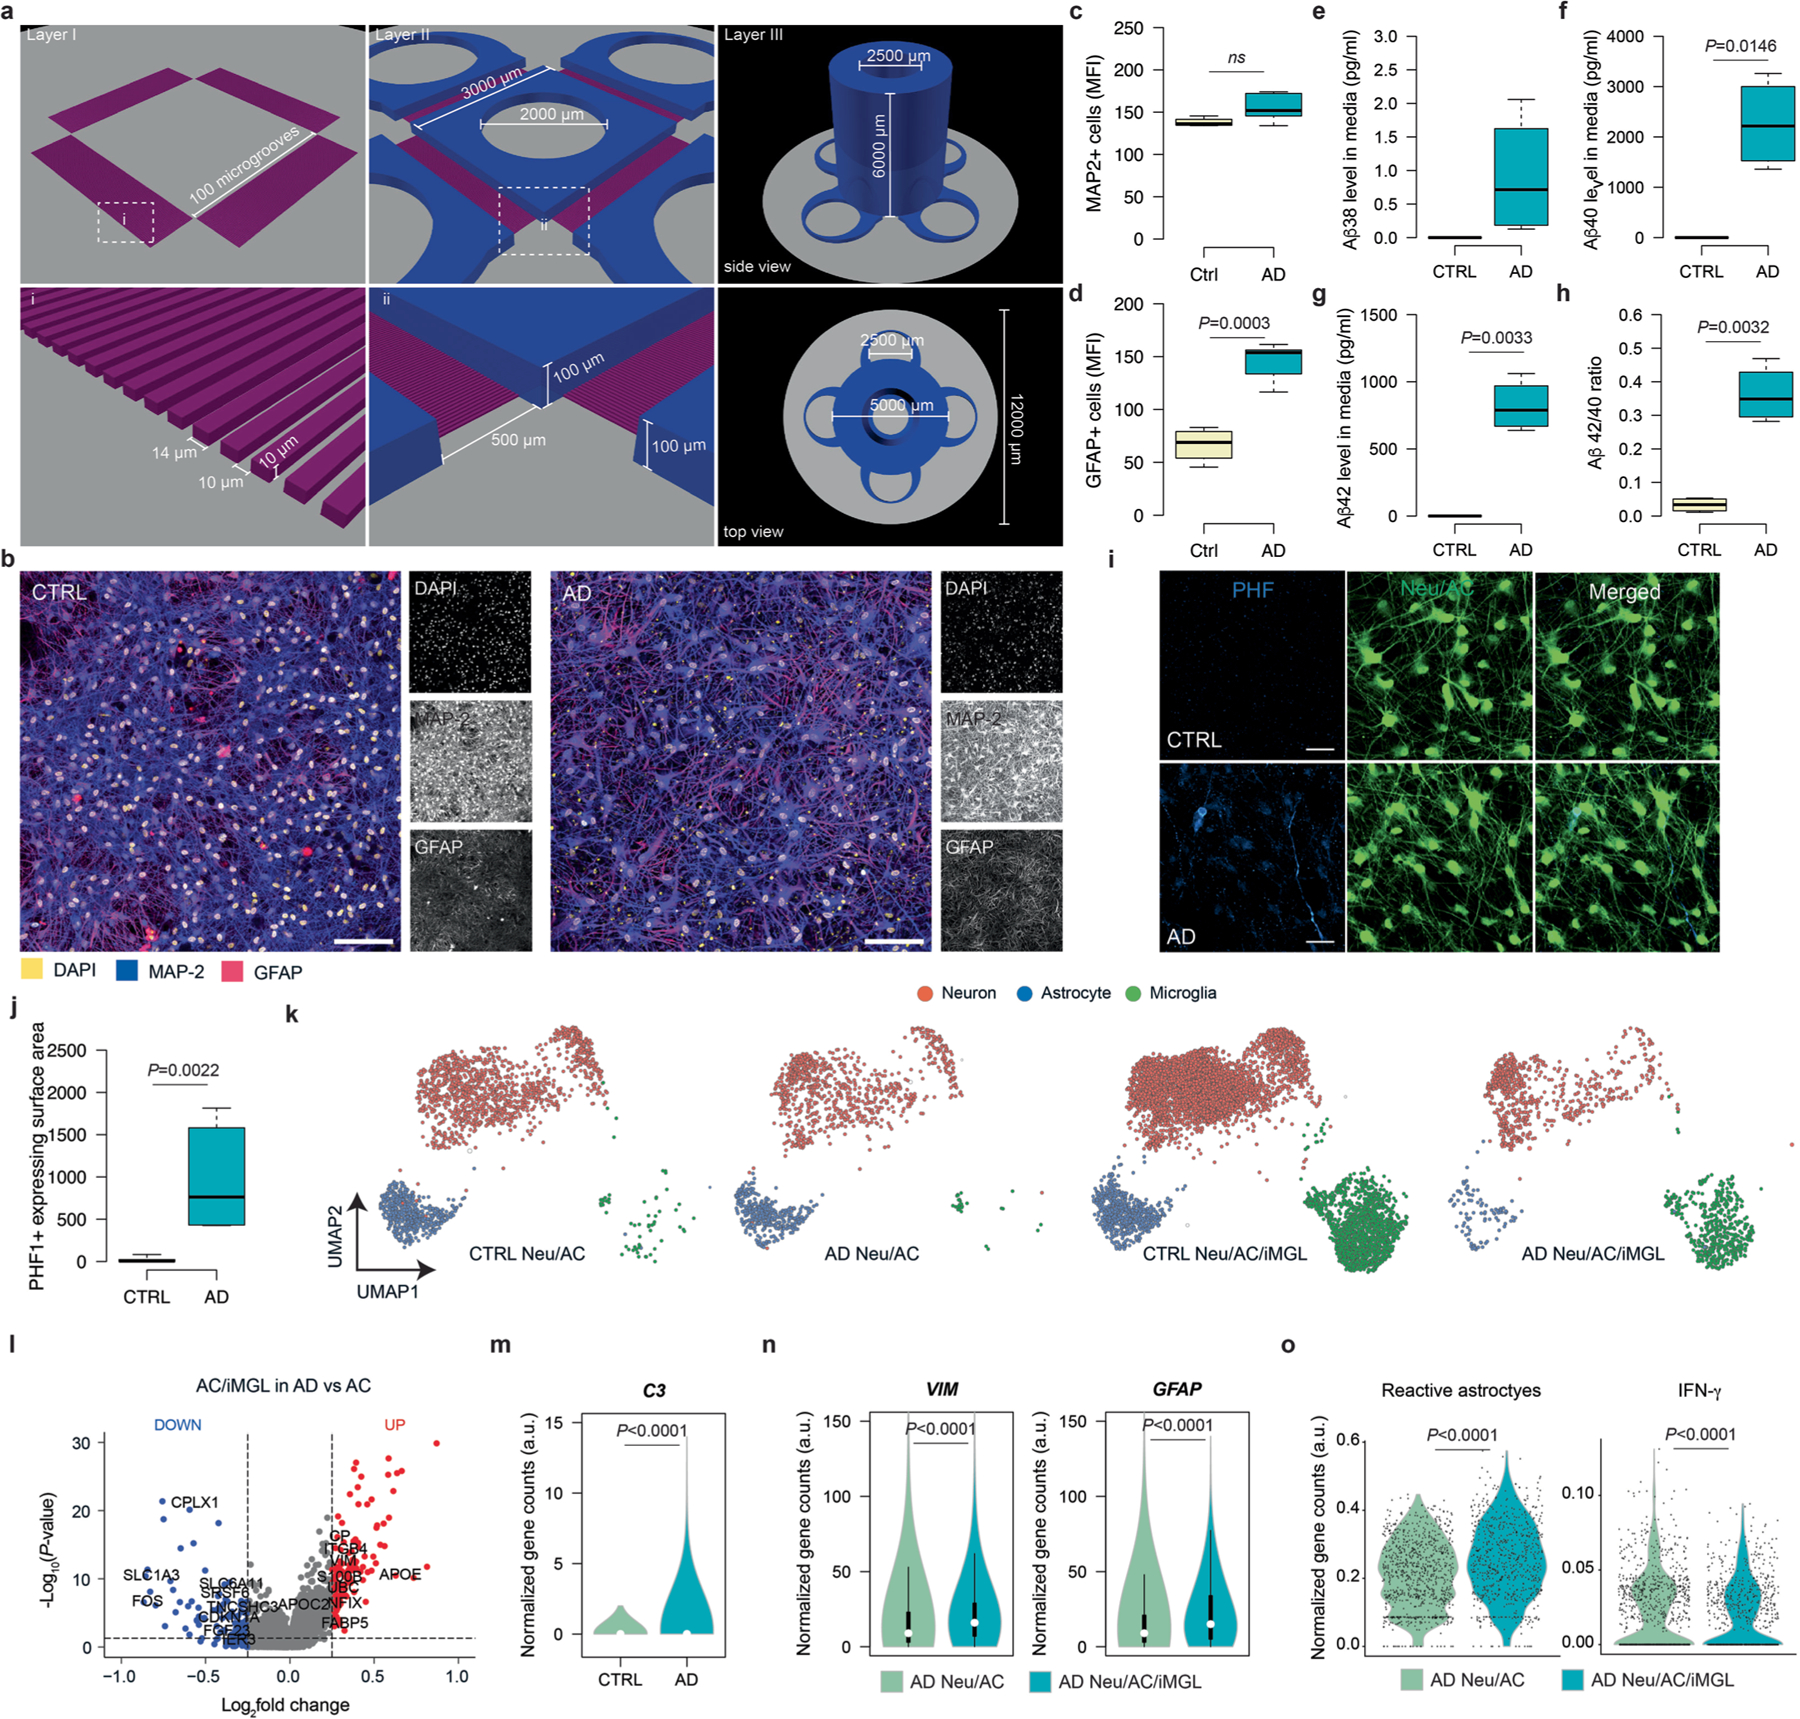
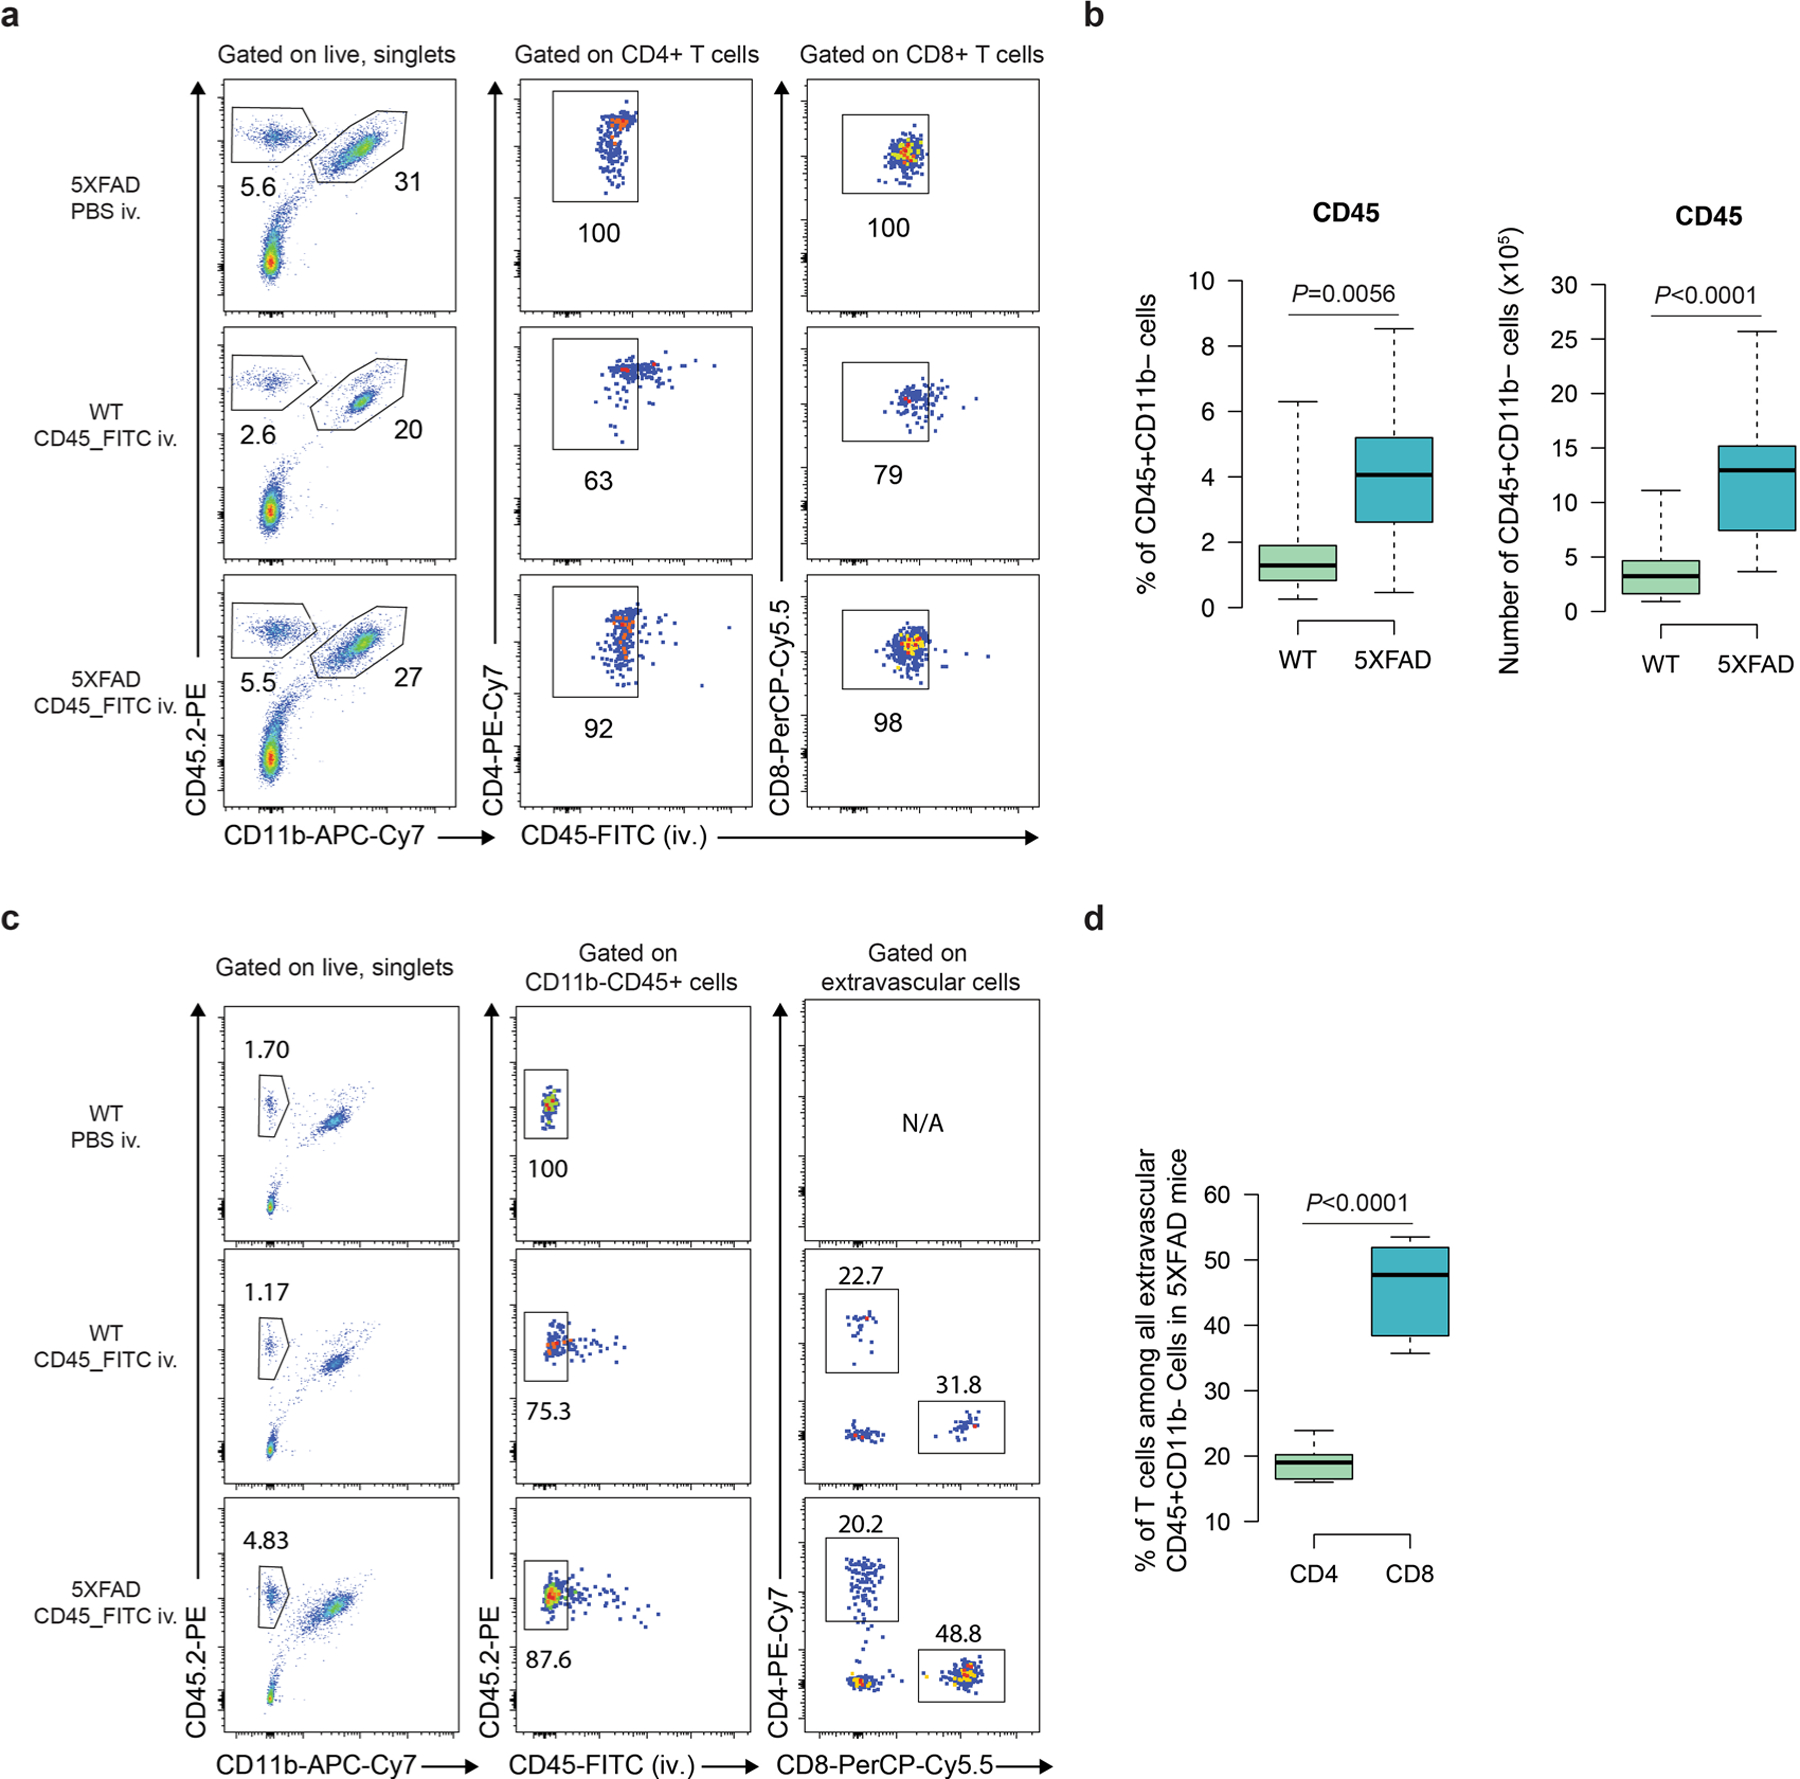
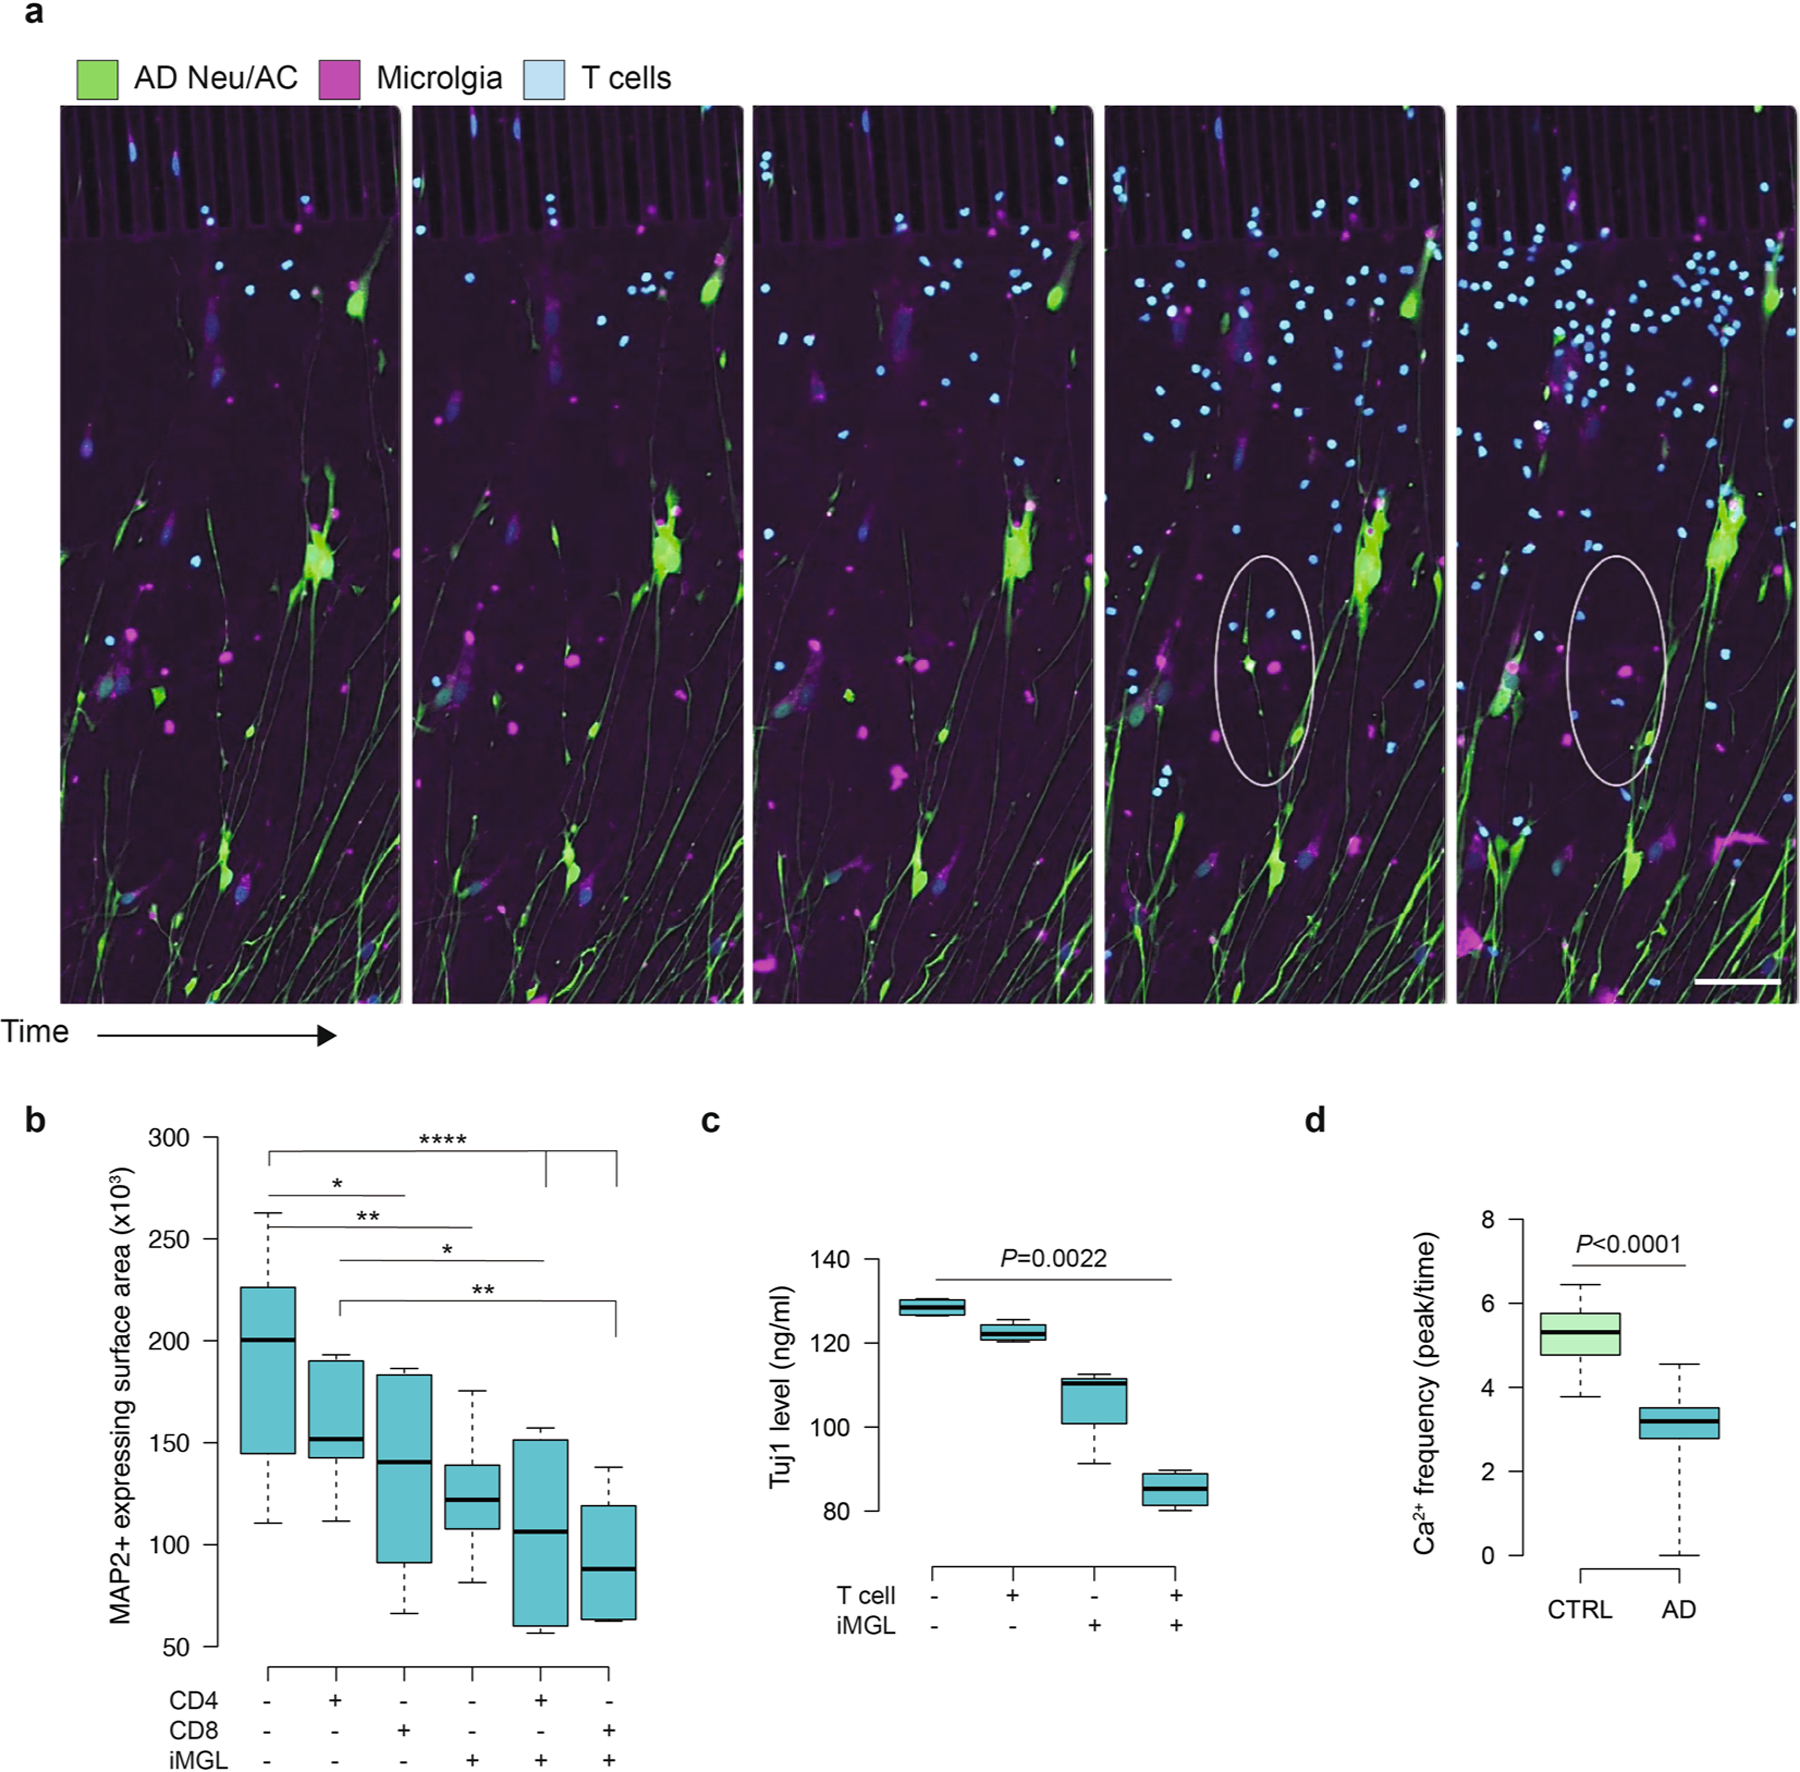
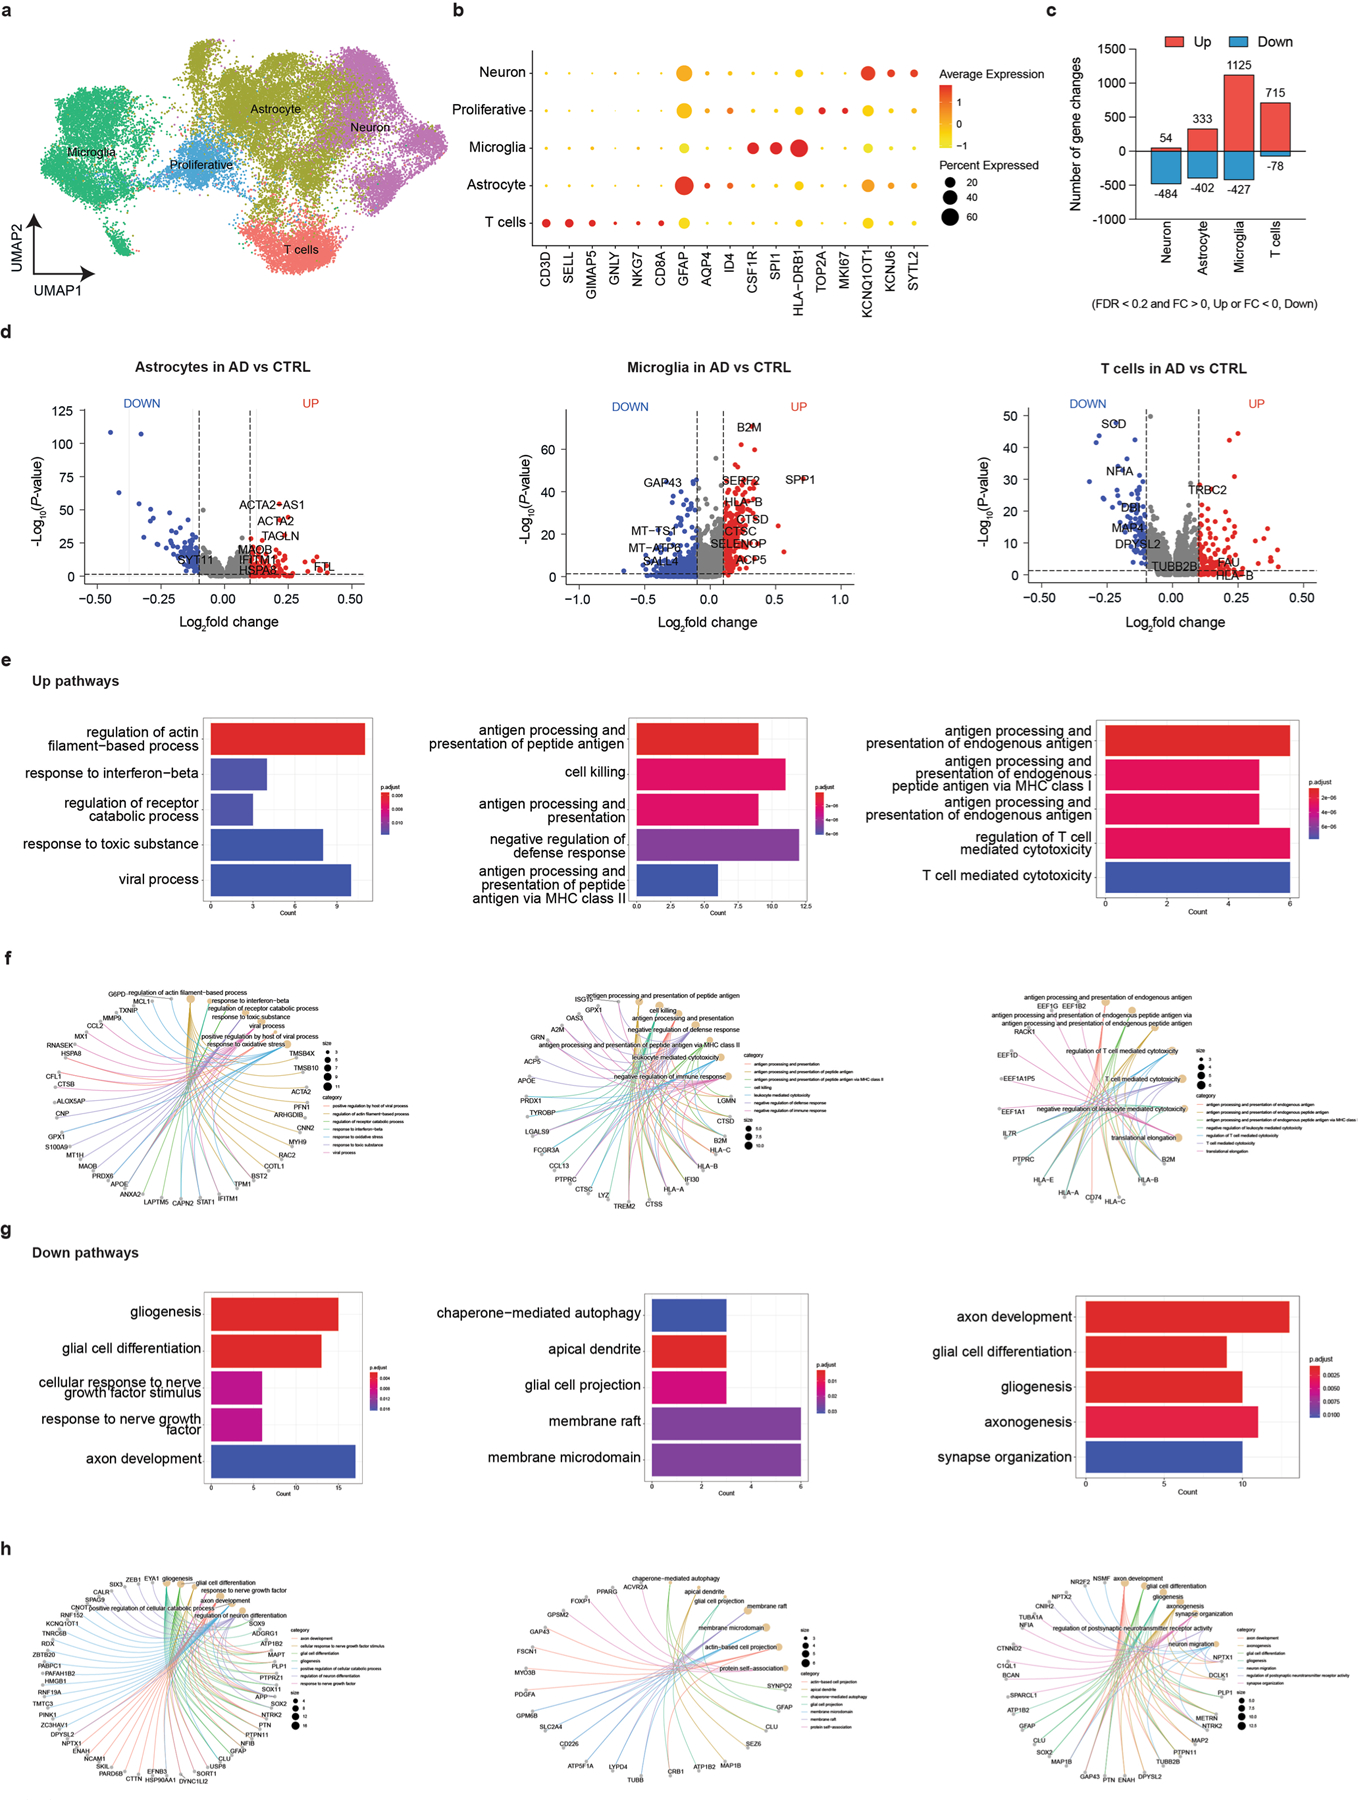
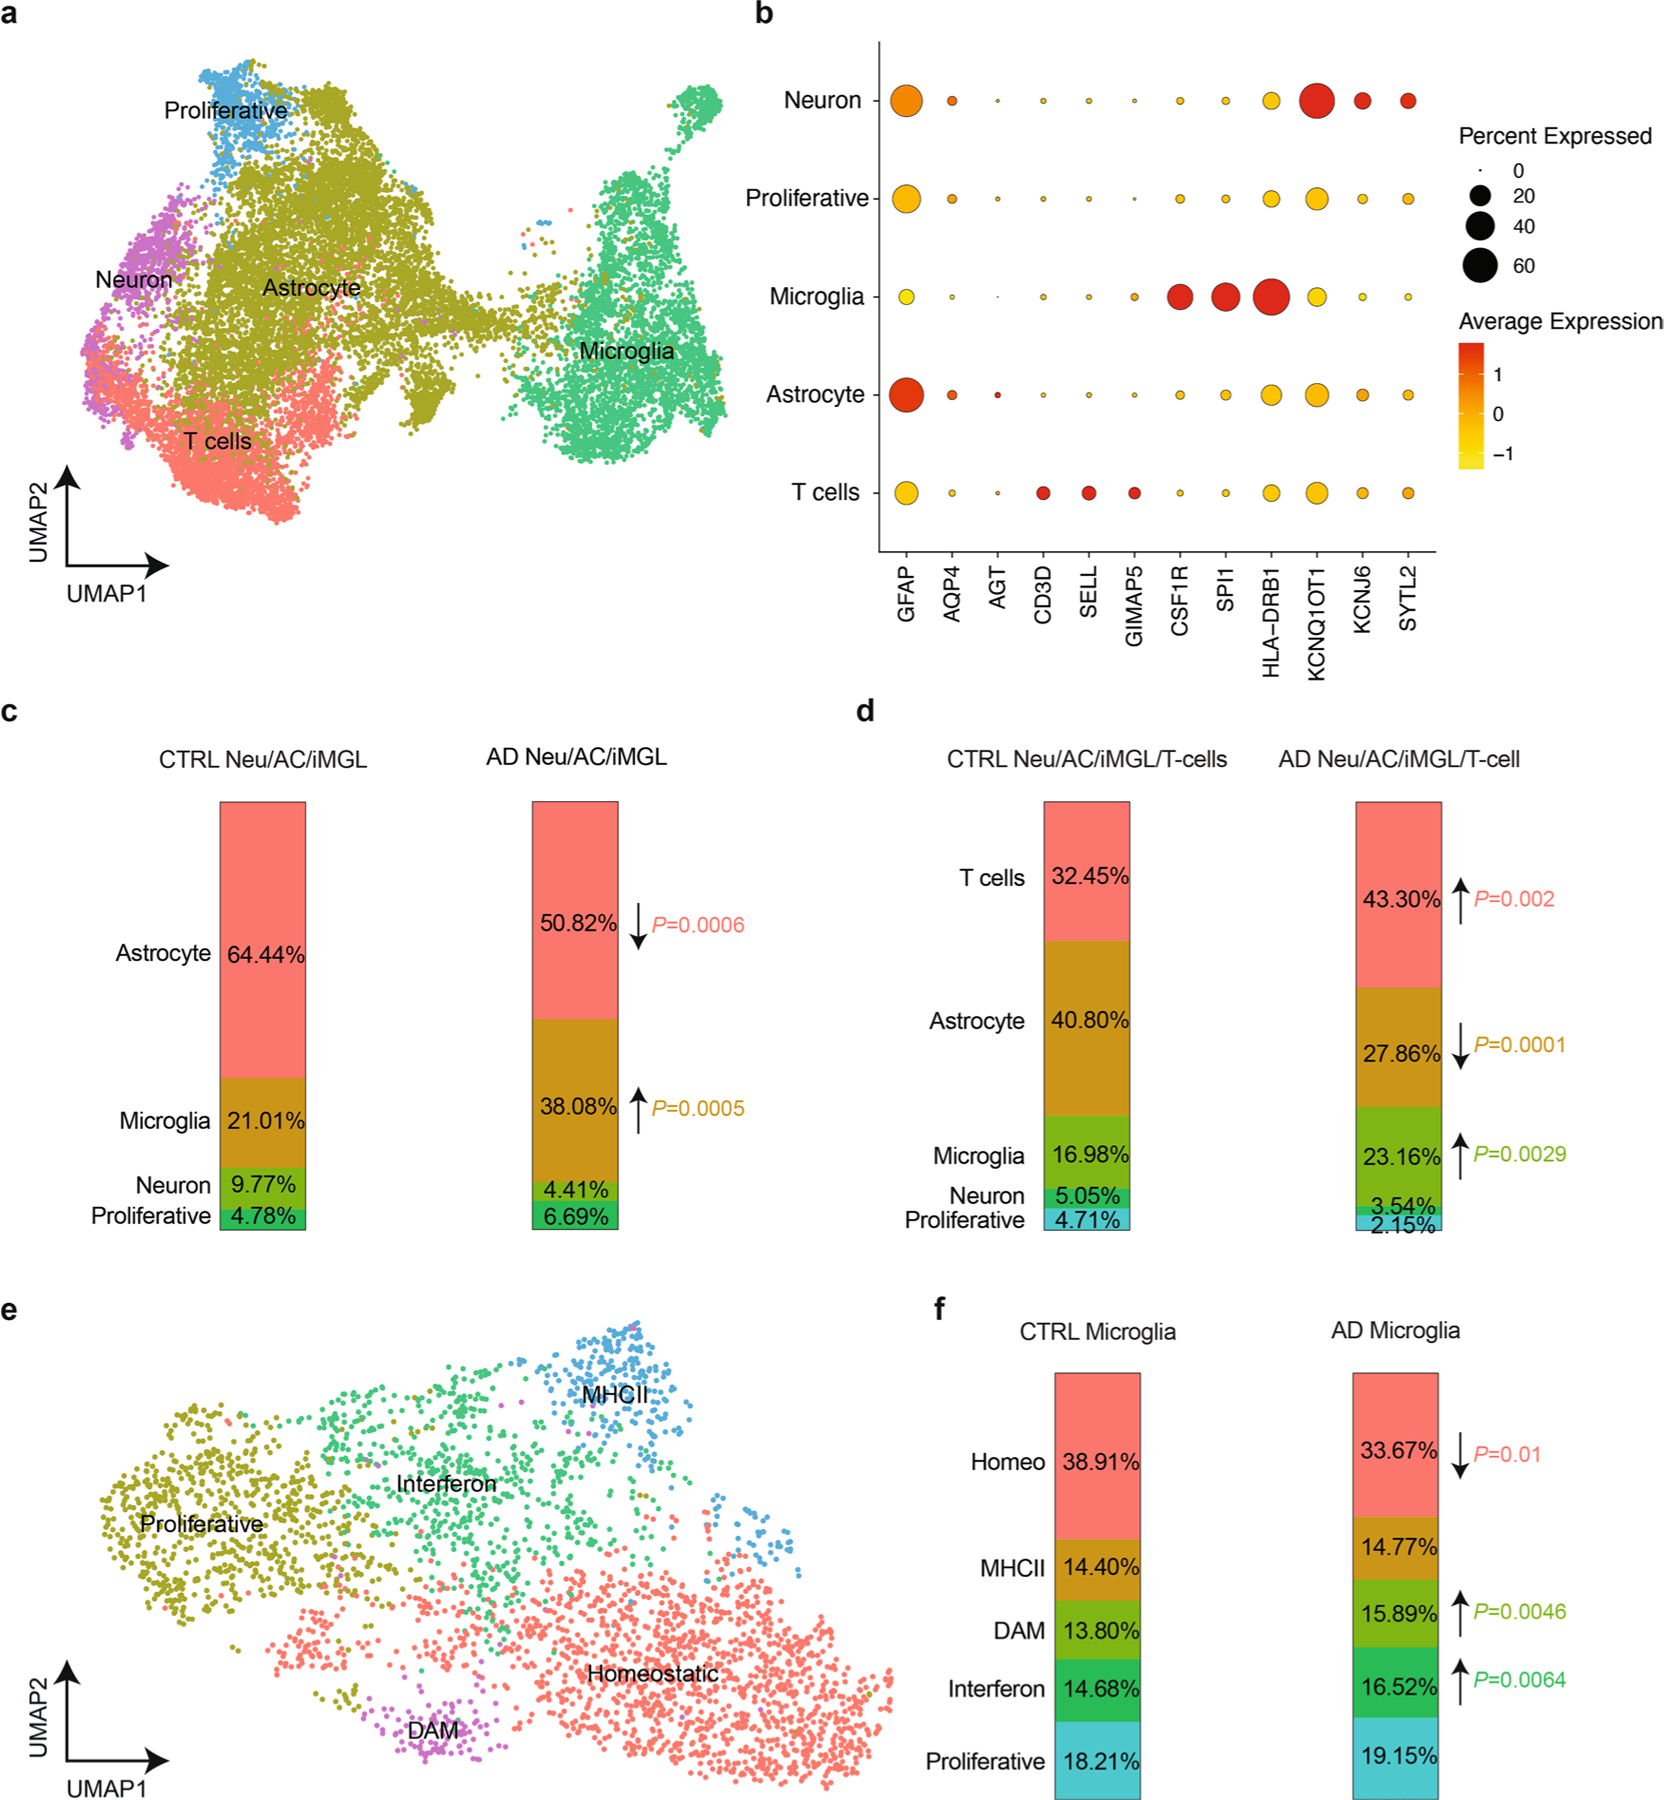
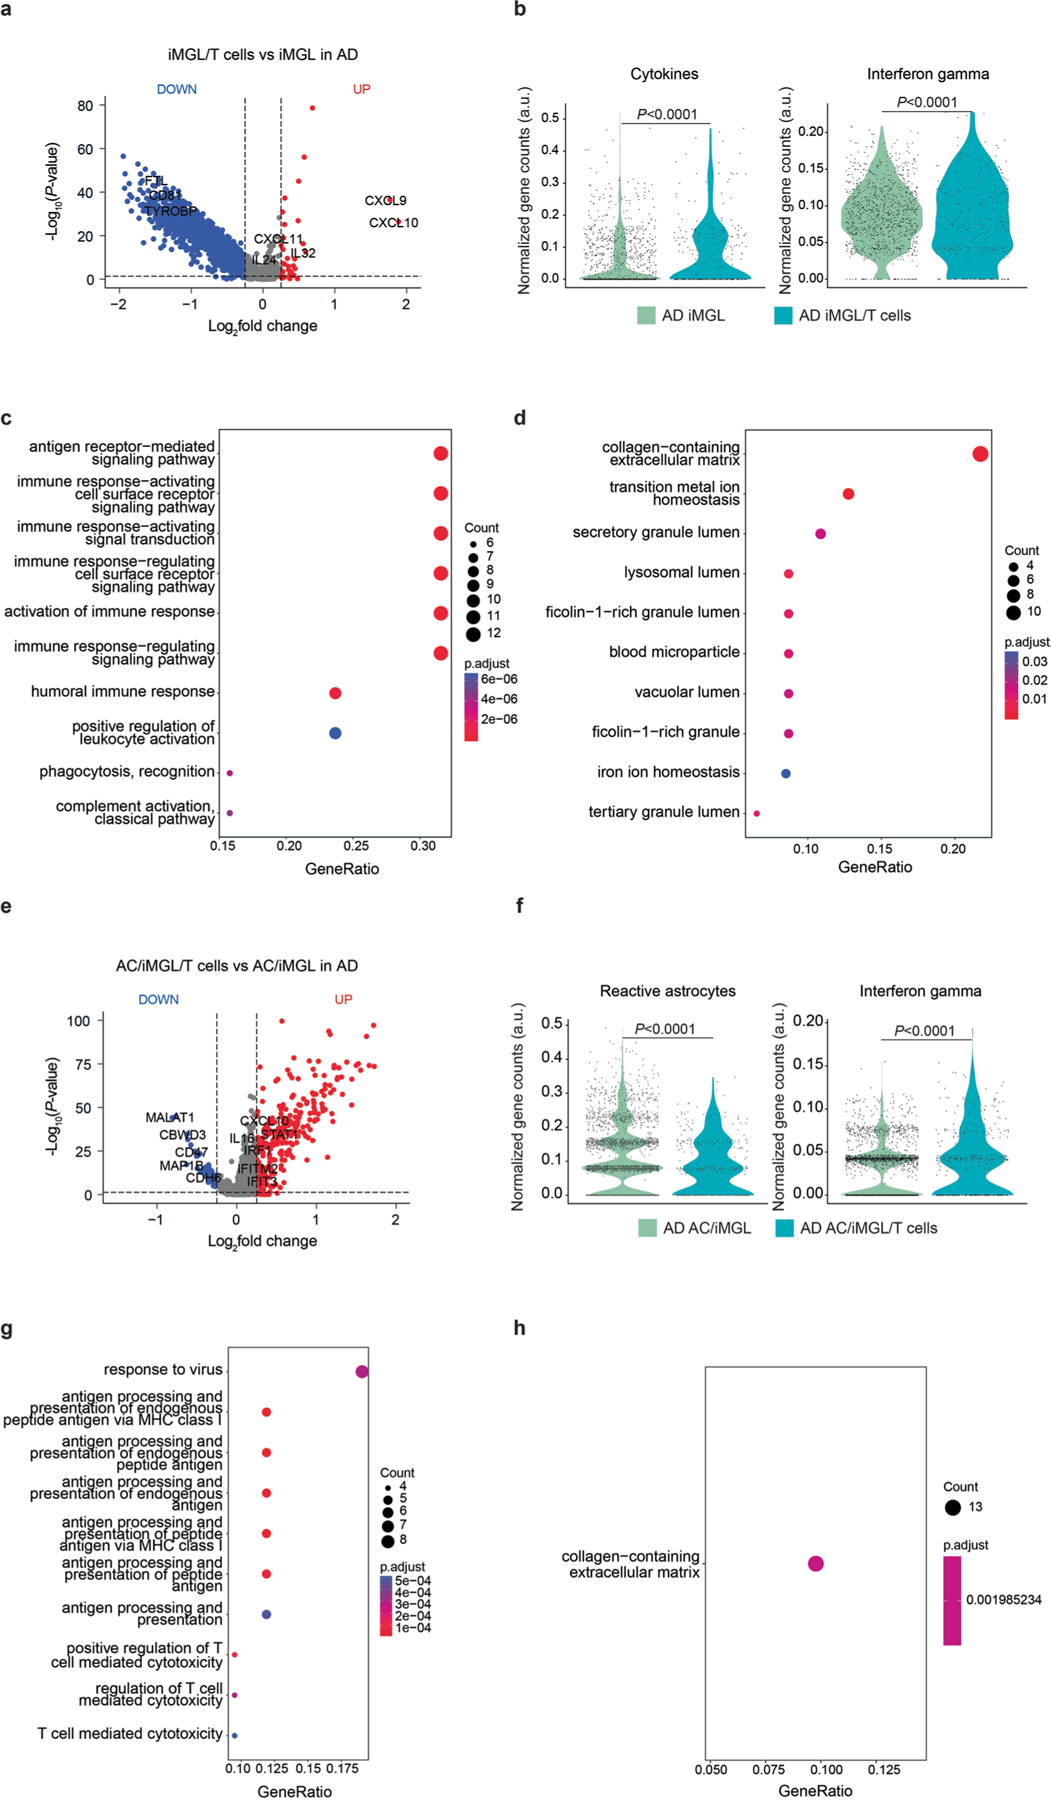
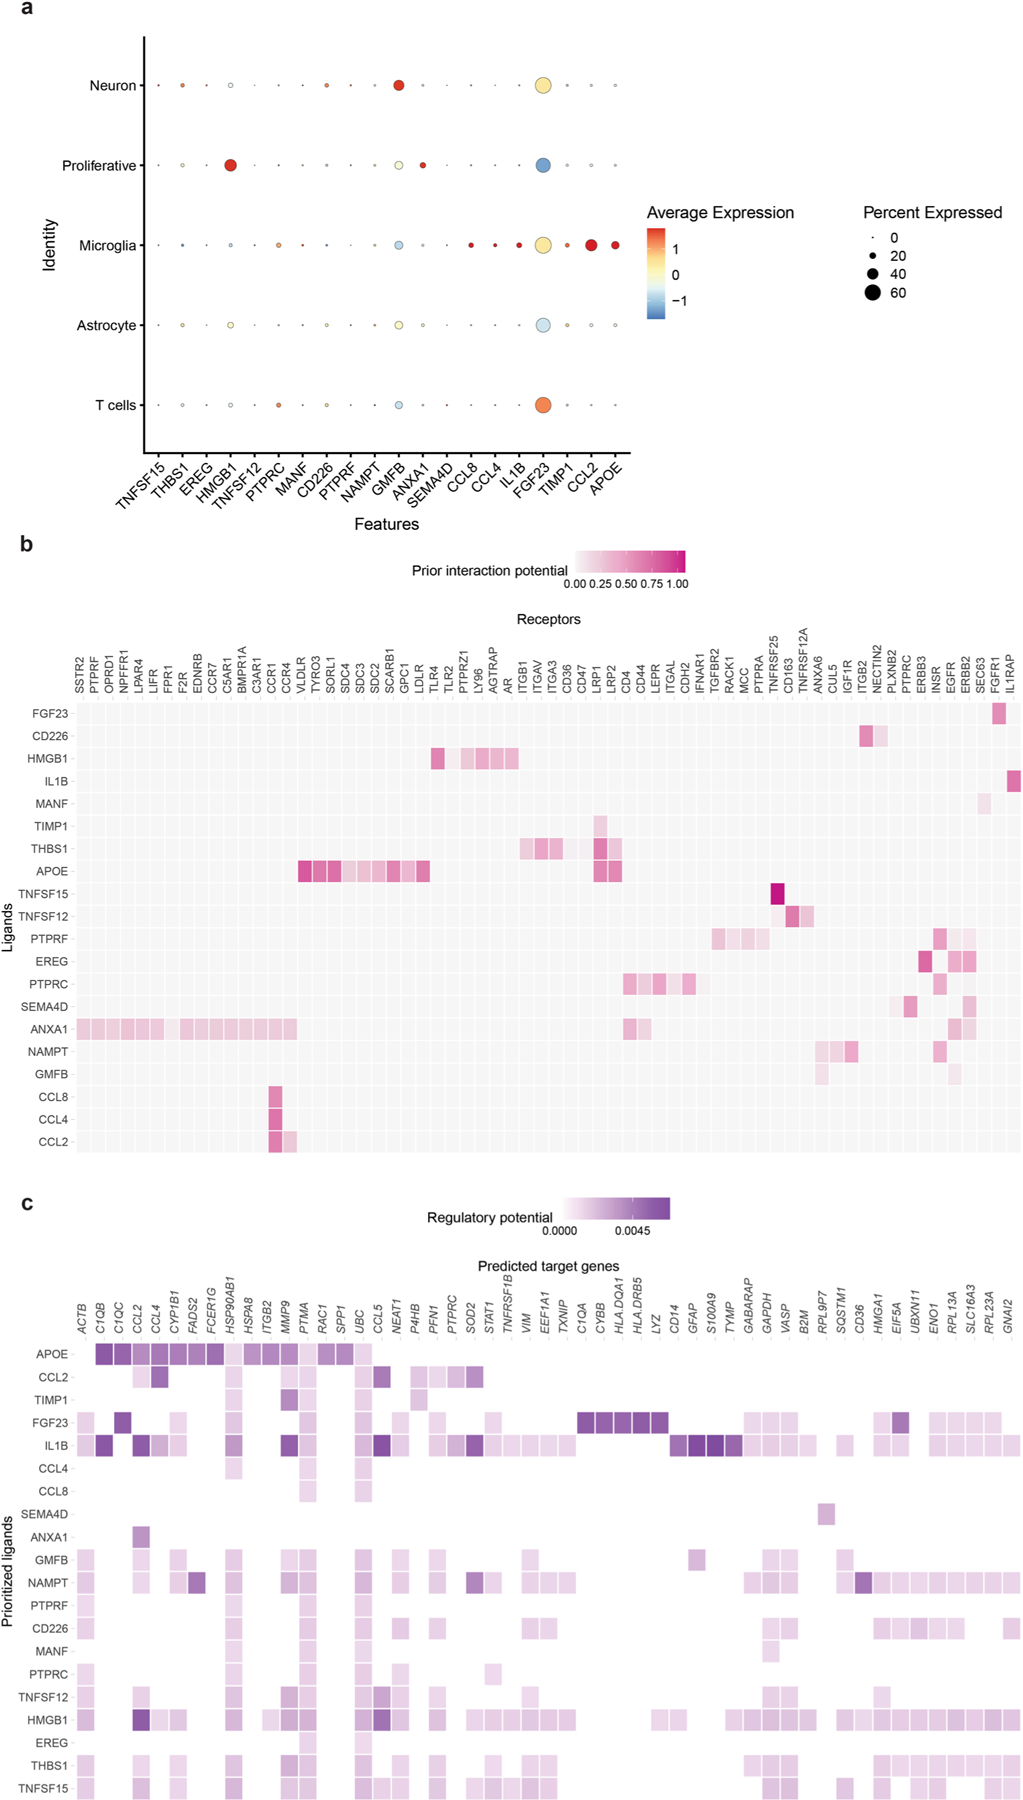
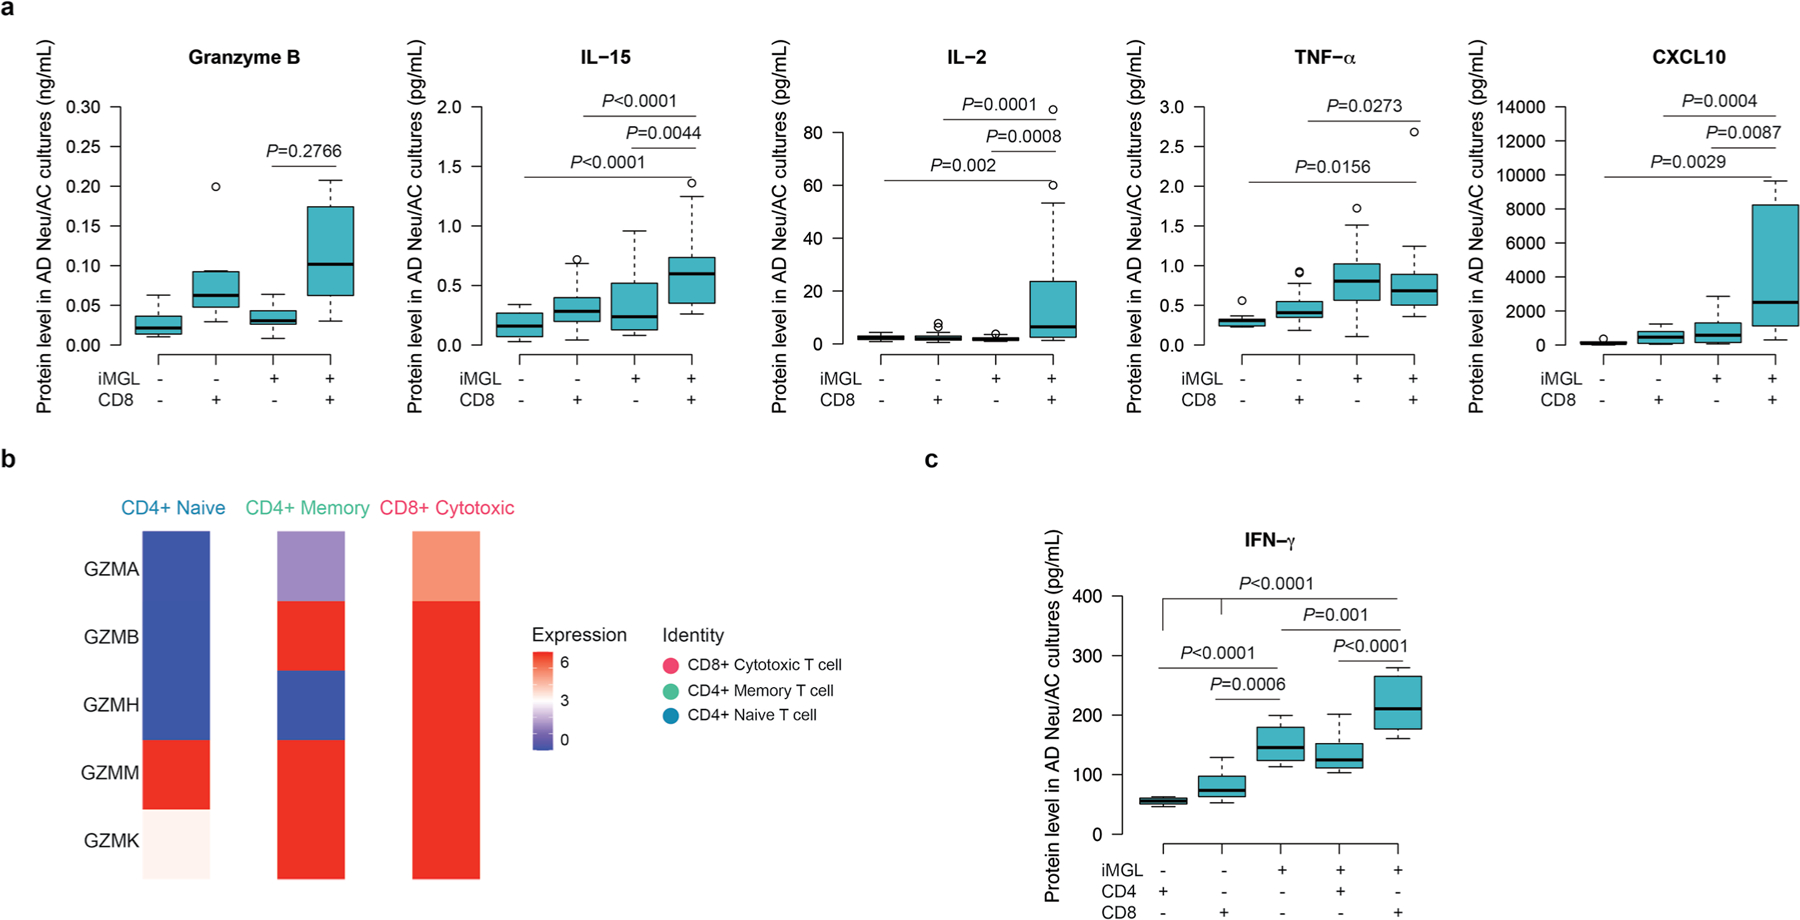
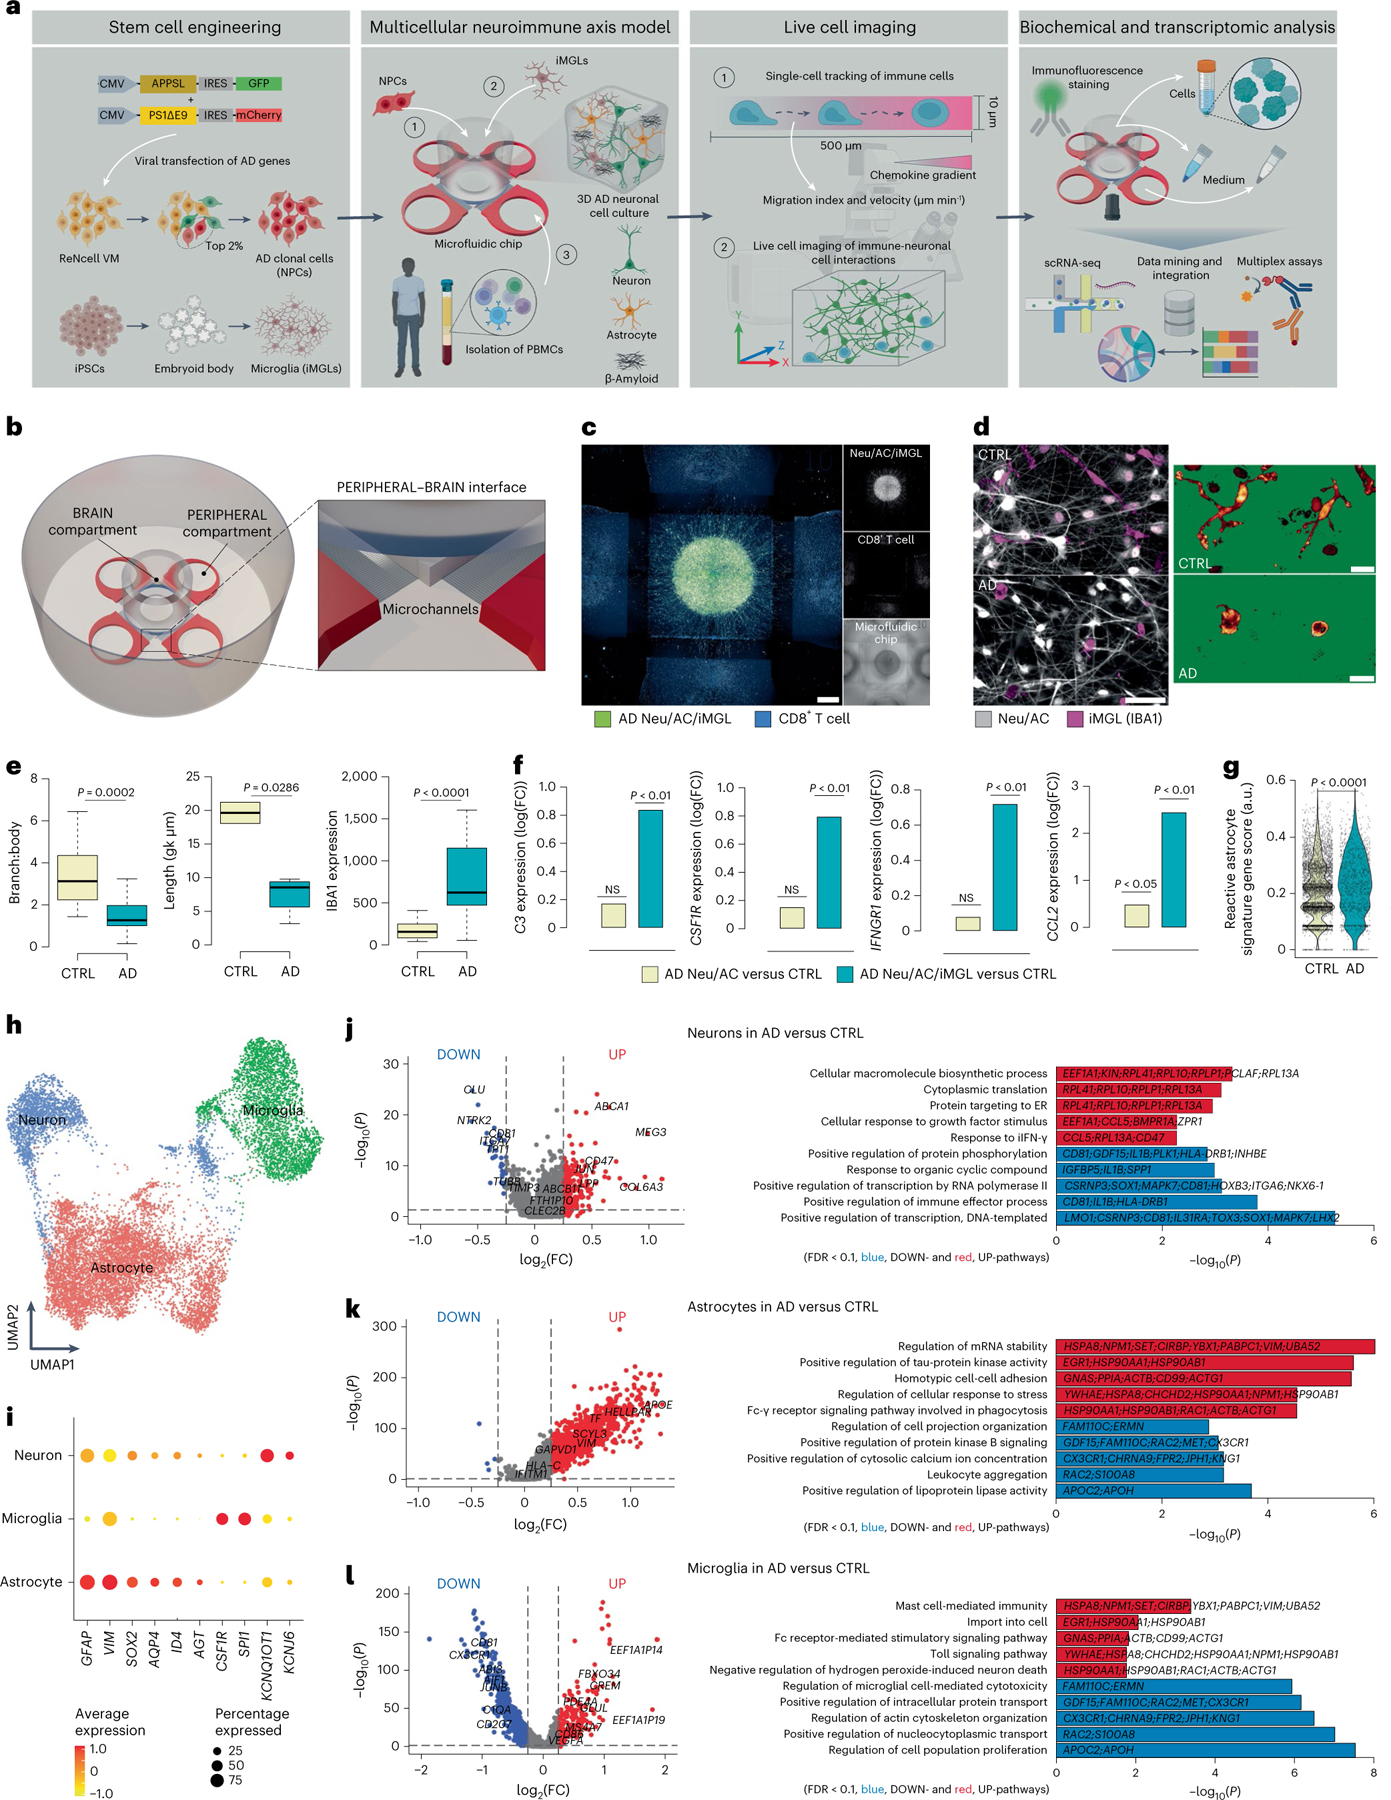
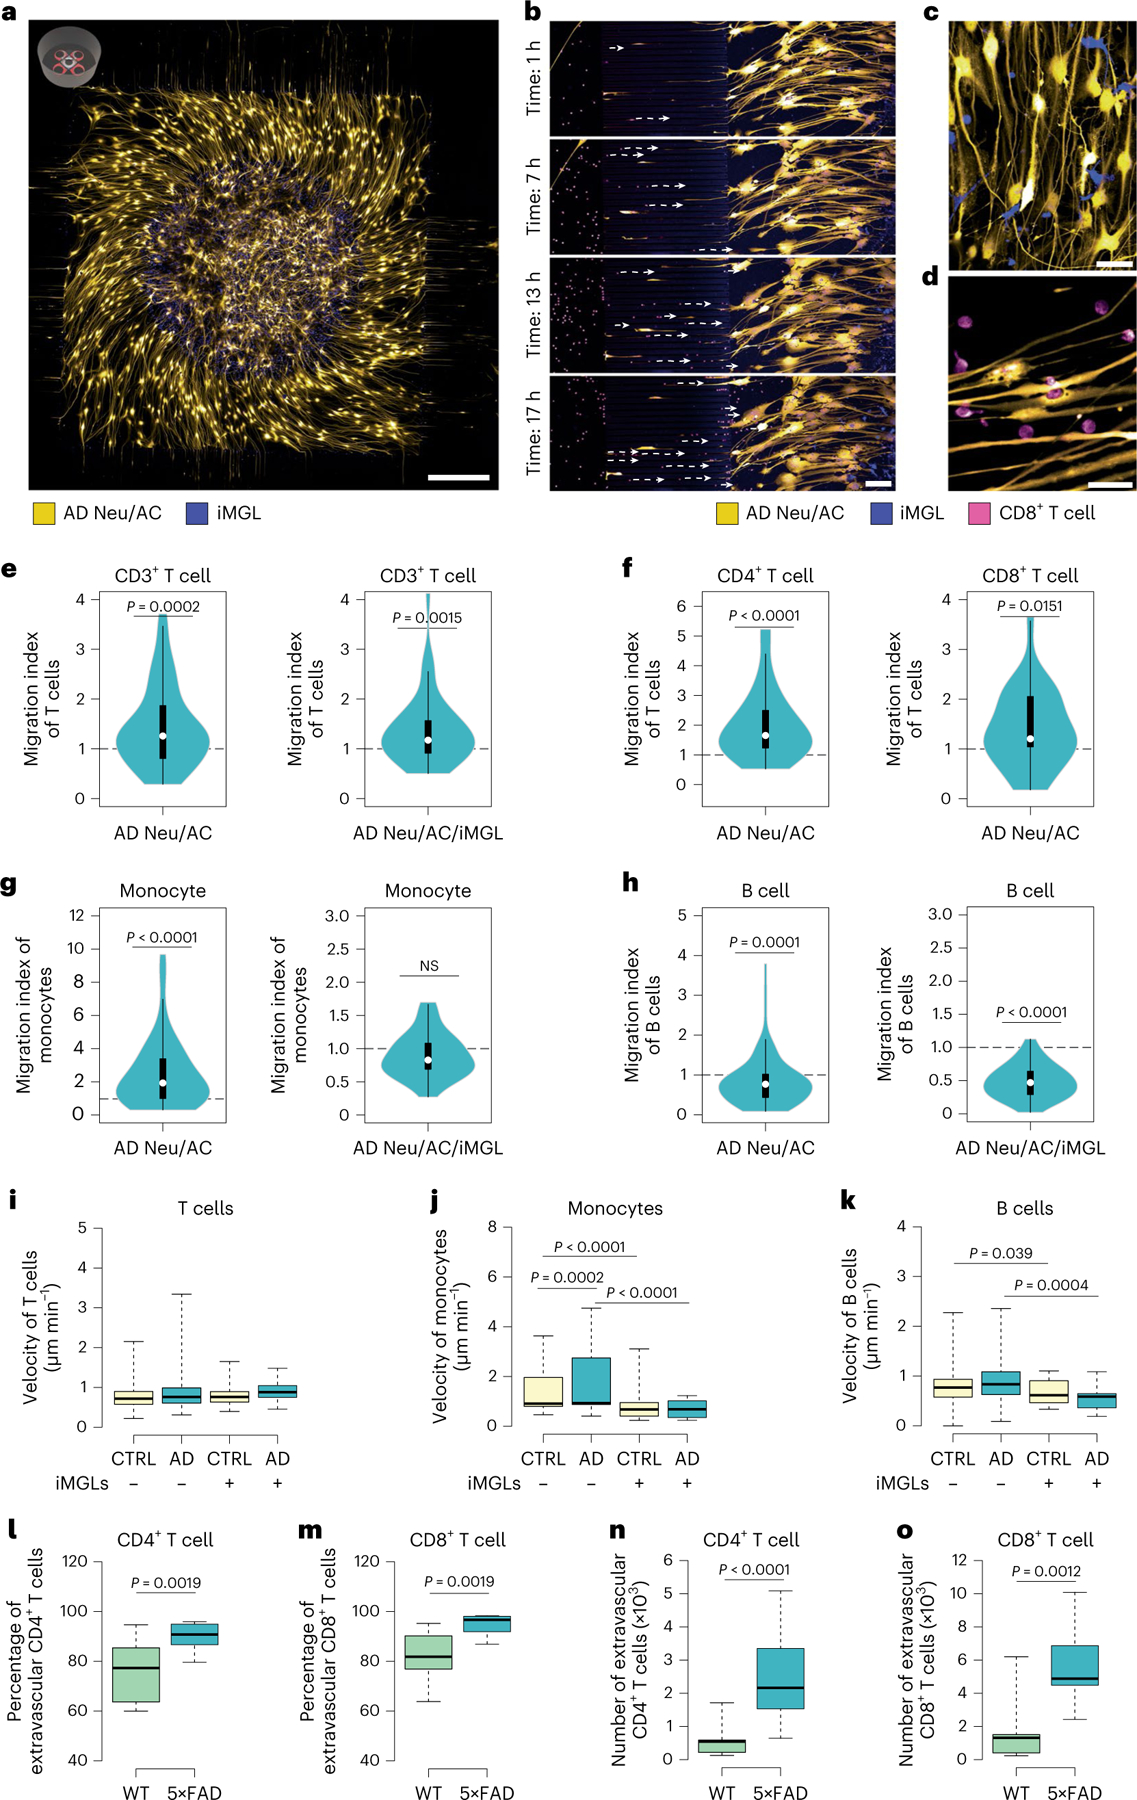
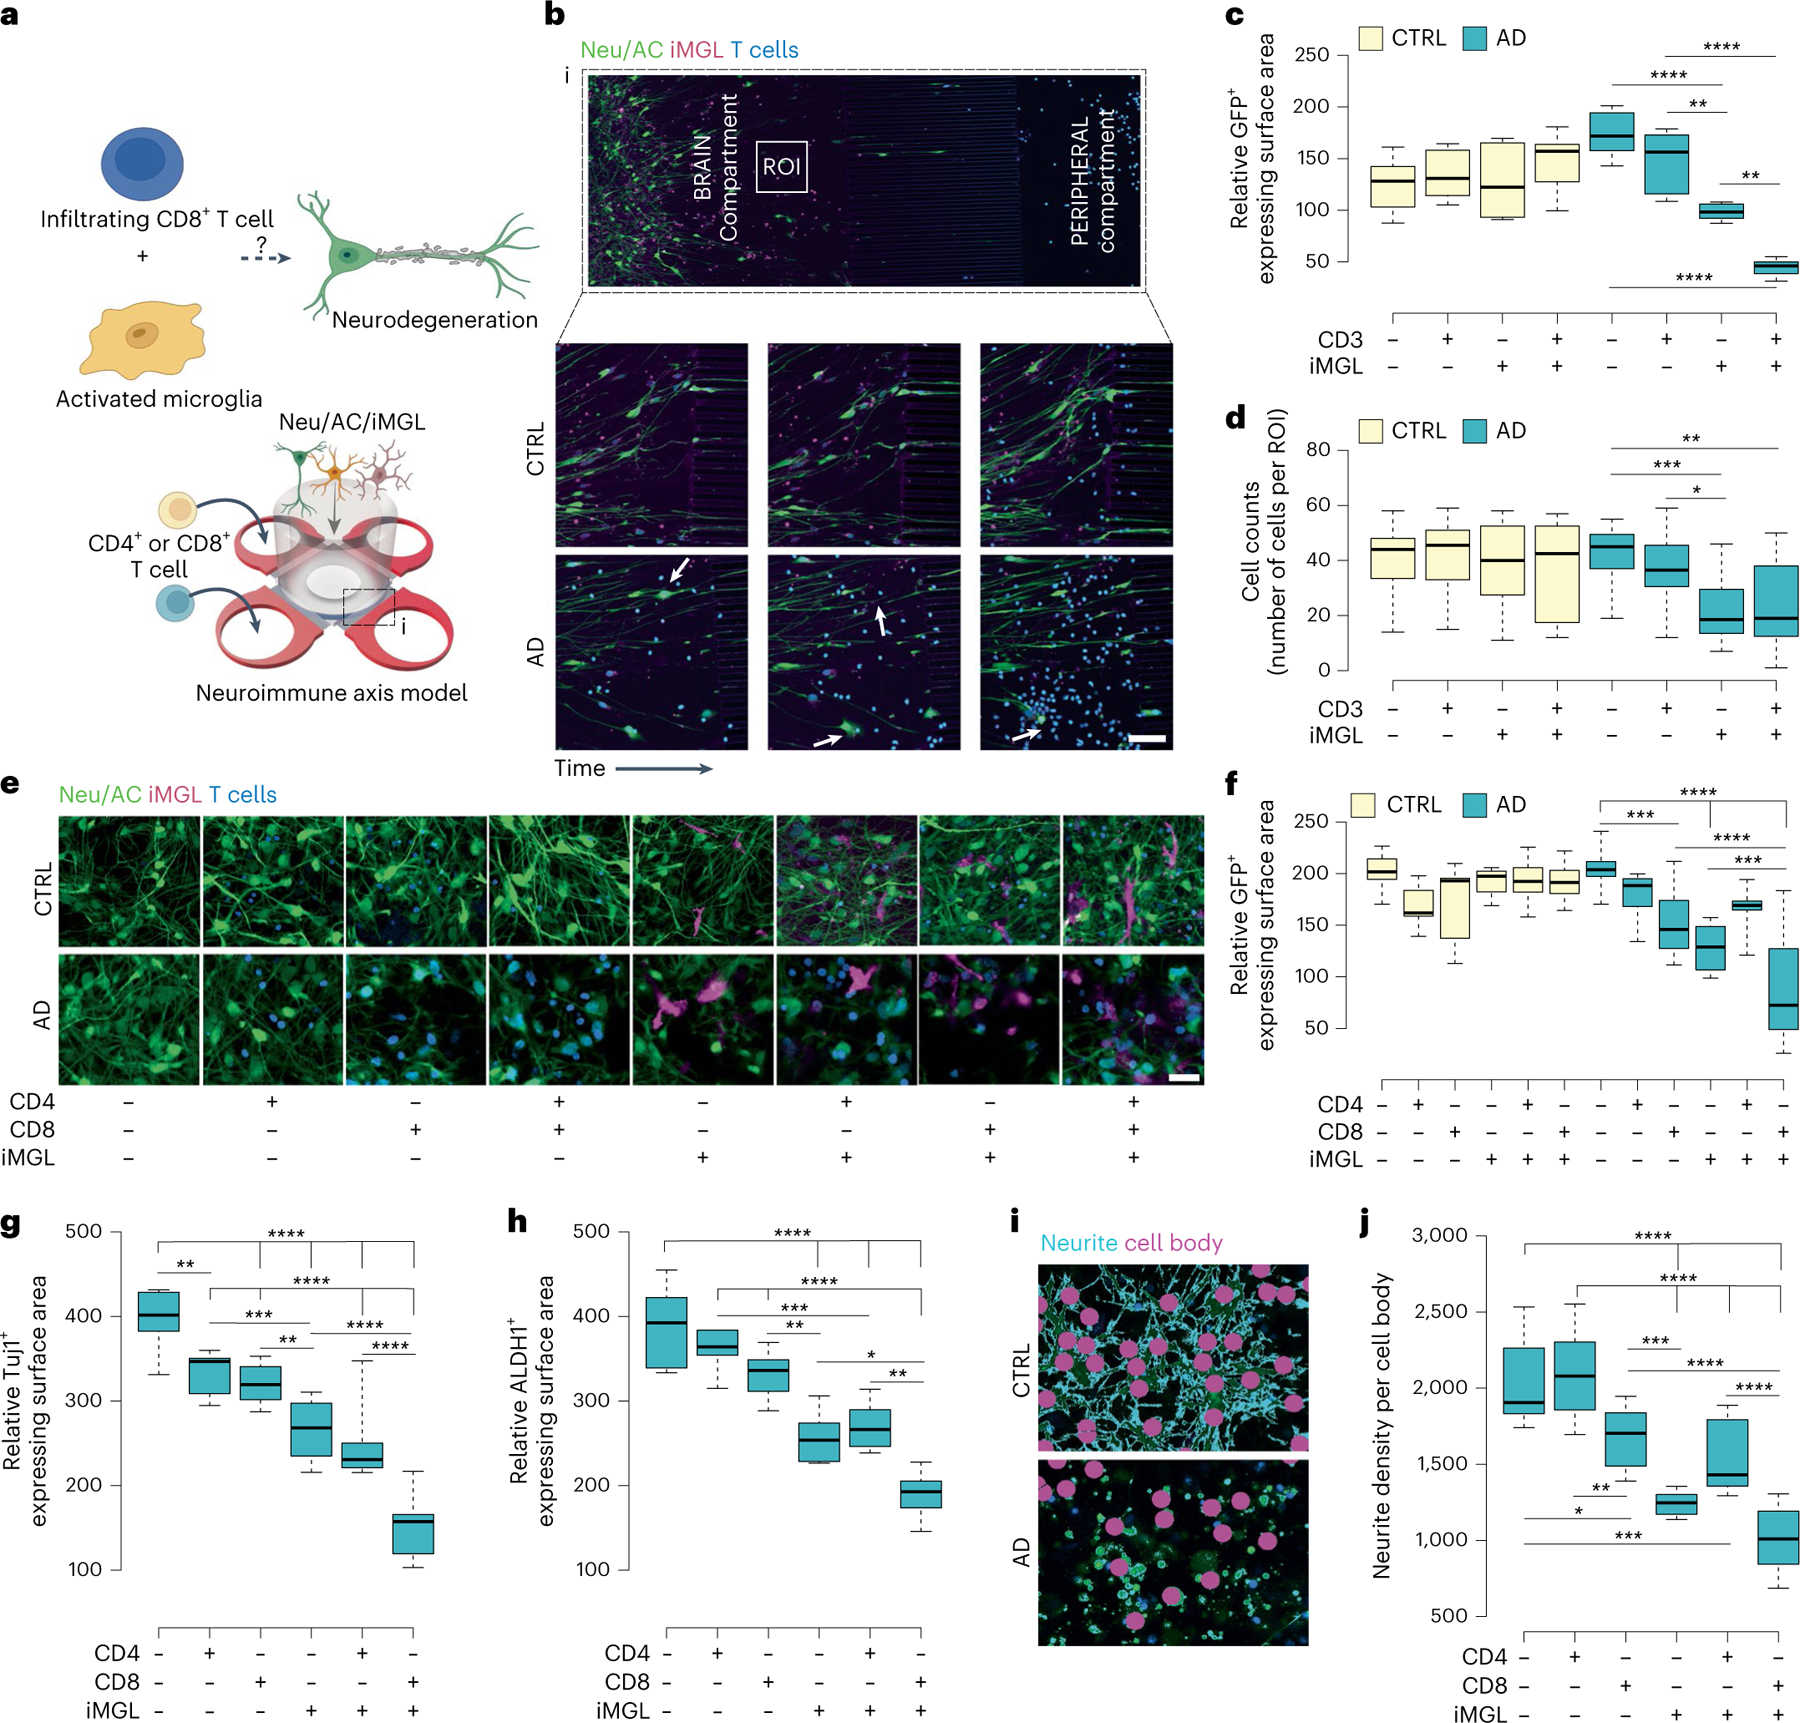
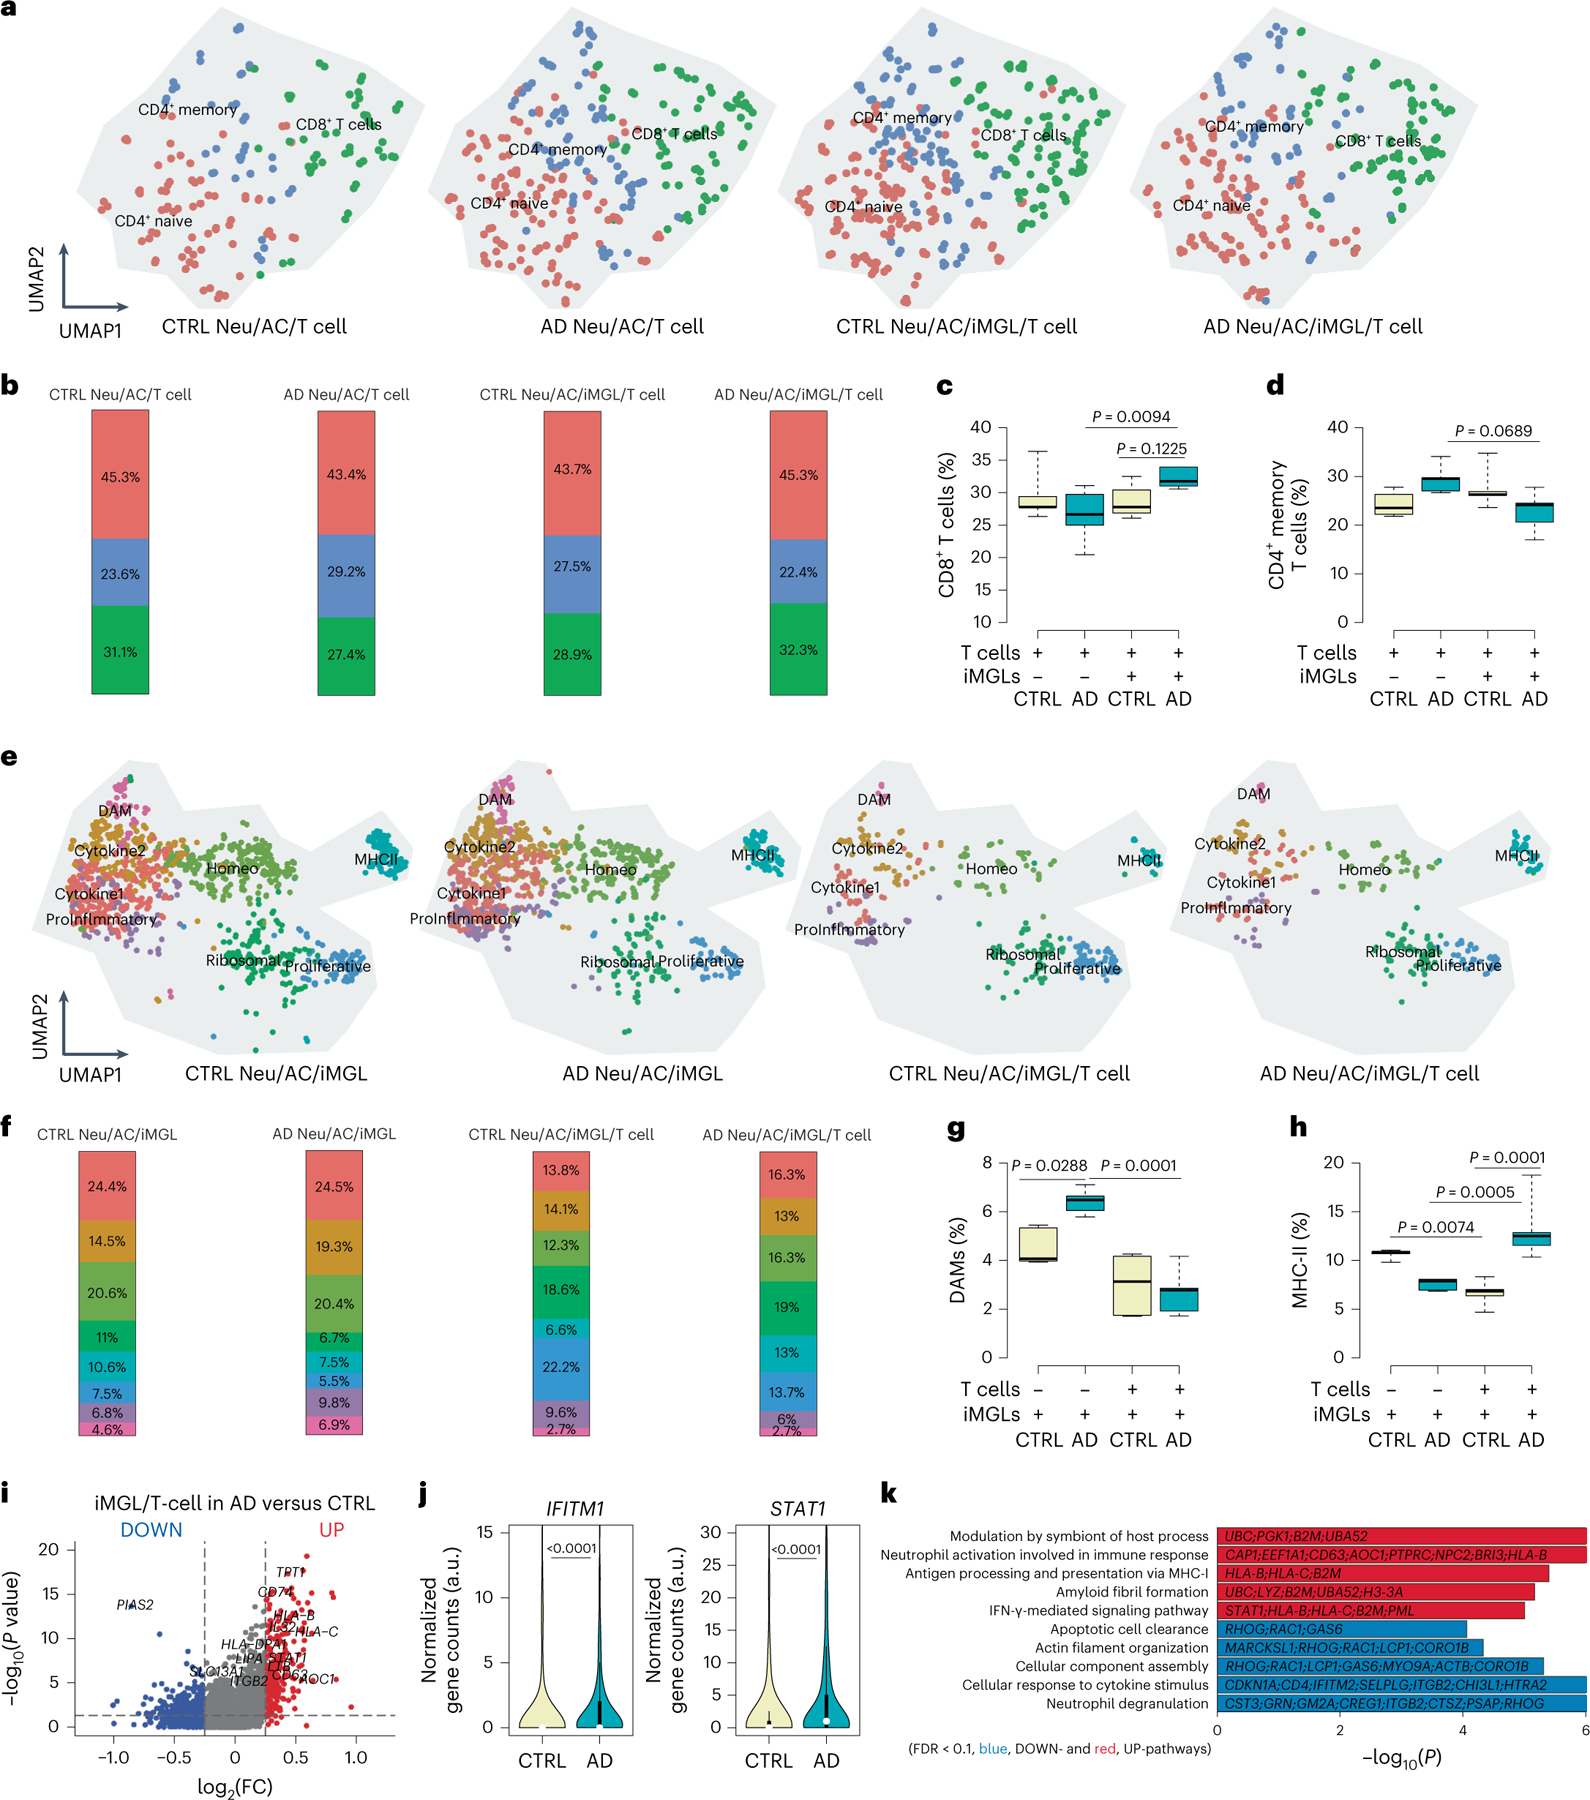
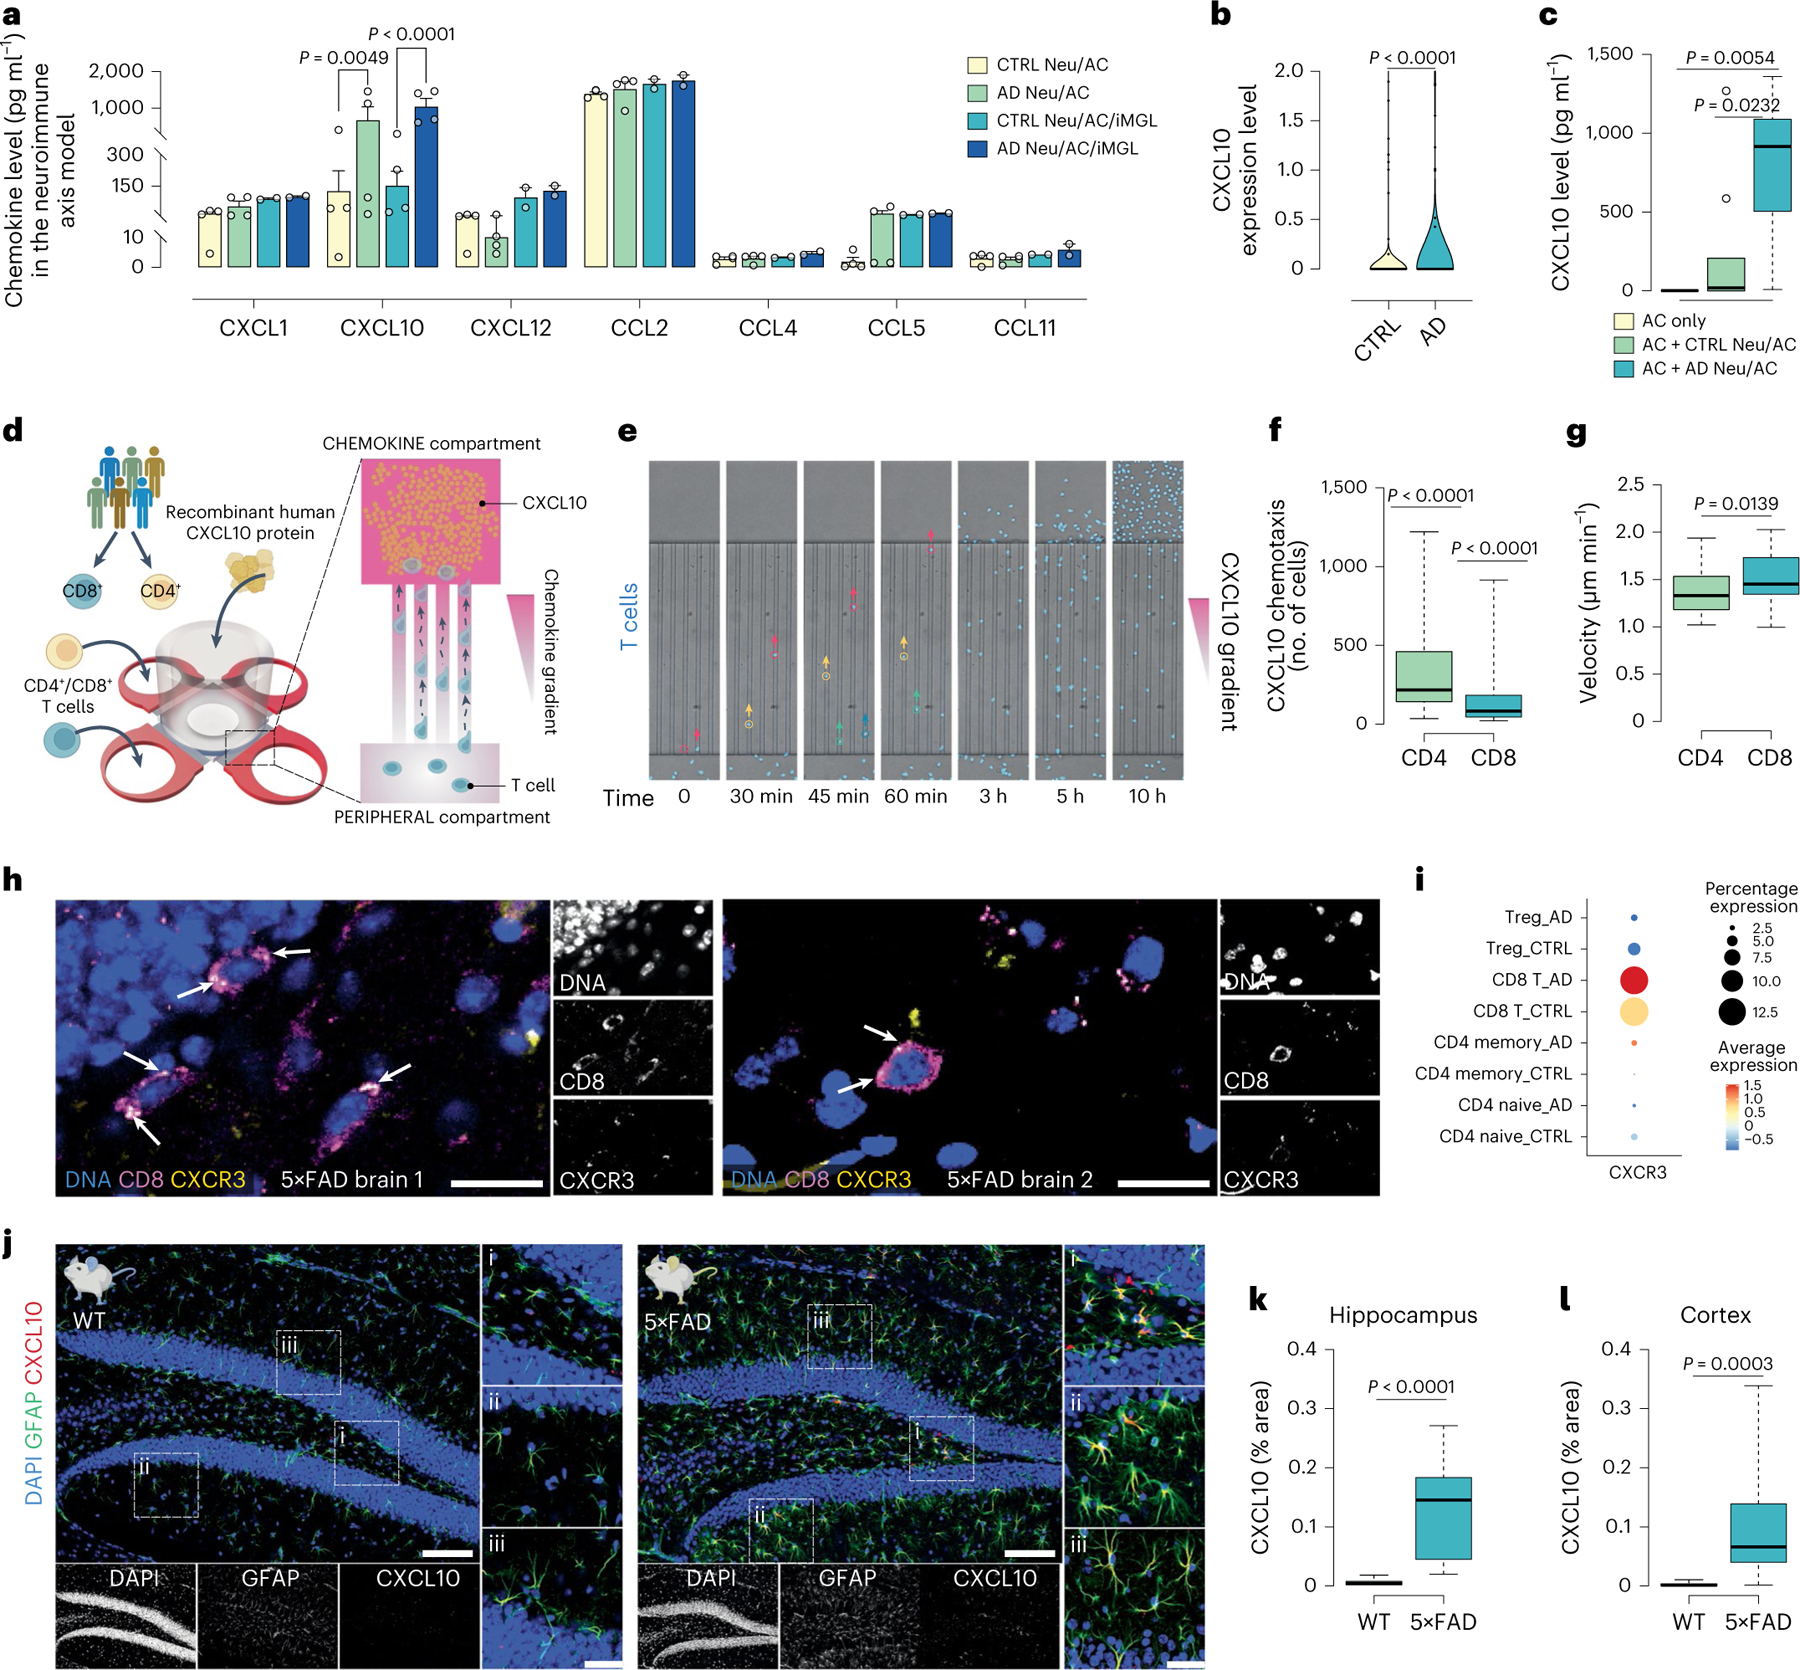
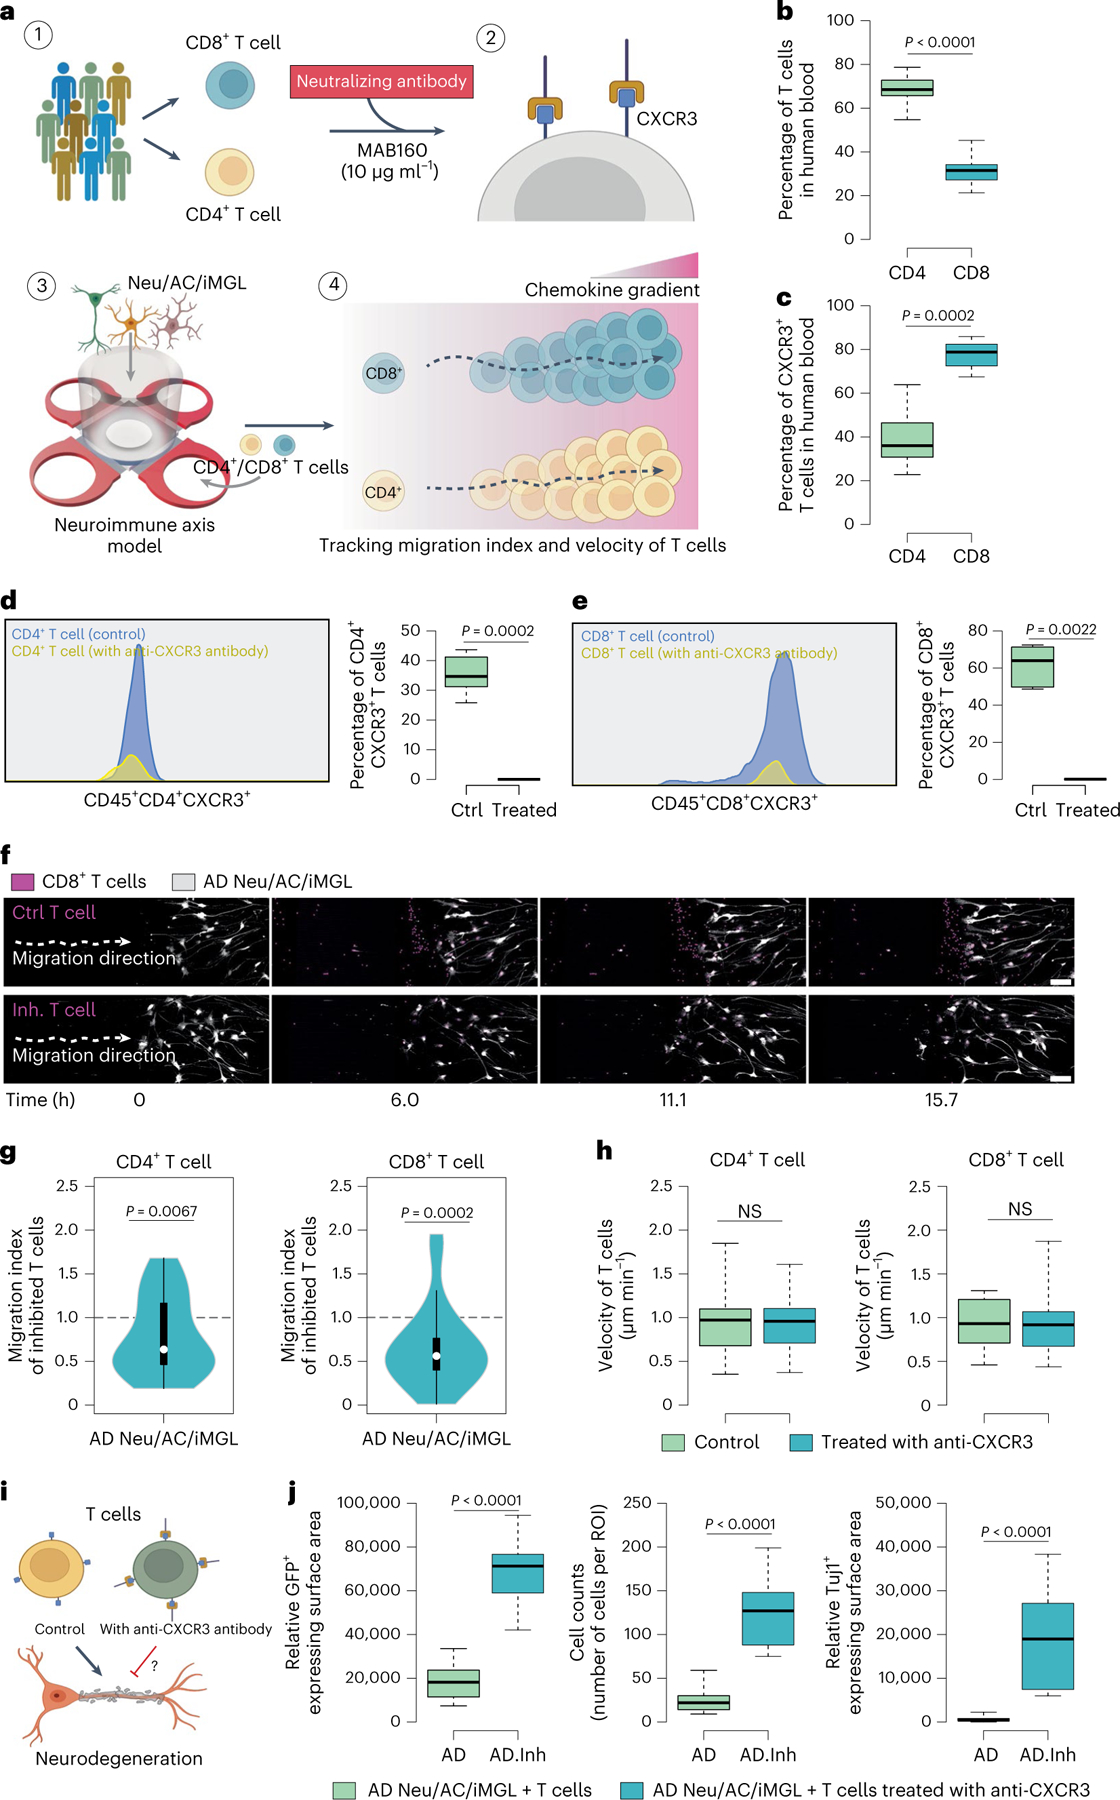
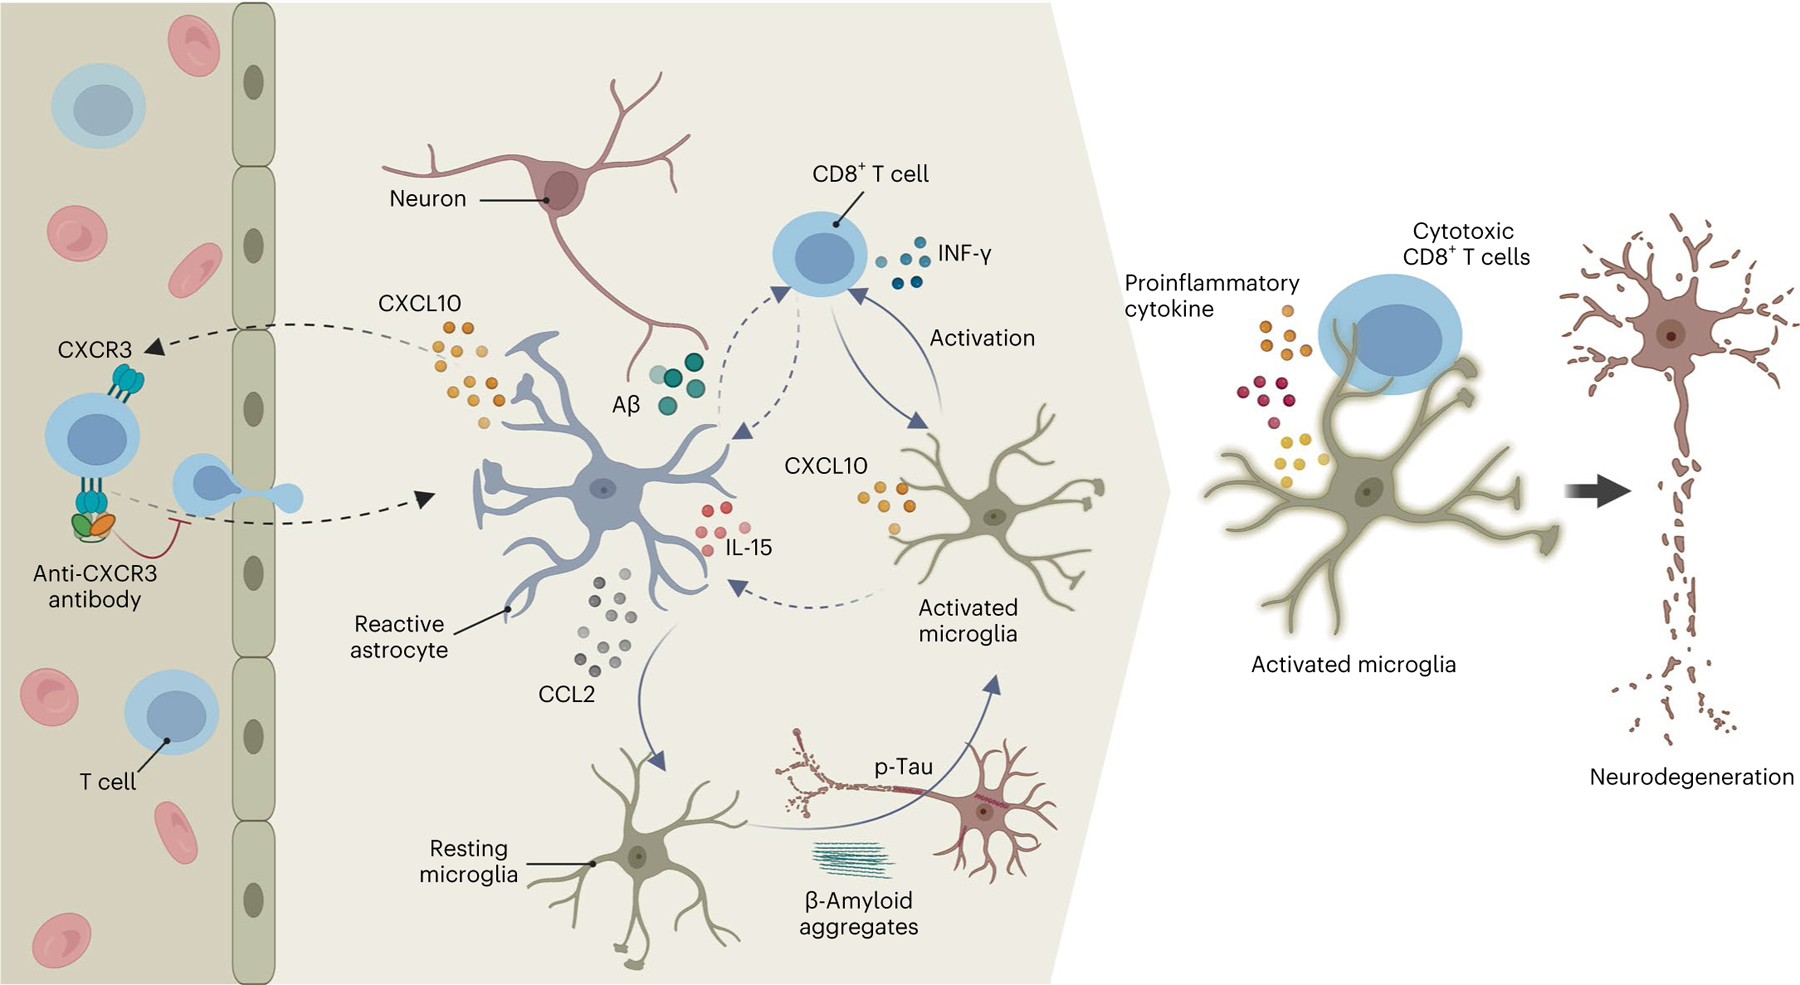
Brain infiltration of peripheral immune cells and their interactions with brain-resident cells may contribute to Alzheimer's disease (AD) pathology. To examine these interactions, in the present study we developed a three-dimensional human neuroimmune axis model comprising stem cell-derived neurons, astrocytes and microglia, together with peripheral immune cells. We observed an increase in the number of T cells (but not B cells) and monocytes selectively infiltrating into AD relative to control cultures. Infiltration of CD8+ T cells into AD cultures led to increased microglial activation, neuroinflammation and neurodegeneration. Using single-cell RNA-sequencing, we identified that infiltration of T cells into AD cultures led to induction of interferon-γ and neuroinflammatory pathways in glial cells. We found key roles for the C-X-C motif chemokine ligand 10 (CXCL10) and its receptor, CXCR3, in regulating T cell infiltration and neuronal damage in AD cultures. This human neuroimmune axis model is a useful tool to study the effects of peripheral immune cells in brain disease.


Conflict of interest statement

Competing interests

The authors declare no competing interests.

Figures

Extended Data Fig. 1 |
Extended Data Fig. 1 |. Characterization of the PiChip model.
a, 3D illustration of three different layers of the microfluidic-based PiChip system. Layer I consists of an orthogonal array of 400 microgrooves of 10 μm height and width and 500 μm length. Layer II consists of BRAIN and four PERIPHERAL compartments of 100 μm height. Layer III consists of a cylindrical chamber with 6000 μm length and radius and 2500 μm open hollow. The top and bottom panels show low and high magnification of each layer, respectively. b, Representative immunofluorescence staining of 3D-differentiated neurons (MAP-2; blue) and astrocytes (GFAP; red) in AD and CTRL cultures after four weeks of differentiation. Scale bar, 100 μm. c, d, Quantification of MAP-2 (c) and GFAP+ (d) expressing surface area in AD and CTRL cultures (n = 4 independent ROIs for each MAP2+ and GFAP+ CTRL, n = 5 independent ROIs for each MAP2+ and GFAP+ AD; P-values from unpaired, two-sided, t-test). eh, Quantification of soluble Aβ38 (e), Aβ40 (f), Aβ42 (g) and Aβ42/40 ratio (h) in AD and CTRL cultures after four weeks of differentiation (n = 4 cell cultures from two independent experiments; P-values from unpaired, two-sided, t-test with Welch’s correction). i, Representative immunofluorescence staining of p-Tau (PHF-1; blue) in neuronal cell bodies and neurites (GFP; green) in AD and CTRL cultures. Scale bar, 50 μm. j, Quantification of PHF-1+ expressing surface area in AD and CTRL cultures (n=6 ROIs from at least 5 independent experiments; P-values from nonparametric, two-sided, Mann-Whitney test). k, UMAP visualization of a total of 20153 single cells from AD and CTRL cultures by single-cell transcriptome profiles. Distinct cell types are depicted with different colors. l, Volcano plot of differentially expressed genes in astrocytes in AD Neu/AC/iMGL versus AD cultures lacking iMGL (P-values from Wilcoxon Rank Sum test). Significantly upregulated (P < 0.05 and FC > 0.1) and downregulated (P < 0.05 and FC < 0.1) genes are shown in red and blue dots, respectively. m, Violin plot of highly enriched C3 gene in astrocytes in AD Neu/AC/iMGL compared to CTRL (n = 5 independent scRNA-seq data; P-values from nonparametric, two-sided, Mann-Whitney test). n, Vioin plots of selected significantly enriched genes associated with reactive astrocytes (VIM and GFAP) in AD Neu/AC/iMGL compared to AD cultures lacking iMGL (n = 5 independent single cell RNAseq data; P-values from nonparametric, two-sided, Mann-Whitney test). o, Violin plots of highly enriched genes associated with reactive astrocytes and interferon-γ in astrocytes in AD Neu/AC/iMGL compared to AD cultures lacking iMGL (n = 5 independent scRNA-seq data; P-values from nonparametric, two-sided, Mann-Whitney test). (ch, j) In boxplots, the center lines show the medians; box limits indicate the 25th and 75th percentiles; whiskers extend to minimum and maximum values. (m, n) White circles show the medians; box limits indicate the 25th and 75th percentiles; whiskers extend 1.5 times the interquartile range from the 25th and 75th percentiles; polygons represent density estimates of data and extend to extreme values.
Extended Data Fig. 2 |
Extended Data Fig. 2 |. Increasing number of extravascular CD4+ and CD8+ T cells in 5XFAD brains.
a, Representative flow cytometry plots illustrating the gating of CD45+CD11b- cells, CD45_FITC negative CD4+ and CD8+ T cells. b, Quantification of the percentages and absolute numbers of CD45+CD11b- non-myeloid cells. FITC, Fluorescein isothiocyanate (n = 12 each for WT and 5XFAD mice; P-values from nonparametric, two-sided, Mann-Whitney test). c, Representative flow cytometry plots illustrating the gating of CD4+ and CD8+ T cells among all CD45+ extravascular non-myeloid cells. d, Quantification of the percentages of CD4+ and CD8+ T cells among all CD45+ extravascular non-myeloid cells in 5XFAD mice (n = 9 WT and 5XFAD mice each; P-values from nonparametric, two-sided, Mann-Whitney test). (b, d) In boxplots, the center lines show the medians; box limits indicate the 25th and 75th percentiles; whiskers extend to minimum and maximum values.
Extended Data Fig. 3 |
Extended Data Fig. 3 |. Infiltrating T cells exacerbate neuronal damage in the presence of microglia in AD.
a, Time-lapse confocal imaging showing neurite cleavage in AD cultures. Scale bar, 100 μm. The circled area shows depletion of cells (GFP+ cells) in the presence of microglia and T cells in AD condition. b, Box plots represent quantification of neuronal (MAP2+ expressing surface area) damage in AD Neu/AC (+/−) iMGL conditions in the presence of CD4+ or CD8+ T cells (n = 10 independent ROIs from 4 independent experiments; P-values from two-way ANOVA with Tukey multiple comparisons tests). c, Box plots represent quantification of neuronal damage using ELISA assay for Tuj1 in AD Neu/AC (+/−) iMGL conditions in the presence of CD3+ T cells (n = 4 independent experiments; P-values from nonparametric, Kruskal-Wallis test with Dunn’s multiple comparisons test). d, Box plots represent quantification of calcium dynamics in AD cultures in the presence of T cells compared to CTRL, as monitored using Cal-520 AM, a Ca2+ indicator (n = 251 independent ROIs, CTRL and n = 222, AD from 5 independent experiments; P-values from nonparametric, two-sided, Mann-Whitney test). (bd) In the boxplots, the center lines show the medians; box limits indicate the 25th and 75th percentiles; whiskers extend to minimum and maximum values.
Extended Data Fig. 4 |
Extended Data Fig. 4 |. Summary of scRNA-seq data, selected identity gene expression and gene ontology of significantly enriched genes.
a, UMAP visualization of the cell-type composition of the PiChip cultures by single-cell transcriptome profiles. Distinct cell types are depicted with different colors. b, Dot plot of identity genes for distinct cell types. Color scale (a.u.) indicates the average of expression of identity genes in each cell population, and dot size is proportional to the percentage of cells expressing the identity genes. c, Number of significantly upregulated (FDR < 0.2 and FC > 0) and downregulated (FDR < 0.2 and FC < 0) genes across distinct cell types. Significantly upregulated genes are depicted in red, while downregulated are in blue. d, Volcano plots of differentially expressed genes in all cell types in AD cultures versus CTRL. Significantly upregulated (P < 0.05 and FC > 0.1) and downregulated (P < 0.05 and FC < 0.1) genes are shown in red and blue dots, respectively (P-values from Wilcoxon Rank Sum test). e, Gene ontology of significantly upregulated pathways in all cell types in AD versus CTRL. From left to right, the order of conditions is the same as in d. Color scale indicates the adjusted P-value for significantly enriched pathways in each cell population. f, Gene ontology/network analysis of significantly upregulated genes (P < 0.05 and FC > 0.1). Top five category was visualized for associated genes and pathways. g, Gene ontology of significantly downregulated pathways in all cell types in AD versus CTRL. From left to right, the order of conditions is the same as in d. Color scale indicates the adjusted P-value for significantly enriched pathways in each cell population. h, Gene ontology/network analysis of significantly downregulated genes (P < 0.05 and FC < 0.1). Top five category was visualized for associated genes and pathways (e-h, P-values were calculated from a Fisher exact test and the adjusted p-values given by Benjamini & Hochberg method).
Extended Data Fig. 5 |
Extended Data Fig. 5 |. Altered proportions of neurons, astrocytes and microglia in AD cultures and upon infiltration of T cells.
a, UMAP visualization of the cell-type composition of the PiChip cultures by single-cell transcriptome profiles. Distinct cell types are depicted with different colors. b, Dot plot of identity genes for distinct cell types. Color scale (a.u.) indicates the average of expression of identity genes in each cell population, and dot size is proportional to the percentage of cells expressing the identity genes. c, Compositional changes of neurons, astrocytes, microglia in AD Neu/AC/iMGL and CTRL cultures (P-values were calculated from the Ward test and the FDR indicates the adjusted p-values given by Benjamini & Hochberg method). d, Compositional changes of neurons, astrocytes, microglia and T cells in AD Neu/AC/iMGL (+/−) T cell and CTRL conditions (P-values were calculated from the Ward test and the FDR indicates the adjusted p-values given by Benjamini & Hochberg method). e, UMAP visualization of T cell-type composition of the PiChip cultures by single-cell transcriptome profiles. Distinct subtypes of microglia (homeostatic, DAM, MHCII, interferon and proliferative) are depicted with different colors. f, Compositional changes of homeostatic, DAM, MHCII, interferon and proliferative microglia in AD vs CTRL conditions (P-values were calculated from the Ward test and the FDR indicates the adjusted p-values given by Benjamini & Hochberg method).
Extended Data Fig. 6 |
Extended Data Fig. 6 |. Interferon-associated pathways are enriched in glial cells following infiltration of T cells in AD.
a, Volcano plot of differentially expressed genes in microglia in the presence of infiltrating T cells in AD cultures compared to AD cultures lacking T cells. Significantly upregulated (P < 0.05 and FC > 0.1) and downregulated (P < 0.05 and FC < 0.1) genes are shown in red and blue dots, respectively (P-values from Wilcoxon Rank Sum test). b, Violin plots of highly enriched genes associated with cytokines (ARF1, CXCL9, CXCL10, CXCL16, CXCL8, CXCL14, CXCL5, IL24, IL32, IL17RA, IL1B, IL10, IL21R, IL18, IL6R, IL7R) and interferon-associated genes (NR1H3, CDC37, OTOP1, HCK, HPX, IRGM, IFNG, IFNGR1, IFNGR2, IRF1, JAK1, JAK2, ARG1, PARP14, PPARG, MED1, PTPN2, SP100, STAT1, TP53, TXK, NR1H2, PARP9, NLRC5, SOCS1, NMI) in microglia in the presence of infiltrating T cells in AD compared to AD cultures lacking T cells (P-values from nonparametric, two-sided, Mann-Whitney test). c, d, Gene ontology of significantly upregulated (c) and downregulated (d) pathways in microglia in the presence of infiltrating T cells in AD cultures vs AD cultures lacking T cells. Color scale indicates the adjusted P-value for significantly enriched pathways in microglia, and dot size is proportional to the count of genes (P-values were calculated from a Fisher exact test and the adjusted p-values given by Benjamini & Hochberg method). e, Volcano plot of differentially expressed genes in astrocytes in the presence of microglia and infiltrating T cells in AD compared to AD cultures lacking T cells. Significantly upregulated (P < 0.05 and FC > 0.1) and downregulated (P < 0.05 and FC < 0.1) genes are shown in red and blue dots, respectively. f, Violin plots of highly enriched genes associated with reactive astrocytes (GFAP, ALDOC, FABP7, TSPO, CRYAB, HSPB1, C3, CHI3L1, NTRK2, S100B, SOX9, STAT3) and interferon-associated genes (NR1H3, CDC37, OTOP1, HCK, HPX, IRGM, IFNG, IFNGR1, IFNGR2, IRF1, JAK1, JAK2, ARG1, PARP14, PPARG, MED1, PTPN2, SP100, STAT1, TP53, TXK, NR1H2, PARP9, NLRC5, SOCS1, NMI) in astrocytes in the presence of microglia and infiltrating T cells in AD compared to AD cultures lacking T cells (P-values from nonparametric, two-sided, Mann-Whitney test). g, h, Gene ontology of significantly upregulated (g) and downregulated (h) pathways in astrocytes in the presence of microglia and infiltrating T cells in AD compared to AD cultures lacking T cells. Color scale indicates the adjusted P-value for significantly enriched pathways in microglia, and dot size is proportional to the count of genes (P-values were calculated from a Fisher exact test and the adjusted p-values given by Benjamini & Hochberg method).
Extended Data Fig. 7 |
Extended Data Fig. 7 |. NicheNet analysis of upstream ligand-receptor pairs inducing the DE genes of neurons, astrocytes, and microglia upon T-cell infiltration.
a, Dot plot of identity genes for distinct cell types. Color scale (a.u.) indicates the average expression of identity genes in each cell population, and the dot size is proportional to the percentage of cells expressing the identity genes. b, NicheNet’s ligand–target analysis represents potential upstream receptors expressed by neurons, astrocytes, microglia, and T cells associated with the top 20 potential ligands. c, Predicted target genes of the top 20 of potential ligands in AD Neu/AC/iMGL/T-cell cultures vs CTRL.
Extended Data Fig. 8 |
Extended Data Fig. 8 |. Increased level of pro-inflammatory cytokines in the presence of CD8+ T cells and microglia in AD cultures.
a, Quantification of granzyme B, IL-15, IL-2, TFN-α, and CXCL10 in the AD cultures (+/−) CD8+ T cells and iMGL, as measured by MSD assay (n = 6–30 biological replicates from n = 7–10 independent experiments; P-value from two-way ANOVA with Tukey multiple comparisons test). b, Enrichment of major cytotoxic genes (GZMA, GZMB, GZMH, GZMM, and GZMK) in CD4+ naïve, CD4+ memory, and CD8+ cytotoxic T cells in the AD cultures in the presence of microglia. Color scale (a.u.) indicates the expression of identity genes in each cell population. c, Quantification of INF-γ levels in the AD Neu/AC (+/−) iMGL and CD4+ or CD8+ T cells using ELISA assay (n=8 biological replicates; P-value from two-way ANOVA with Tukey multiple comparisons test). (a, c) In boxplots, the center lines show the medians; box limits indicate the 25th and 75th percentiles; whiskers extend 1.5 times the interquartile range from the 25th and 75th percentiles, outliers are represented by dots.
Fig. 1 |
Fig. 1 |. Construction and characterization of a 3D human neuroimmune axis model of AD.
a, Schematic representing a pipeline for modeling the AD brain in a 3D human neuroimmune axis model using stem cell-derived neurons, ACs and microglia, together with peripheral immune cells in a microfluidic system (referred to as the PiChip system). b, Schematic showing the PiChip system, which contains 400 narrow migration microchannels (4 sides, 100 on each side; 10 × 10 × 500 μm3 in height, width and length) connecting the BRAIN compartment to the four PERIPHERAL compartments. c, Confocal images of 3D-differentiated AD Neu/ACs and iMGLs (green) in the BRAIN compartment and nuclei-stained CD8+ cells (blue) in the PERIPHERAL compartments. Scale bar, 500 μm. d, Representative images of microglia morphology in CTRL and AD conditions stained for IBA1 (Neu/AC, gray; iMGL, magenta—left panel). Scale bar, 50 μm (left) and 10 μm (right). e, Microglia branch:body ratio, length and IBA1 expression in CTRL and AD conditions (n = 13 independent ROIs from 5 independent experiments for CTRL and AD branch:body ratio; n = 4 independent ROIs from 4 independent experiments for CTRL and AD microglia length; n = 12 CTRL and n = 18 AD independent ROIs from 5 independent experiments for IBA1 expression). The center lines show the medians, the box limits indicate the 25th and 75th percentiles and the whiskers extend to minimum and maximum values. P values are from a nonparametric, two-sided Mann–Whitney U-test. f, Whole RNA-seq analysis showing inflammatory and activated glial markers in AD cultures compared with CTRL. P values are from a quasi-likelihood edgeR:glmQLFTest method. NS, not significant. g, Highly enriched genes associated with reactive ACs in AD compared with CTRL. P values are from a nonparametric, two-sided Mann–Whitney U-test. h, UMAP visualization of the cell-type composition of the PiChip cultures by single-cell transcriptome profiles. i, Dot plot of identity genes for distinct cell types. Color scale indicates the average expression of identity genes in each cell population and dot size is proportional to the percentage of cells expressing the identity genes. a.u., arbitrary units. jl, Volcano plots of differentially expressed genes (left) and GO of significantly upregulated and downregulated pathways (right) in neurons (j), ACs (k) and microglia (l) in AD compared with CTRL. ER, endoplasmic reticulum. P values are from Wilcoxon’s rank-sum test. Significantly upregulated (P < 0.05 and FC > 0.1) and downregulated (P < 0.05 and FC < 0.1) genes are shown as red and blue dots, respectively.
Fig. 2 |
Fig. 2 |. Selective infiltration of T cells into the AD cellular models and 5×FAD mice.
a, Representative confocal imaging of 3D-differentiated AD Neu/AC/iMGL cultures in the PiChip system (Neu/AC, yellow; iMGL, blue). Scale bar, 500 μm. b, Time-lapse confocal imaging showing migration of CD8+ T cells (nuclei stained, magenta) through microchannels over time toward the PiChip BRAIN compartment containing AD cultures (Neu/AC, yellow; iMGL, blue). Scale bar, 100 μm. c, High magnification of the 3D-differentiated AD Neu/ACs (yellow) and iMGLs (blue) in the BRAIN compartment. Scale bar, 20 μm. d, High magnification of infiltrating CD8+ T cells (nuclei stained, magenta) and AD Neu/ACs (yellow) in the BRAIN compartment. Scale bar, 20 μm. eh, The migration index of CD3+ T cells (n = 68 biological replicates, AD Neu/AC and n = 40, AD Neu/AC/iMGL) (e), CD4+ and CD8+ T cells (n = 32 biological replicates, CD4+ and n = 26, CD8+ T cells) (f), monocytes (n = 60 biological replicates, AD Neu/AC and n = 29, AD Neu/AC/iMGL) (g) and B cells (n = 89 biological replicates, AD Neu/AC and n = 37, AD Neu/AC/iMGL) (h) in the PiChip system. P values are from two-tailed, Wilcoxon’s signed-rank tests and five or six independent experiments. ik, Migration velocity of CD3+ T cells (n = 40–78 biological replicates) (i), monocytes (n = 28–86 biological replicates) (j) and B cells (n = 29–111 biological replicates) (k) via confined microchannels in the PiChip system. P values are from two-way analysis of variance (ANOVA) with Tukey’s multiple-comparison test and five or six independent experiments. lo, The percentage (l and m) and absolute number (n and o) of extravascular CD4+ and CD8+ T cells in 5×FAD and WT brains (n = 12 mice each for WT and 5×FAD for CD4+ T cells, n = 9 mice each for WT and 5×FAD for CD8+ T cells). P values are from a nonparametric, two-sided Mann–Whitney U-test. In eh, the white circles show the medians, the box limits indicate the 25th and 75th percentiles and the whiskers extend 1.5× the interquartile range (IQR) from the 25th and 75th percentiles; polygons represent density estimates of data and extend to extreme values. In io, The center lines show the medians, the box limits indicate the 25th and 75th percentiles and the whiskers extend to minimum and maximum values.
Fig. 3 |
Fig. 3 |. Infiltrating CD8+ T cells dramatically exacerbate neurodegeneration in the AD neuroimmune axis model via interaction with microglia.
a, Schematic representing potential roles of microglia and CD8+ T cells in promoting neurodegeneration in AD. b, The 72-h time-lapse confocal imaging showing recruited T cells and cellular damage in the PiChip BRAIN compartment (AD NeuAC, green; iMGL, magenta). Scale bars, 100 μm. c,d, Quantification of cellular damage in AD and CTRL Neu/ACs ± iMGLs and T cell cultures using GFP+-expressing surface area (c) and cell body count (d) (n = 7–9 independent ROIs for GFP+ and n = 12 for cell count). P values are from two-way ANOVA with Tukey’s multiple-comparison test. e, Representative confocal imaging of cellular damage observed in the presence of CD8+ T cells and microglia in AD conditions compared with CTRL (Neu/AC, green; iMGL, magenta; CD4+/CD8+ T cells, blue) in the PiChip system. Scale bars, 25 μm. f, Quantification of cellular damage in AD Neu/ACs ± iMGLs and CTRL cultures in the presence of CD4+ or CD8+ T cells using cell surface area (GFP, green) (n = 4–15 independent ROIs). P values are from two-way ANOVA with Tukey’s multiple-comparison test. g,h, Quantification of neuronal (Tuj1+-expressing surface area) (g) and AC-damaged ALDH1+-expressing surface area (h) in the AD Neu/AC ± iMGL condition in the presence of CD4+ or CD8+ T cells (n = 10 independent ROIs for Tju1+ and n = 6 for ALDH1+). P values are from two-way ANOVA with Tukey’s multiple-comparison test. i, Representative auto-masking imaging for Neu/AC/iMGL in the presence of CD8+ T cells for quantification of the average neurite density, normalized to cell body counts (neurite, cyan; cell body, magenta) using GFP+ area. j, Quantification of the average neurite density in the AD Neu/AC ± iMGL condition in the presence of CD4+ or CD8+ T cells (n = 10–11 independent ROIs). P values are from two-way ANOVA with Tukey’s multiple-comparison test. In c, d, f, g, h and j, the center lines in the boxplots show the medians, the box limits indicate the 25th and 75th percentiles and the whiskers extend to minimum and maximum values. *P < 0.0332, **P < 0.0021, ***P < 0.0002, ****P < 0.0001.
Fig. 4 |
Fig. 4 |. Compositional changes and inflammatory activity of T cells and microglia in AD conditions.
a, UMAP visualization of T cell-type composition of the PiChip cultures by single-cell transcriptome profiles. Distinct subtypes of T cells (CD4+ naive, CD4+ memory and CD8+ cytotoxic) are depicted by different colors. b, Compositional changes of CD4+ naive, CD4+ memory and CD8+ cytotoxic T cells in AD or CTRL Neu/AC ± iMGL conditions. c,d, Percentage of cytotoxic CD8+ T cells (c) and memory CD4+ T cells (d) in AD or CTRL Neu/AC ± iMGL conditions (n = 5 independent experiments for both cytotoxic CD8+ T and memory CD4+ T cells). P values are from two-way ANOVA with Tukey’s multiple-comparison test. e, UMAP visualization of T cell-type composition of the PiChip cultures by single-cell transcriptome profiles. Distinct subtypes of T cells (homeostatic, DAM, MHC-II, proinflammatory, cytokine 1, cytokine 2, proliferative and ribosomal) are depicted by different colors. f, Compositional changes of homeostatic, DAM, MHC-II, proinflammatory, cytokine 1, cytokine 2, proliferative and ribosomal microglial cells in AD or CTRL Neu/AC/iMGL ± T cells. g,h, Percentage of DAM (g) and MHC-II (h) in AD or CTRL Neu/AC/iMGL ± T cell conditions (n = 5 independent experiments for both DAM and MHC-II quantification). P values are from two-way ANOVA with Tukey’s multiple-comparison test. i, Volcano plots of differentially expressed genes in microglia in AD Neu/AC/iMGL cultures versus CTRL in the presence of infiltrating T cells. The P value is from Wilcoxon’s rank-sum test. Significantly upregulated (P < 0.05 and FC > 0.1) and downregulated (P < 0.05 and FC < 0.1) genes are shown as red dots. j, Violin plots showing selected significantly enriched, IFN-associated genes (IFITM1 and STAT1) in microglia in AD cultures compared with CTRL in the presence of T cells (n = 5 independent experiments). P values are from a nonparametric, two-sided Mann–Whitney U-test. k, GO of significantly upregulated and downregulated pathways (FDR < 0.1) in microglia in AD cultures versus CTRL in the presence of T cells. P values were calculated from Fisher’s exact test and the adjusted P values are given using the Benjamini–Hochberg method. In c, d, g and h, the center lines in the boxplots show the medians, the box limits indicate the 25th and 75th percentiles and the whiskers extend to minimum and maximum values. In j, the white circles show the medians, the box limits indicate the 25th and 75th percentiles and the whiskers extend 1.5× the IQR from the 25th and 75th percentiles; polygons represent density estimates of data and extend to extreme values.
Fig. 5 |
Fig. 5 |. Upregulation of CXCL10 in the AD neuroimmune axis model and 5×FAD brain.
a, Quantification of chemokines in AD Neu/AC ± iMGL cultures compared with CTRL (n = 4 independent experiments all Neu/AC cultures; n = 2 for Neu/AC/iMGL cultures except CXCL10, n = 4; data are mean ± s.e.m.) P values are from two-way ANOVA with Tukey’s multiple-comparison test. b, ScRNA-seq data showing highly enriched astrocytic CXCL10 expression in AD cultures compared with CTRL (n = 5 independent experiments). P values are from a nonparametric, two-sided Mann–Whitney U-test. c, CXCL10 protein level from ACs in the presence of AD and CTRL cultures (n = 9 biological replicates except for AC only, n = 7) P values are from a nonparametric Kruskal–Wallis test with Dunn’s multiple-comparison test. d, Schematics describing an in vitro chemotaxis model where recombinant human CXCL10 was added to the CHEMOKINE compartment, whereas CD4+ and CD8+ T cells were added to the PERIPHERAL compartment. e, Time-lapse microscopy imaging showing chemotaxis of T cells (nuclei stained, blue) toward CXCL10 through confined microchannels over time. f, The number of migrated CD4+ and CD8+ T cells in response to CXCL10 (100 nM) after 17 h (n = 44 biological replicates, CD4+ and n = 47, CD8+). P values are from two-tailed, Wilcoxon’s signed-rank tests. g, Migration velocity of CD4+ and CD8+ T cells through microchannels over 17 h toward CXCL10 (100 nM) (n = 44 biological replicates, CD4+ and n = 47, CD8+). P values are from a nonparametric, two-sided Mann–Whitney U-test. h, Representative immunofluorescence staining of CD8+ T cells (magenta), co-labeled with CXCR3 (yellow) and DAPI (nuclei) in 6- to 7-month-old 5×FAD mouse brains. Scale bar, 20 μm. i, CXCR3 expression for distinct T cell types in different conditions using scRNA-seq data. The color scale (arbitrary units (a.u.)) indicates the average expression of the CXCR3 gene in each cell population and the dot size is proportional to the percentage of cells expressing the CXCR3 gene. j, Representative immunofluorescence staining of 6- to 7-month-old 5×FAD and WT mouse brains co-labeled with anti-CXCL10 (red), anti-GFAP (green) and DAPI (nuclei). Scale bar, 100 μm and 35 μm in inserts. k,l, The percentage of CXCL10 in 6- to 7-month-old 5×FAD and WT brains (n = 13, 5×FAD and n = 8, WT mice): hippocampus (k) and cortex (l). P values are from a nonparametric, two-sided Mann–Whitney U-test. In c, f, g, k and l, the boxplots show center lines as the medians, the box limits indicate the 25th and 75th percentiles and the whiskers extend 1.5× the IQR from the 25th and 75th percentiles; outliers are represented as dots.
Fig. 6 |
Fig. 6 |. Blocking the binding of CXCL10 to T cell CXCR3 attenuates T cell infiltration and neurodegeneration in the neuroimmune axis model.
a, Schematic showing the experimental design for inhibition of the CXCL10–CXCR3 signaling axis in AD cultures using a neutralizing antibody. b,c, The percentage of CD4+ and CD8+ T cells in human blood (b) and percentage level of CXCR3 receptor expression in CD4+ and CD8+ T cells using flow cytometry (c) (n = 10 donors each for the percentage of T cells; n = 8 donors each for the percentage of CXCR3+ T cells). P values are from nonparametric, two-sided Mann–Whitney U-test. d,e, Representative histogram images of flow cytometry before and after blocking CXCR3 receptor in CD4+ (d) and CD8+ (e) T cells with a neutralizing antibody (MAB160, 10 μg ml−1). Box plots representing percentage level of CXCR3 expression in T cells (n = 8 donors for CD4+ T cells and n = 6 donors for CD8+ T cells). P values are from a nonparametric, two-sided Mann–Whitney U-test. f, Time-lapse confocal imaging showing the migratory movement of CD8+ T cells (nuclei stained, magenta) through microchannels over time before (Ctrl T cell) and after treatment with MAB160, 10 μg ml−1 of neutralizing antibody (Inh. T cell) toward the BRAIN compartment containing Neu/AC/iMGL (gray) culture. Scale bar, 100 μm. g, Quantification of migration indexinhibited (Methods) of CD4+ and CD8+ T cells with and without CXCR3-neutralizing antibody treatment (MAB160, 10 μg ml−1) in the PiChip system containing AD Neu/AC/iMGL cultures (n = 36 biological replicates each for CD4+ and CD8+ T cells). P values are from two-tailed Wilcoxon’s signed-rank tests and five or six independent experiments. h, Average migration velocity of infiltrating CD4+ and CD8+ T cells with and without MAB160 treatment (10 μg ml−1) through the microchannels over 17 h in the PiChip system (n = 33 biological replicates, CTRL and n = 30, treated for CD4+ T cells; n = 24 biological replicates, CTRL and n = 31, treated for CD8+ T cells). P values are from a nonparametric, two-sided Mann–Whitney U-test. NS, not significant. i, Schematic representing the potential effect of CXCR3-neutralizing antibody (MAB160) on cellular damage in AD cultures. j, Boxplots representing quantification of GFP+-expressing surface area, cell body count and Tuj1+-expressing surface area in AD Neu/AC/iMGL cultures before and after T cell treatment with CXCR3-neutralizing antibody (MAB160, 10 μg ml−1) (n = 13 or 14 independent ROIs for GFP+ and cell count; n = 13 for Tuj1+). P values are from a nonparametric, two-sided Mann–Whitney U-test. In b, c, d, e, h and j, the center lines in boxplots show the medians, the box limits indicate the 25th and 75th percentiles and the whiskers extend to minimum and maximum values. In g, the white circles show the medians, the box limits indicate the 25th and 75th percentiles and the whiskers extend 1.5× the IQR from the 25th and 75th percentiles; polygons represent density estimates of data and extend to extreme values.
Fig. 7 |
Fig. 7 |. Proposed mechanism for selective infiltration of CD8+ T cells into an environment of AD pathology and subsequent interaction with microglia, leading to enhanced neurodegeneration and neuroinflammation.
AD pathology leads to elevated levels of proinflammatory recruitment chemokines, for example, CCL2 and CXCL10. T cells selectively infiltrate an environment of AD pathology in the neuroimmune axis model after binding of CXCL10 to its T cell receptor, CXCR3. The interaction of CCL2 with CCR2 induces recruitment of microglial cells to AD pathology. Infiltrating CD8+ T cells activate IFN/inflammatory pathways in microglia and ACs, resulting in a synergistic and vicious cycle that dramatically exacerbates cellular damage and neuroinflammation in AD. Blocking the binding of CXCL10 to the CD8+ T cell CXCR3 significantly attenuates selective infiltration of CD8+ T cells into an environment of AD pathology in the AD neuroimmune axis model and prevents neurodegeneration.

References

    1. Jorfi M, Maaser-Hecker A & Tanzi RE The neuroimmune axis of Alzheimer’s disease. Genome Med. 15, 6 (2023). - PMC - PubMed
    1. Bettcher BM, Tansey MG, Dorothée G & Heneka MT Peripheral and central immune system crosstalk in Alzheimer disease—a research prospectus. Nat. Rev. Neurol. 17, 689–701 (2021). - PMC - PubMed
    1. Arlehamn CSL, Garretti F, Sulzer D & Sette A Roles for the adaptive immune system in Parkinson’s and Alzheimer’s diseases. Curr. Opin. Immunol. 59, 115–120 (2019). - PMC - PubMed
    1. Wu K-M et al. The role of the immune system in Alzheimer’s disease. Ageing Res. Rev. 70, 101409 (2021). - PubMed
    1. Cao W & Zheng H Peripheral immune system in aging and Alzheimer’s disease. Mol. Neurodegen. 13, 51 (2018). - PMC - PubMed

Publication types

LinkOut - more resources